- China’s steel sector unlikely to be curbed as production rises, delivering mixed signal for prices
- Magnetite Mines wants to double the size of its high grade Razorback mine to 5Mtpa
- Whitehaven increased cap on buyback after price run sees coal miner return $441.5m to shareholders
Experts say the Chinese Government is unlikely to order steel production cuts in September as its industry recovers from a horrible July and August.
MySteel’s regular early month survey showed its crude steel output averaged 2.86Mt a day through the first 10 days of the month, up 3.7% from late August after maintenance at loss-making steel mills curbed steel output through the middle of the year.
Mill margins have been weaker than usual this year with high raw material costs (particularly coke and electricity) and weak demand from property developers seeing steel companies lose an average US$70/t in June.
S&P Global says market participants expect crude steel output to hit as much as 3Mt per day in September, potentially threatening expectations of a 3% decline expected by analysts in line with Chinese authorities’ desire to keep production below 2021 levels.
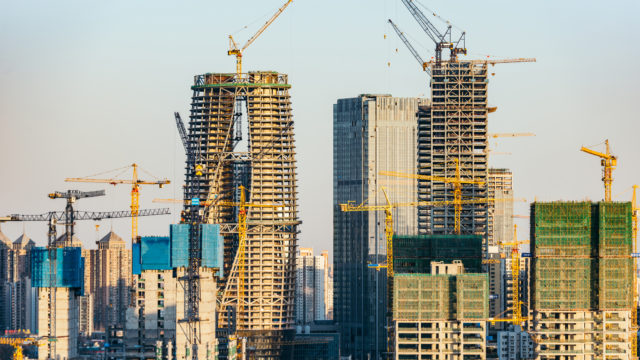
Steel production is responsible for around 8% of the world’s CO2 emissions, and an even higher proportion of China’s given the country produces almost 60% of the world’s raw steel.
For that reason environmental and pollution controls have been used to restrict productivity in recent years, notably in late 2021 when prices for iron ore, the main steel ingredient and Australia’s largest export commodity, fell US$150/t in just six months to US$87/t.
But China is facing far more significant pressure this year to keep its industry ticking along in the forlorn hopes of meeting a fanciful 5.5% GDP growth target after locking its economy down in a Covid-stricken 2022 so far.
That could put the shudders through recovering steel prices again, with S&P saying market participants are concerned demand will not be high enough to justify increased production.
“Due to the drag from the debt-laden property sector and another round of COVID resurgence, end-user demand, especially for long steel, has been modest so far in September,” one told S & P. “Oversupply could surface again if demand fails to improve further.”
Iron ore price back on track
Iron ore prices have responded well to the lift in steel output, with Singapore futures rising 1.74% to US$103.85/t yesterday.
Having briefly dropped below US$100/t, prices have found support at the psychologically important level, which portends thick margins for the majors in the Pilbara, all of whom produce and sell their iron ore at a cost of around US$20/t.
65% Brazilian fines are trading for up to US$113.6/t according to Shanghai Metals Market.
The market is hopeful China will introduce stimulus policies or wind back its Covid Zero management approach to reinvigorate its economy next month.
S&P warned traders in China remain pessimistic.
“Some market participants said a further boost to steel demand from previously introduced stimulus was likely to be limited and further stimulus was not likely until after October at the earliest,” they said.
The higher the grade the better
A reminder of the massive challenge facing the steel industry to cut its emissions intensity was delivered by junior iron ore developer Magnetite Mines (ASX:MGT) yesterday.
Shares in the South Australian explorer, which owns the Razorback magnetite project in the undeveloped Braemar iron formation, lifted 7.7% as it announced plans to double its initial production profile to 5Mtpa to meet increased demand for premium iron ore products.
It has also started optimisation studies to investigate the delivery of higher grade iron ore products potentially including direct reduction grade concentrates.
Those types of products are important in a net zero world because only high grades of iron ore with low levels of impurities can be used in processes like direct reduced iron.
At the moment just 100Mt of iron ore is delivered to this specification out of a seaborne market of around 1.5Bt.
Even more concerning, a large portion of that supply comes out of Ukraine and Russia.
The expansion of the Razorback mine will also improve MGT’s economies of scale.
MGT says the all-in breakeven cost for its single step expansion case will come down from US$53/t to US$40/t, a price iron ore has traded above 99% of the last 10 years.
According to analysis from WoodMac, that would make the mine a lowest quartile cost producer.
“In raising its sights, the company is responding to direct evidence of rapidly-evolving market conditions associated with the decarbonisation requirements of the iron and steelmaking industry. The company has anticipated this shift and has strengthened its team accordingly,” CEO Tim Dobson said.
“The current Razorback Ore Reserve represents only 11% of the company’s Mineral Resources, so this strategic shift to a larger initial production scale better aligns the project with the resource potential, while still taking advantage of the abundant existing infrastructure that will support a pragmatic, staged development agenda.
“The company is committed to returning the highest possible value to shareholders, and this strategic shift is fully aligned with that objective.”
Magnetite Mines (ASX:MGT) share price today:
| CODE | COMPANY | PRICE | 1 WEEK RETURN % | 1 MONTH RETURN % | 6 MONTH RETURN % | 1 YEAR RETURN % | MARKET CAP |
|---|
| ACS | Accent Resources NL | 0.042 | 0% | 0% | -25% | -22% | $ 19,573,145.89 |
| ADY | Admiralty Resources. | 0.011 | 10% | 22% | -35% | -39% | $ 13,035,791.53 |
| AKO | Akora Resources | 0.225 | 41% | 36% | -40% | 0% | $ 13,016,873.52 |
| BCK | Brockman Mining Ltd | 0.028 | 4% | 0% | -38% | -42% | $ 278,406,963.93 |
| BHP | BHP Group Limited | 39.3 | 5% | 1% | -7% | 6% | $ 199,643,988,111.96 |
| CIA | Champion Iron Ltd | 5.47 | 6% | 9% | -20% | 0% | $ 2,844,562,193.00 |
| CZR | CZR Resources Ltd | 0.019 | 12% | 27% | 171% | 138% | $ 62,753,818.99 |
| DRE | Dreadnought Resources Ltd | 0.115 | -12% | 24% | 188% | 211% | $ 364,924,026.12 |
| EFE | Eastern Resources | 0.028 | -3% | -18% | -40% | -13% | $ 29,195,190.30 |
| CUF | Cufe Ltd | 0.02 | 11% | -5% | -43% | -69% | $ 18,356,134.94 |
| FEX | Fenix Resources Ltd | 0.265 | 6% | -16% | 6% | -7% | $ 142,015,619.20 |
| FMG | Fortescue Metals Grp | 18.23 | 11% | -4% | 0% | -1% | $ 56,652,954,491.20 |
| FMS | Flinders Mines Ltd | 0.65 | -13% | 37% | 30% | -30% | $ 111,440,060.82 |
| GEN | Genmin | 0.22 | -12% | -12% | 5% | 13% | $ 62,323,327.00 |
| GRR | Grange Resources. | 0.78 | 3% | -36% | -22% | 67% | $ 983,737,893.30 |
| GWR | GWR Group Ltd | 0.085 | -4% | -9% | -47% | -53% | $ 28,267,065.64 |
| HAV | Havilah Resources | 0.35 | -1% | 4% | 89% | 79% | $ 109,240,527.45 |
| HAW | Hawthorn Resources | 0.096 | 7% | 9% | 13% | 100% | $ 32,017,498.85 |
| HIO | Hawsons Iron Ltd | 0.5 | 16% | 59% | 150% | 481% | $ 374,231,739.75 |
| IRD | Iron Road Ltd | 0.145 | 4% | 0% | -19% | -31% | $ 111,980,582.56 |
| JNO | Juno | 0.115 | -4% | -8% | 0% | -38% | $ 14,922,380.11 |
| LCY | Legacy Iron Ore | 0.02 | 5% | 3% | 5% | 33% | $ 121,729,697.78 |
| MAG | Magmatic Resrce Ltd | 0.145 | -24% | 67% | 51% | 32% | $ 44,535,189.65 |
| MDX | Mindax Limited | 0.059 | 0% | 0% | 0% | 40% | $ 115,533,663.12 |
| MGT | Magnetite Mines | 0.028 | 17% | -3% | -3% | -3% | $ 98,586,138.61 |
| MGU | Magnum Mining & Exp | 0.034 | -3% | -24% | -56% | -62% | $ 18,121,689.44 |
| MGX | Mount Gibson Iron | 0.46 | 7% | -10% | -12% | -2% | $ 546,488,699.85 |
| MIN | Mineral Resources. | 73.8 | 22% | 24% | 59% | 40% | $ 13,841,422,229.88 |
| MIO | Macarthur Minerals | 0.16 | -3% | -20% | -61% | -73% | $ 25,800,558.08 |
| PFE | Panteraminerals | 0.11 | -8% | -21% | -35% | -70% | $ 5,665,123.20 |
| PLG | Pearlgullironlimited | 0.031 | 0% | -21% | -64% | 0% | $ 1,701,971.55 |
| RHI | Red Hill Iron | 3.7 | -1% | 9% | 6% | 28% | $ 241,908,684.71 |
| RIO | Rio Tinto Limited | 96.75 | 7% | 1% | -13% | -9% | $ 35,651,605,192.56 |
| RLC | Reedy Lagoon Corp. | 0.016 | 0% | -6% | -38% | -33% | $ 9,476,257.50 |
| SHH | Shree Minerals Ltd | 0.0085 | 6% | -15% | -53% | -29% | $ 10,527,138.58 |
| SRK | Strike Resources | 0.11 | 18% | -19% | -8% | -24% | $ 29,700,000.00 |
| SRN | Surefire Rescs NL | 0.016 | 14% | -6% | 7% | 14% | $ 25,301,815.63 |
| TI1 | Tombador Iron | 0.024 | -11% | -20% | -41% | -45% | $ 28,619,296.12 |
| TLM | Talisman Mining | 0.155 | 0% | -2% | -6% | -6% | $ 29,099,622.04 |
| VMS | Venture Minerals | 0.027 | 4% | -16% | -33% | -70% | $ 45,291,354.98 |
| EQN | Equinoxresources | 0.15 | -12% | -12% | -19% | 0% | $ 6,975,000.16 |
Rain on coal’s parade?
Coal is still over US$400/t, something Australia’s third consecutive La Nina summer in three years is unlikely to help.
Supplies out of the east coast and particularly the port of Newcastle have been severely hampered by both Covid and rain in recent years, exacerbating shortages in the seaborne market.
Prices will be supported by that, with little indication Russia’s invasion of Ukraine will end and ease energy shortages in Europe any time soon.
It’s a good time to be bad as far as coal miners are concerned. With little future growth to invest in they are returning more cash to shareholders than they have in years.
After a monster dividend season, many are still undertaking share buyback programs.
Whitehaven Coal (ASX:WHC) yesterday said the share buyback it started on March 8 has now delivered $441.5m to shareholders, with the company needing to increase its cap after a run in its share price to record levels.
So far 86.1 million shares (8.3%) have been bought back at an average price of $5.13.
17.2m shares need to be bought back to hit the 10% target, but WHC has had to increase that cap from $550m to $620m to complete the buyback before its October 26 AGM.
Whitehaven shares are currently trading for $8.46.
| CODE | COMPANY | PRICE | 1 WEEK RETURN % | 1 MONTH RETURN % | 6 MONTH RETURN % | 1 YEAR RETURN % | MARKET CAP |
|---|
| NAE | New Age Exploration | 0.006 | 0% | -25% | -45% | -54% | $ 8,615,393.46 |
| CKA | Cokal Ltd | 0.23 | 0% | 7% | 48% | 39% | $ 216,073,265.40 |
| NCZ | New Century Resource | 1.55 | 10% | -18% | -20% | -35% | $ 187,316,719.59 |
| BCB | Bowen Coal Limited | 0.38 | -13% | 25% | 36% | 130% | $ 595,796,552.12 |
| LNY | Laneway Res Ltd | 0.0055 | 0% | 10% | -4% | 43% | $ 35,959,090.26 |
| GRX | Greenx Metals Ltd | 0.215 | 5% | -23% | 8% | -28% | $ 54,528,399.76 |
| AKM | Aspire Mining Ltd | 0.095 | 0% | 17% | 10% | 12% | $ 47,717,876.59 |
| AVM | Advance Metals Ltd | 0.012 | 0% | 20% | -20% | -36% | $ 5,734,528.82 |
| AHQ | Allegiance Coal Ltd | 0.115 | 5% | -18% | -79% | -82% | $ 52,477,517.50 |
| YAL | Yancoal Aust Ltd | 6.66 | -1% | 28% | 30% | 158% | $ 9,031,805,749.08 |
| NHC | New Hope Corporation | 5.5 | -4% | 25% | 92% | 139% | $ 4,570,226,415.72 |
| TIG | Tigers Realm Coal | 0.02 | 11% | 11% | 100% | 18% | $ 248,267,344.99 |
| SMR | Stanmore Resources | 2.29 | -6% | 2% | 48% | 184% | $ 2,127,260,807.28 |
| WHC | Whitehaven Coal | 8.46 | -4% | 28% | 109% | 182% | $ 8,223,936,207.20 |
| BRL | Bathurst Res Ltd. | 0.93 | -2% | 3% | -9% | 41% | $ 176,050,997.60 |
| CRN | Coronado Global Res | 1.68 | -3% | -6% | -9% | 47% | $ 2,732,619,579.90 |
| JAL | Jameson Resources | 0.08 | 0% | -6% | 0% | 0% | $ 27,856,264.96 |
| TER | Terracom Ltd | 1.06 | 3% | 29% | 147% | 524% | $ 831,498,998.72 |
| ATU | Atrum Coal Ltd | 0.009 | 0% | 0% | -36% | -75% | $ 6,222,315.02 |
| MCM | Mc Mining Ltd | 0.54 | 80% | 151% | 551% | 332% | $ 112,663,275.90 |
You might be interested in