Bulk Buys: Iron ore is heading into peak steel season, but it could be stopped in its tracks

Pic: CUHRIG/E+ via Getty Images
- Iron ore normally catches a bid heading into the peak steel production season, but high stockpiles mean prices could fall further after a US$40/t drop in the March quarter
- Canberra thinks falling prices will do little to stem output growth in the Pilbara
- Whitehaven completes BHP met coal deal as coking coal prices fall prey to lower steel demand
Iron ore has defied macroeconomic fundamentals pertaining to China’s property sector for a long time, its volatility regularly seeing the commodity bound well beyond US$100/t — seriously profitable territory for most miners — despite the near on collapse of many of its end users.
From a supply and demand perspective it’s made more sense. China’s steel industry was propped up by export demand last year with the aftereffects of Covid, energy prices and high interest rates hurting overseas competitors, a situation now unwinding.
That led to slightly higher steel output in China — slightly above 1Bt for the fourth year running — with iron ore stocks also being drawn down to long term lows.
But recent weeks have seen a massive recovery in supply not matched by demand markers, with China’s Government reluctant at last month’s Two Sessions meeting to announce ‘bazooka style’ stimulus to pick property developers and home builders off the canvas.
Manufacturing data is looking better, both the official NBS and private Caixin PMIs showing factory activity was growing last month, even if the steel industry’s paltry 44.2 PMI was a sour point. Any score below 50 is a contraction.
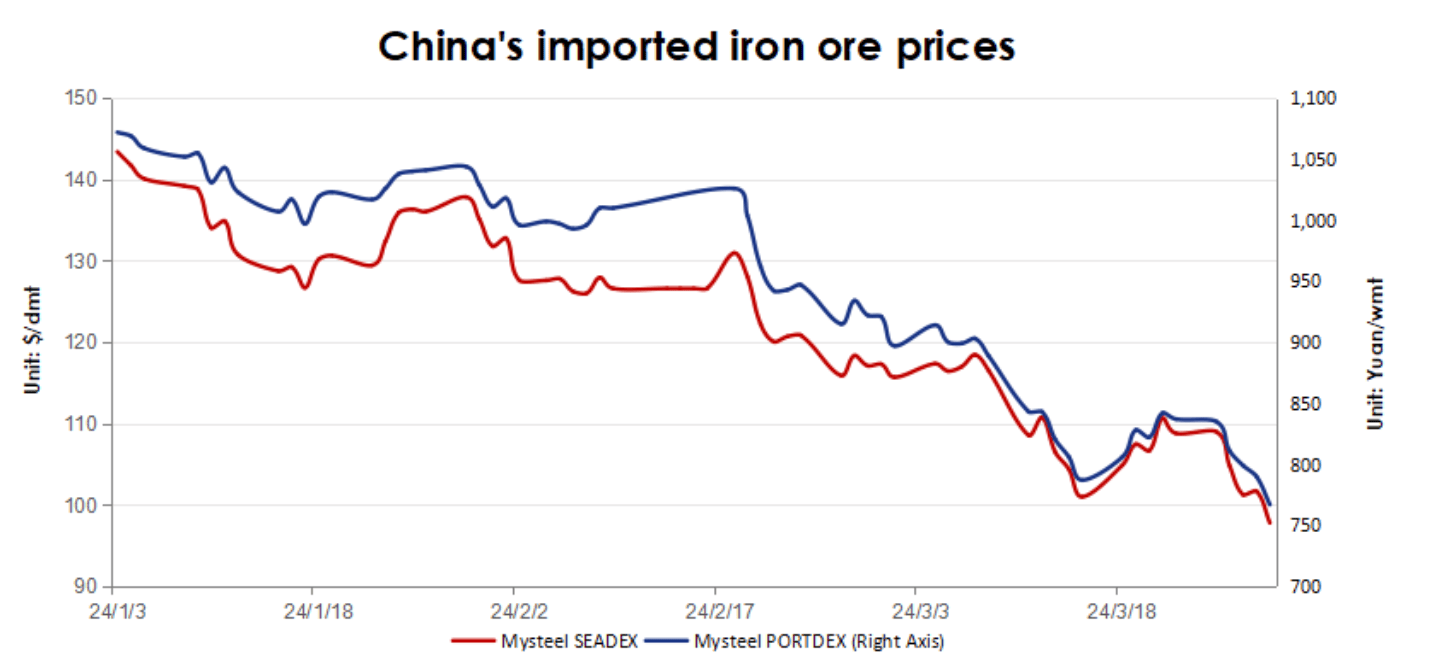
Prices, which briefly tipped below US$100/t to 10-month lows, have recovered to ~US$101/t for 62% Fe fines in Singapore, even though rebar steel prices have been weak.
But Chinese analysts MySteel have poured cold water on hopes of a big price revival after falling from over US$140/t at the start of the year.
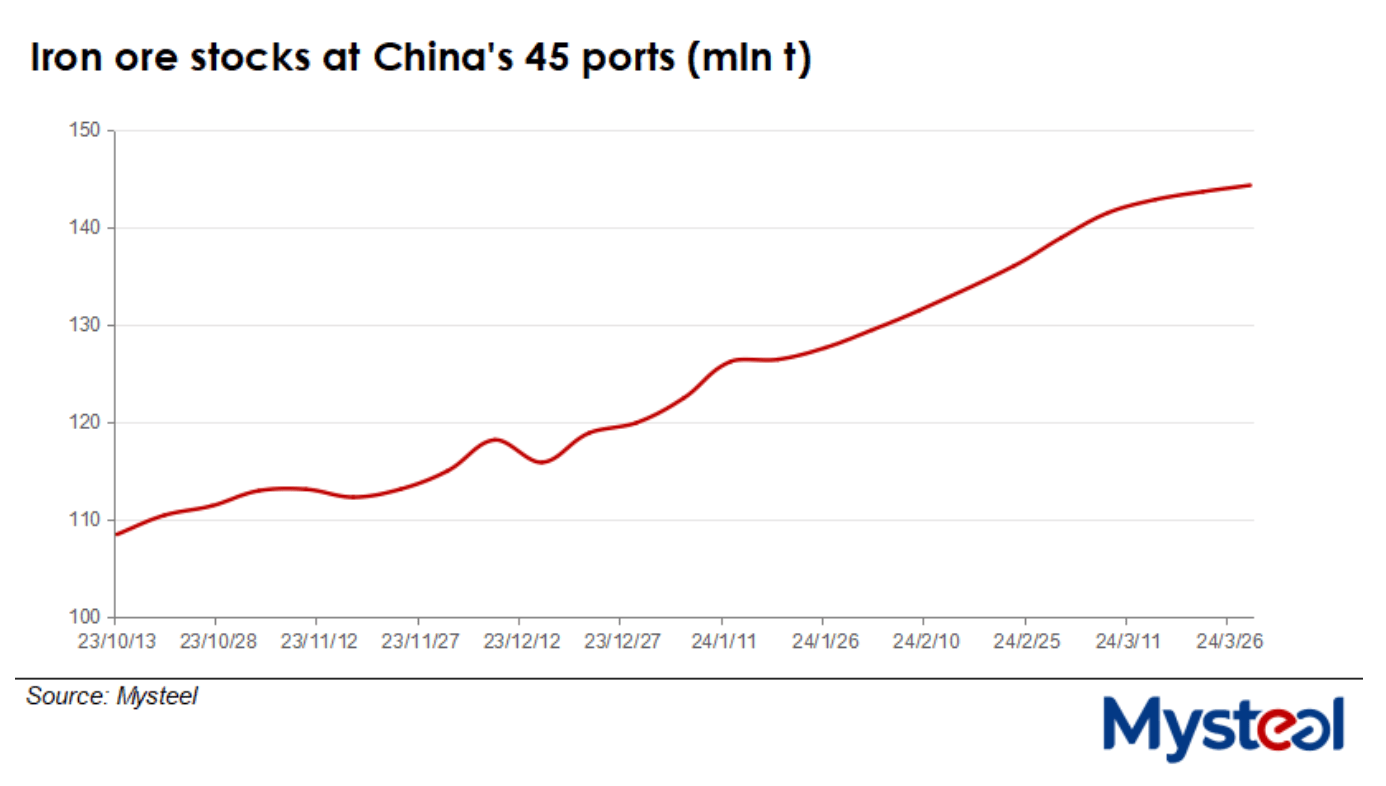
MySteel projects that port stocks will lift beyond 150Mt by the end of the month.
It comes despite the fact we are coming into what is generally considered the peak season for steel production in China.
“Hot metal output among the 247 Chinese steelmakers Mysteel checks regularly fell to an average of 2.21 million tonnes/day during March 22-28 for an on-month decrease of 15,500 t/d. The output was also 9% lower than the level during the same period last year,” MySteel’s Lea Li said in a note.
“Despite this, Chinese steel mills are expected to gradually lift their steel output this month in anticipation of improvements in steel consumption, Mysteel’s report predicted, pointing out that should this happen, iron ore prices will rebound mildly in the early part of this month.
“Nevertheless, the rise in steel output may outpace any increase in end-user steel demand, which in turn will decelerate the pace of destocking among the mills and turn market fundamentals negative. As a result, market sentiment will deteriorate leading iron ore prices to experience notable drops in turn, according to the report.
“Meanwhile, although steelmakers’ demand for iron ore will likely rise in April amid their higher production of hot metal, the scheduled increase in arrivals of ore carriers at Chinese ports this month will result in a further accumulation of portside iron ore stocks.
“The inventories of ore piled at China’s major 45 ports reached 144.3 million tonnes on March 28 for an on-month gain of 3.7% and making for the fourteenth consecutive weekly increase. Mysteel forecasts that by the latter part of this month, stocks will have risen above 150 million tonnes.”
Could this impact dividends?
It goes without saying while current iron ore prices could hit marginal producers, it’s unlikely to leave a dent on the expansion plans of Australia’s cohort of mining giants.
Even if prices were to fall US$30/t over the long term, the Federal Department of Science, Industry and Resources said, in the Office of the Chief Economist’s Resources and Energy Quarterly last week, that Australia’s output would still rise from 893Mt in 2023 to 983Mt by 2029.
“Rising steel demand and production capacity in regions such as emerging Asia and the Middle East will see ex-China iron ore demand increase over the outlook period. This includes over 100 million tonnes of integrated (Blast Furnace-Basic Oxygen Furnace) steelmaking capacity expected to come online in the next few years in Asia alone,” the report stated.
“Turning to global iron ore supply, the world’s two largest producers — Australia and Brazil — are expected to continue to collectively grow export volumes by 3% per annum over the outlook period to 2029.
“This follows a ramp up of greenfield projects for major Australian miners, and major expansions planned by Brazilian producers including Vale and CSN. New supply from emerging producers in Africa will also contribute to the growth in global trade of iron ore.
“From an estimated average price of around US$105 a tonne (FOB) in 2023, the benchmark iron ore price is projected to steadily fall to an average of about US$68 a tonne in real terms by 2029. These declines are not expected to result in significant Australian capacity being closed or cut back.”
Dividends have fallen from the all-time highs seen in 2021, after iron ore prices hit a record of US$237/t, but have remained solid with Rio Tinto (ASX:RIO) paying out 60% of profits at its full year result in February, BHP (ASX:BHP) paying 56% despite recording a big impairment on its nickel division and Samarco provision, and Fortescue (ASX:FMG) returning 65%.
In a note this week, Morgan Stanley has predicted BHP will drop its payout to 50% by FY25 with the Samarco disaster still hanging over its head.
ASX iron ore stocks
Scroll or swipe to reveal table. Click headings to sort.
| CODE | COMPANY | PRICE | WEEK RETURN % | MONTH RETURN % | 6 MONTH RETURN % | YEAR RETURN % | MARKET CAP |
|---|---|---|---|---|---|---|---|
| ACS | Accent Resources NL | 0.007 | 0% | -30% | -13% | -72% | $ 3,311,890.98 |
| ADY | Admiralty Resources. | 0.006 | 0% | -14% | 0% | -25% | $ 8,961,474.92 |
| AKO | Akora Resources | 0.16 | -6% | 3% | 7% | -6% | $ 15,672,164.31 |
| BCK | Brockman Mining Ltd | 0.024 | -4% | -14% | -4% | -8% | $ 222,725,571.14 |
| BHP | BHP Group Limited | 44.86 | 3% | 0% | 1% | -5% | $ 228,878,185,771.21 |
| CIA | Champion Iron Ltd | 7.23 | 1% | -9% | 16% | 1% | $ 3,838,907,784.66 |
| CZR | CZR Resources Ltd | 0.275 | 0% | 4% | 83% | 49% | $ 64,827,027.65 |
| DRE | Dreadnought Resources Ltd | 0.018 | 0% | 0% | -63% | -72% | $ 62,668,313.28 |
| EFE | Eastern Resources | 0.007 | 0% | -13% | -22% | -42% | $ 9,314,598.46 |
| CUF | Cufe Ltd | 0.012 | -8% | -14% | -20% | -25% | $ 14,326,404.56 |
| FEX | Fenix Resources Ltd | 0.2625 | 1% | 9% | 17% | 7% | $ 180,600,659.20 |
| FMG | Fortescue Ltd | 25.19 | 0% | -4% | 20% | 12% | $ 78,267,288,215.56 |
| RHK | Red Hawk Mining Ltd | 0.71 | 8% | 12% | 6% | 73% | $ 140,725,315.70 |
| GEN | Genmin | 0.093 | -42% | -42% | -42% | -46% | $ 66,467,255.29 |
| GRR | Grange Resources. | 0.44 | 2% | -3% | -9% | -39% | $ 515,015,720.61 |
| GWR | GWR Group Ltd | 0.1 | 0% | 9% | 19% | 5% | $ 33,727,748.78 |
| HAV | Havilah Resources | 0.17 | 3% | 6% | -31% | -46% | $ 53,828,665.70 |
| HAW | Hawthorn Resources | 0.07 | -7% | -9% | -24% | -14% | $ 23,451,092.91 |
| HIO | Hawsons Iron Ltd | 0.033 | -3% | -8% | -23% | -47% | $ 31,248,416.01 |
| IRD | Iron Road Ltd | 0.07 | 9% | 17% | -14% | -33% | $ 57,569,623.58 |
| JNO | Juno | 0.065 | 0% | -10% | -13% | -27% | $ 12,190,332.42 |
| LCY | Legacy Iron Ore | 0.014 | -7% | -13% | -13% | -7% | $ 115,703,223.93 |
| MAG | Magmatic Resrce Ltd | 0.12 | 21% | 140% | 71% | 2% | $ 34,729,144.36 |
| MDX | Mindax Limited | 0.039 | -3% | -3% | -22% | -70% | $ 79,776,792.42 |
| MGT | Magnetite Mines | 0.27 | -2% | 6% | -9% | -54% | $ 28,053,839.63 |
| MGU | Magnum Mining & Exp | 0.017 | 0% | 6% | -35% | -19% | $ 13,759,143.85 |
| MGX | Mount Gibson Iron | 0.43 | 1% | -15% | -8% | -20% | $ 534,548,842.52 |
| MIN | Mineral Resources. | 70.37 | 4% | 4% | 4% | -13% | $ 13,858,236,388.00 |
| MIO | Macarthur Minerals | 0.094 | -6% | -19% | -44% | -39% | $ 16,173,742.27 |
| PFE | Panteraminerals | 0.038 | -28% | -16% | -33% | -59% | $ 11,461,211.26 |
| PLG | Pearlgullironlimited | 0.029 | -3% | -6% | 4% | -15% | $ 6,136,253.70 |
| RHI | Red Hill Minerals | 5.65 | 0% | 6% | 20% | 24% | $ 351,468,535.00 |
| RIO | Rio Tinto Limited | 123.06 | 1% | -1% | 7% | 2% | $ 45,507,395,674.26 |
| RLC | Reedy Lagoon Corp. | 0.004 | 0% | 0% | -43% | -41% | $ 2,478,162.93 |
| CTN | Catalina Resources | 0.004 | 0% | 0% | 0% | 0% | $ 4,953,947.57 |
| SRK | Strike Resources | 0.045 | 0% | -2% | -21% | -22% | $ 13,336,250.00 |
| SRN | Surefire Rescs NL | 0.009 | -10% | -18% | -36% | -57% | $ 19,863,078.13 |
| TI1 | Tombador Iron | 0.014 | 0% | 0% | -26% | -39% | $ 30,218,753.22 |
| TLM | Talisman Mining | 0.265 | 51% | 47% | 96% | 104% | $ 50,846,494.23 |
| VMS | Venture Minerals | 0.022 | -4% | 10% | 100% | 7% | $ 52,133,633.15 |
| EQN | Equinoxresources | 0.22 | 0% | -17% | 22% | 33% | $ 23,270,250.69 |
| AMD | Arrow Minerals | 0.005 | 0% | -17% | 67% | 25% | $ 47,398,531.85 |
| CTM | Centaurus Metals Ltd | 0.31 | -2% | 19% | -54% | -67% | $ 148,499,201.10 |
Coking coal caught up in iron ore malaise
Coking coal has similarly found itself the victim of a selloff in steel raw materials in recent weeks, falling from over US$300/t to US$249/t in Singapore over the past month.
It comes as coal miners increasingly seek out met coal assets to balance and dominate their portfolios after a massive premium expected to hold over the long term emerged for steelmaking coal over thermal coal last year.
That came to fruition on Tuesday for Whitehaven Coal (ASX:WHC), after the NSW coal miner completed a US$4.1 billion ($6.4b) staged deal to acquire BHP’s Daunia and Blackwater mines.
It is expected to complete a selldown of a ~20% stake soon to an Indian or Japanese steelmaker of the longer life Blackwater mine.
But Whitehaven will hold up any sell down of the smaller Daunia as it looks at options to plug its nearby but undeveloped Winchester South deposit into the project.
The company expects the newly acquired 17Mtpa operations to convert its revenue share from a 90-10 thermal to met split to 70% met coal.
ASX coal stocks
Scroll or swipe to reveal table. Click headings to sort.
| CODE | COMPANY | PRICE | WEEK RETURN % | MONTH RETURN % | 6 MONTH RETURN % | YEAR RETURN % | MARKET CAP |
|---|---|---|---|---|---|---|---|
| NAE | New Age Exploration | 0.004 | 0% | 0% | -33% | -33% | $ 8,072,545.10 |
| CKA | Cokal Ltd | 0.105 | -5% | 0% | -11% | -38% | $ 113,289,642.90 |
| BCB | Bowen Coal Limited | 0.051 | 13% | -19% | -65% | -79% | $ 153,576,296.89 |
| SVG | Savannah Goldfields | 0.028 | 8% | -7% | -56% | -81% | $ 7,027,122.90 |
| GRX | Greenx Metals Ltd | 0.905 | -5% | -14% | -7% | 33% | $ 251,334,088.84 |
| AKM | Aspire Mining Ltd | 0.195 | -5% | 3% | 127% | 242% | $ 106,603,766.85 |
| AVM | Advance Metals Ltd | 0.038 | 0% | 23% | -62% | -79% | $ 1,523,228.25 |
| YAL | Yancoal Aust Ltd | 5.24 | 0% | -15% | 0% | -10% | $ 6,853,080,678.03 |
| NHC | New Hope Corporation | 4.66 | 7% | -3% | -27% | -18% | $ 3,956,169,971.52 |
| TIG | Tigers Realm Coal | 0.006 | 9% | 20% | 0% | -50% | $ 78,400,214.21 |
| SMR | Stanmore Resources | 3.07 | -1% | -6% | -18% | -10% | $ 2,938,536,726.84 |
| WHC | Whitehaven Coal | 7.13 | 8% | 2% | -1% | 6% | $ 5,939,865,566.40 |
| BRL | Bathurst Res Ltd. | 0.865 | 1% | -2% | -15% | -12% | $ 162,655,813.00 |
| CRN | Coronado Global Res | 1.19 | 0% | -16% | -36% | -27% | $ 2,078,802,625.20 |
| JAL | Jameson Resources | 0.022 | 0% | -27% | -57% | -69% | $ 9,586,133.08 |
| TER | Terracom Ltd | 0.25 | 6% | 2% | -43% | -63% | $ 192,231,896.40 |
| ATU | Atrum Coal Ltd | 0.004526 | 0% | 0% | 0% | 0% | $ 11,966,853.96 |
| MCM | Mc Mining Ltd | 0.155 | 3% | 11% | 3% | -18% | $ 59,144,157.88 |
| DBI | Dalrymple Bay | 2.74 | 1% | -1% | -2% | 2% | $ 1,358,386,967.58 |
| AQC | Auspaccoal Ltd | 0.068 | -15% | 0% | -43% | -46% | $ 36,420,698.96 |
Related Stories


UNLOCK INSIGHTS
Discover the untold stories of emerging ASX stocks.
Daily news and expert analysis, it's free to subscribe.
By proceeding, you confirm you understand that we handle personal information in accordance with our Privacy Policy.


