
Mining
Monsters of Rock: BHP's $60 billion Anglo American gambit far from a done deal
Mining
Bulk Buys: Why the big Pilbara producers say returns are going to slide in iron ore

Mining
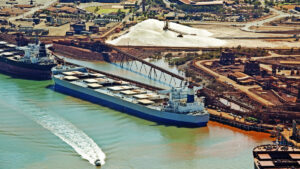
Pic: Monty Rakusen/Image Source via Getty Images
Mining
It’s the canary in the, well, you’ve probably read enough of these by now to know the idiom.
For iron ore prices that is steel production in China and downstream demand from things like car production, infrastructure and property development.
Last year steel output in China, home to almost 60% of the world’s crude steel capacity, rose to unthinkable levels through the first half to drive the iron ore price to a record US$237/t.
It then fell at an unthinkable rate in the second half to kill prices to US$87/t.
Those aren’t bad for 62% Fe iron ore, but combined with high freight rates and rising operating costs, it was enough to send a bit of alarm through the junior iron ore space.
This year prices have been volatile, but somewhat steadier. Iron ore output hasn’t reached the highs it did in early 2021, when Chinese steel mills could deal with bumper iron ore prices because of strong steel demand and low coking coal costs.
But save for a weak and Covid-infected July, it hasn’t cratered the way steel output did in the second half of 2021.
Chinese authorities have already stated they want steel output to be lower than 2021’s 1.033Bt, a 3% drop from the record 1.065Bt produced in 2020.
Analysts at Goldman Sachs say end of August crude steel output was down 10% on June highs and 14% above the lowest production rates seen this year amid the Beijing Winter Olympics in February.
They think if current rates hold, China’s government will get its way without needing to issue environmental restrictions, with steel output to again fall 3% in 2022.
It’s hard to say. Prices have already been negatively impacted by China’s policy to lock anyone who could have been exposed to a molecule of coronavirus in their home.
Benchmark iron ore spot and futures fell below US$100/t last week for the first time in five weeks, with Singapore futures trading down 1.27% to US$96.65/t.
Monday saw a bump from word the Chinese Government would cut the reserve ratio requirement (the amount of cash financial institutions needed to keep on hand) to stimulate its waning economy.
But until the lockdowns and Xi Jinping’s Covid Zero policy are done for good it remains hard to see a serious upside scenario for steel production and iron ore prices.
At the same time, those prices remain very attractive for majors like BHP (ASX:BHP), Rio Tinto and Fortescue Metals Group (ASX:FMG), which all produce their tonnes at an average unit cost of around US$20.
On the positive side for iron ore producers, steel mills are slowly seeing increased demand for their products, with the rebar price lifting for four straight days to Monday to 4111RMB/t, nowhere near the US$900/t plus being fetched early last year but a little healthier than recent months at US$592/t.
Iron ore shipments globally have been extremely weak for a while now, with most of the majors struggling to hit their targets.
The worst culprit is, surprisingly not Rio Tinto (ASX:RIO), which has received several knocks in this and other columns for its Costanza-like ability to fail upwards. Nope, the honour goes to Brazil’s Vale.
It looks like that ore carrier has been righted in recent weeks, with global iron ore shipments hitting a four-week high according to MySteel of 26Mt between August 29 and September 4.
Brazil’s shipments rose 1.2Mt or 14.7% on the week to a heady 9.1Mt, its highest level in 11 months.
Vale has struggled to keep pace with ambitious targets since January 2019, when it was forced to curtail production on the back of the Brumadinho tailings dam disaster.
| CODE | COMPANY | PRICE | 1 WEEK RETURN % | 1 MONTH RETURN % | 6 MONTH RETURN % | 1 YEAR RETURN % | MARKET CAP |
|---|---|---|---|---|---|---|---|
| ACS | Accent Resources NL | 0.042 | 0% | -9% | -25% | -21% | $ 19,573,145.89 |
| ADY | Admiralty Resources. | 0.011 | 10% | 22% | -45% | -27% | $ 14,339,370.68 |
| AKO | Akora Resources | 0.16 | -11% | -6% | -57% | -18% | $ 9,464,541.60 |
| BCK | Brockman Mining Ltd | 0.027 | -10% | -18% | -44% | -41% | $ 278,406,963.93 |
| BHP | BHP Group Limited | 37.27 | -12% | -4% | -16% | -1% | $ 192,045,257,277.96 |
| CIA | Champion Iron Ltd | 5.15 | 0% | 8% | -24% | -10% | $ 2,611,825,286.30 |
| CZR | CZR Resources Ltd | 0.017 | 21% | 6% | 143% | 113% | $ 62,753,818.99 |
| DRE | Dreadnought Resources Ltd | 0.13 | 24% | 73% | 225% | 217% | $ 380,129,193.88 |
| EFE | Eastern Resources | 0.029 | -3% | 4% | -41% | 123% | $ 29,195,190.30 |
| CUF | Cufe Ltd | 0.018 | -5% | -5% | -49% | -73% | $ 18,839,191.12 |
| FEX | Fenix Resources Ltd | 0.25 | -31% | -14% | 6% | -12% | $ 139,284,549.60 |
| FMG | Fortescue Metals Grp | 16.44 | -13% | -9% | -14% | -21% | $ 50,525,814,304.38 |
| FMS | Flinders Mines Ltd | 0.75 | 52% | 50% | 60% | -15% | $ 126,636,432.75 |
| GEN | Genmin | 0.25 | 0% | 2% | 32% | 16% | $ 70,821,962.50 |
| GRR | Grange Resources. | 0.755 | -23% | -34% | -32% | 49% | $ 862,217,330.01 |
| GWR | GWR Group Ltd | 0.089 | 6% | -3% | -43% | -56% | $ 27,303,415.68 |
| HAV | Havilah Resources | 0.355 | -15% | 34% | 97% | 78% | $ 117,156,507.70 |
| HAW | Hawthorn Resources | 0.09 | 3% | 8% | -2% | 70% | $ 30,016,405.17 |
| HIO | Hawsons Iron Ltd | 0.43 | 32% | 41% | 132% | 418% | $ 292,715,915.25 |
| IRD | Iron Road Ltd | 0.14 | -3% | 0% | -22% | -36% | $ 115,979,889.08 |
| JNO | Juno | 0.12 | 0% | -11% | 9% | -37% | $ 17,635,540.13 |
| LCY | Legacy Iron Ore | 0.02 | -5% | 3% | 0% | 33% | $ 128,136,523.98 |
| MAG | Magmatic Resrce Ltd | 0.19 | 6% | 171% | 58% | 65% | $ 48,352,491.62 |
| MDX | Mindax Limited | 0.059 | 0% | 0% | 0% | 34% | $ 115,533,663.12 |
| MGT | Magnetite Mines | 0.026 | 0% | 0% | -18% | -13% | $ 91,002,589.49 |
| MGU | Magnum Mining & Exp | 0.035 | -5% | -15% | -57% | -62% | $ 19,187,671.18 |
| MGX | Mount Gibson Iron | 0.43 | -4% | -15% | -19% | -24% | $ 522,200,313.19 |
| MIN | Mineral Resources. | 60.34 | -6% | 5% | 26% | 10% | $ 11,352,693,602.34 |
| MIO | Macarthur Minerals | 0.165 | -6% | 0% | -59% | -67% | $ 26,606,825.52 |
| PFE | Panteraminerals | 0.12 | 0% | -8% | -33% | -69% | $ 5,665,123.20 |
| PLG | Pearlgullironlimited | 0.031 | -3% | -26% | -58% | 0% | $ 1,701,971.55 |
| RHI | Red Hill Iron | 3.72 | -2% | 10% | 11% | 24% | $ 236,164,151.30 |
| RIO | Rio Tinto Limited | 90.8 | -6% | -7% | -28% | -18% | $ 34,066,511,958.78 |
| RLC | Reedy Lagoon Corp. | 0.016 | 7% | 0% | -36% | -20% | $ 8,918,830.59 |
| SHH | Shree Minerals Ltd | 0.0085 | 6% | 6% | -50% | -29% | $ 11,146,382.03 |
| SRK | Strike Resources | 0.093 | -7% | -26% | -28% | -45% | $ 25,110,000.00 |
| SRN | Surefire Rescs NL | 0.014 | 0% | -13% | 8% | -13% | $ 18,976,361.72 |
| TI1 | Tombador Iron | 0.027 | 4% | 0% | -39% | -52% | $ 26,935,808.11 |
| TLM | Talisman Mining | 0.155 | -6% | 0% | -9% | -6% | $ 30,038,319.52 |
| VMS | Venture Minerals | 0.026 | -7% | -7% | -33% | -67% | $ 45,291,354.98 |
| EQN | Equinoxresources | 0.17 | 10% | 13% | -15% | 0% | $ 6,750,000.15 |
More steam for thermal coal in recent days as gas prices jumped on news Russia’s Gazprom would keep its Nord Stream 1 pipeline into Germany closed indefinitely.
According to Bloomberg spot thermal coal prices hit an all time high on Friday, with physical product at the Port of Newcastle, in the coal Mecca of the Hunter Valley, fetching US$436.71/t on Friday.
Yikes. Coal at that price is still cheaper than natural gas, supporting outlandish prices for Australian producers who are profiting big time off countries forced either for ethical or practical reasons to switch away from Russian energy.
Many are hitting all time highs. Though some analysts think even these prices undersell just how profitable coal miners will be in the medium term.
$WHC.AX is an ASX50 co trading at 1-2x earnings with almost zero discretionary institutional ownership. Absent coal fundamentals and valuation margin of safety, almost any incremental institutional sponsorship – not a lot, a little – should be a strong technical tailwind.
— Jeremy Raper (@puppyeh1) September 5, 2022
$8.1 billion capped Whitehaven (ASX:WHC) hit a record $8.80 yesterday, with New Hope Corp’s (ASX:NHC) 2011 highs now in sight as well.
Majority Chinese owned Yancoal (ASX:YAL), Australia’s largest pure play coal miner, was up 6.34% to $6.71. That’s even taking into account that the stock price is weighed down by its lack of liquidity and a recent, unsuccessful, $5.08 bid from its Chinese parent Yankuang Energy to buy out minority holders.
But for a real sense of the sector’s gains in 2022 look further down the pecking order at juniors like Bowen Coal (ASX:BCB), Terracom (ASX:TER) and Stanmore (ASX:SMR), up 155%, 412% and 150% year to date to market caps of $692m, $819m and $2.2b respectively.
| CODE | COMPANY | PRICE | 1 WEEK RETURN % | 1 MONTH RETURN % | 6 MONTH RETURN % | 1 YEAR RETURN % | MARKET CAP |
|---|---|---|---|---|---|---|---|
| NAE | New Age Exploration | 0.006 | 0% | -14% | -54% | -45% | $ 8,615,393.46 |
| CKA | Cokal Ltd | 0.23 | 10% | 21% | 48% | 24% | $ 211,263,520.50 |
| NCZ | New Century Resource | 1.415 | -20% | -21% | -32% | -44% | $ 188,626,626.72 |
| BCB | Bowen Coal Limited | 0.435 | 16% | 53% | 55% | 149% | $ 634,300,139.92 |
| LNY | Laneway Res Ltd | 0.0055 | -8% | 10% | -4% | 43% | $ 35,959,090.26 |
| GRX | Greenx Metals Ltd | 0.205 | -16% | -24% | -7% | -26% | $ 51,992,195.12 |
| AKM | Aspire Mining Ltd | 0.095 | 6% | 8% | 12% | 19% | $ 47,717,876.59 |
| AVM | Advance Metals Ltd | 0.012 | 20% | 20% | -20% | -24% | $ 5,256,651.42 |
| AHQ | Allegiance Coal Ltd | 0.11 | 0% | -21% | -79% | -84% | $ 44,081,114.70 |
| YAL | Yancoal Aust Ltd | 6.71 | 11% | 42% | 38% | 183% | $ 8,331,972,847.47 |
| NHC | New Hope Corporation | 5.72 | 14% | 41% | 101% | 153% | $ 4,486,404,671.98 |
| TIG | Tigers Realm Coal | 0.02 | 5% | 18% | 82% | 33% | $ 222,133,940.26 |
| SMR | Stanmore Resources | 2.43 | 3% | 40% | 112% | 240% | $ 2,091,205,539.36 |
| WHC | Whitehaven Coal | 8.8 | 11% | 47% | 121% | 210% | $ 8,118,746,325.48 |
| BRL | Bathurst Res Ltd. | 0.95 | -7% | -6% | -4% | 36% | $ 177,964,595.40 |
| CRN | Coronado Global Res | 1.73 | 5% | 17% | 2% | 56% | $ 2,900,264,952.90 |
| JAL | Jameson Resources | 0.08 | 0% | -6% | 10% | 0% | $ 27,856,264.96 |
| TER | Terracom Ltd | 1.025 | -7% | 27% | 144% | 561% | $ 791,523,085.32 |
| ATU | Atrum Coal Ltd | 0.009 | 0% | 29% | -58% | -81% | $ 5,530,946.69 |
| MCM | Mc Mining Ltd | 0.3 | -3% | 22% | 200% | 186% | $ 60,284,735.35 |
Mining
Mining
Mining


Get the latest Stockhead news delivered free to your inbox.


