Bulk Buys: Why the big Pilbara producers say returns are going to slide in iron ore
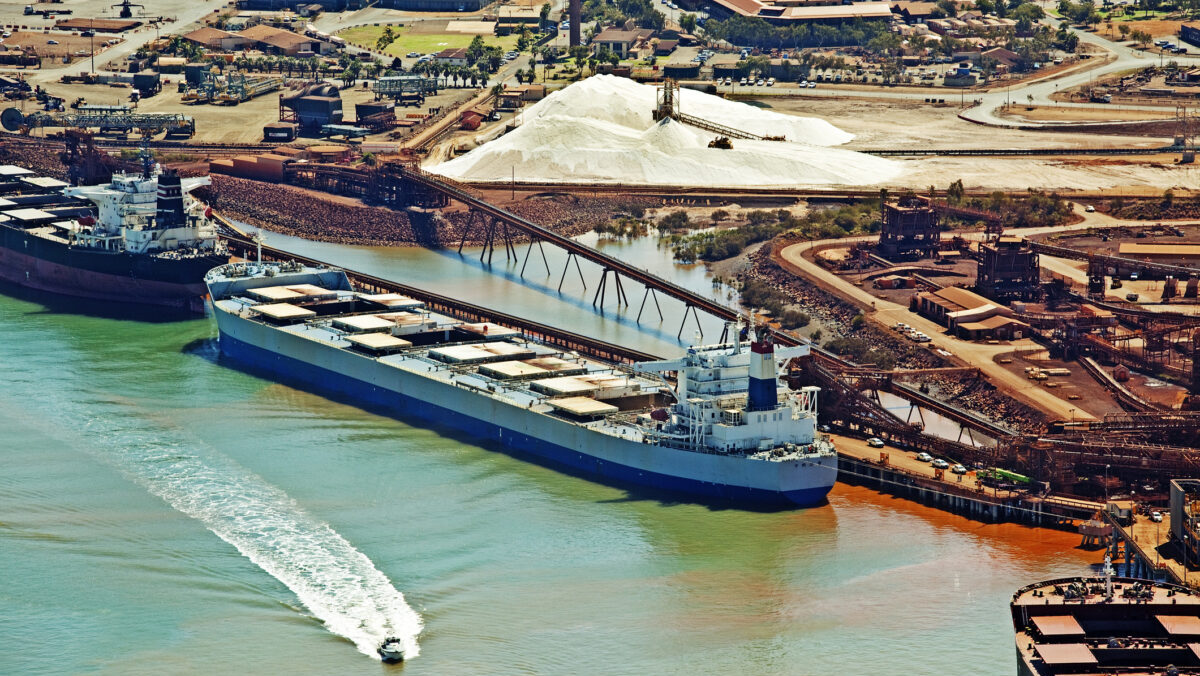
Pic: Getty Images
- Falling iron ore prices could translate to a $25 billion hit for WA’s North West by 2028
- Private Chinese steelmaker becomes first to lift rebar prices this year as profitability improves
- Newcastle coal exports up over 13% YoY in March quarter
Normally, miners are bullish about the long term outlooks of their commodities.
It’s both a confidence thing and a mental thing. Miners often remark that you have to be an optimist to succeed in the game, while having a positive but realistic outlook on the future can inspire confidence in your investors.
So the headline figure that $25 billion will be stripped from the economic benefits connected to miners who ship out of Port Hedland by 2028 coming out of the Pilbara Heavy Industries Council is a curious one.
The PHIC is funded by the companies which use the world’s largest metals export facility.
Those include BHP (ASX:BHP), Gina Rinehart’s Roy Hill, Fortescue (ASX:FMG), Mineral Resources (ASX:MIN) and Pilbara Minerals (ASX:PLS).
Also among its full members are Pilbara Ports, manganese producer ConsMin and copper producer Sandfire Resources (ASX:SFR), the latter of which no longer exports out of WA after the closure last year of its DeGrussa copper-gold mine.
Rio Tinto’s (ASX:RIO) Dampier Salt business, Newmont (ASX:NEM), Hancock’s Atlas Iron and manganese junior Element25 (ASX:E25) are also considered part of the Port Hedland supply chain.
Every few years they get consultants at ACIL Allen to roll up a report on their contribution through the Port, a lever to pull when going to governments for support and throwing their weight around in public campaigns.
ACIL Allen estimates the total value of production for the Port Hedland supply chain last financial year was around $87.1b, hitting a peak this year of $89.2b.
It then drops to $64.2b in 2027-28, which it’ll hold around for the rest of the decade long outlook period. Behind this is a belief, communicated by iron ore and lithium miners to ACIL Allen, that unit prices will moderate in the years ahead.
“The forward guidance provided by companies in the Port Hedland Port Supply Chain indicates that total iron ore production is forecast to steadily increase over the first half of the modelling period from approximately 544.8Mt in 2022-23 to approximately 589.4Mt in 2027-28, before stabilising at this level over the second half of the modelling period,” the report authors said.
“The forward guidance provided by companies in the Port Hedland Port Supply Chain indicates that projected annual operating expenditure is anticipated to increase from approximately $20.8 billion in 2022-23 to a peak of approximately $26.1 billion in 2024-25, before steadily declining to approximately $24.5 billion by the end of modelling period.”
Iron ore will contribute to around $80b of the total for this financial year, falling over time to around $60b.
Of course, most of those iron ore producers are running with C1 costs in the range of US$20/t, with MinRes (ASX:MIN) aiming to hit levels marginally above that with its new 35Mtpa Onslow hub, meaning even with prices falling into a range of US$60-70/t, those operations will be well above cost support.
China’s steel sector remains weak, but a touch of light could emerge
Central to concerns that current iron ore prices in the range of US$113/t are unsustainable have been poor rebar prices, real estate activity numbers and unseasonably low steel production numbers in China.
There may be a bit of light for iron ore and steel producers though, with MySteel reporting that private steelmaker Shagang Group in China’s eastern Jiangsu province would be the first to raise prices in 2024.
Its rebar, wire rod and bar-in-coil prices have risen by 50RMB each, or around US$7/t for sales in the last 10 days of April.
That would place those products at between 3970-4020RMB/t compared to benchmark rebar prices of U3738RMB/t (US$515/t).
Shagang, a major EAF steelmaker, also said it would lift scrap price offers by US$11.2/t, MySteel noted, with scrap inventories at a six-month low as of April 22.
Official National Bureau of Statistics figures last week showed China’s rebar production fell 9.5% YoY in the first quarter of 2024, with March figures down 22.5% to 17.79Mt.
MySteel said mill profitability fell from 30.3% at the end of March last year to just 28.57% by the end of March this year, though lower input costs for iron ore and coking coal and recovering rebar prices had seen that lift to 48.48% by April 18.
ASX iron ore stocks
Scroll or swipe to reveal table. Click headings to sort.
| CODE | COMPANY | PRICE | WEEK RETURN % | MONTH RETURN % | 6 MONTH RETURN % | YEAR RETURN % | MARKET CAP |
|---|---|---|---|---|---|---|---|
| ACS | Accent Resources NL | 0.007 | 0% | 0% | -13% | 0% | $ 3,311,890.98 |
| ADY | Admiralty Resources. | 0.007 | 17% | 17% | 17% | 17% | $ 11,406,317.58 |
| AKO | Akora Resources | 0.158336 | -9% | -6% | 3% | -3% | $ 15,039,198.84 |
| BCK | Brockman Mining Ltd | 0.023 | 0% | 0% | -12% | -23% | $ 213,445,339.01 |
| BHP | BHP Group Limited | 45.5 | 1% | 4% | 5% | 1% | $ 230,754,652,173.50 |
| CIA | Champion Iron Ltd | 6.67 | 1% | -7% | 7% | -3% | $ 3,455,535,077.42 |
| CZR | CZR Resources Ltd | 0.265 | -2% | -12% | 47% | 47% | $ 62,469,681.19 |
| DRE | Dreadnought Resources Ltd | 0.0165 | -8% | -8% | -61% | -75% | $ 57,965,703.84 |
| EFE | Eastern Resources | 0.008 | 0% | 0% | 0% | -38% | $ 9,935,571.69 |
| CUF | Cufe Ltd | 0.012 | 0% | 9% | -8% | -20% | $ 13,753,348.38 |
| FEX | Fenix Resources Ltd | 0.285 | 2% | 16% | 36% | 12% | $ 197,966,107.20 |
| FMG | Fortescue Ltd | 24.6 | -2% | 0% | 18% | 14% | $ 75,742,536,982.80 |
| RHK | Red Hawk Mining Ltd | 0.66 | -5% | -9% | 13% | 67% | $ 131,875,576.14 |
| GEN | Genmin | 0.092 | 0% | -43% | -43% | -35% | $ 63,041,108.11 |
| GRR | Grange Resources. | 0.43 | 1% | 4% | 2% | -32% | $ 497,655,640.14 |
| GWR | GWR Group Ltd | 0.115 | 15% | 16% | 55% | 42% | $ 36,939,915.33 |
| HAV | Havilah Resources | 0.19 | -3% | 15% | -21% | -30% | $ 60,161,449.90 |
| HAW | Hawthorn Resources | 0.069 | -3% | -12% | -24% | -19% | $ 23,116,077.30 |
| HIO | Hawsons Iron Ltd | 0.038 | -3% | 15% | -22% | -28% | $ 34,924,700.24 |
| IRD | Iron Road Ltd | 0.08 | -2% | 33% | 3% | -24% | $ 65,928,255.52 |
| JNO | Juno | 0.062 | 7% | 2% | -21% | -32% | $ 11,280,606.12 |
| LCY | Legacy Iron Ore | 0.016 | 0% | 7% | -6% | -11% | $ 123,416,772.19 |
| MAG | Magmatic Resrce Ltd | 0.11 | 0% | 20% | 75% | 0% | $ 41,980,284.39 |
| MDX | Mindax Limited | 0.036 | 0% | -8% | -23% | -85% | $ 73,640,116.08 |
| MGT | Magnetite Mines | 0.275 | 2% | 8% | -31% | -47% | $ 27,069,494.38 |
| MGU | Magnum Mining & Exp | 0.014 | -13% | -13% | -39% | -26% | $ 11,331,059.64 |
| MGX | Mount Gibson Iron | 0.45 | 1% | 6% | -3% | -12% | $ 546,697,679.85 |
| MIN | Mineral Resources. | 68.54 | -1% | -1% | 21% | -13% | $ 13,430,320,813.70 |
| MIO | Macarthur Minerals | 0.0775 | -9% | -18% | -51% | -48% | $ 13,334,734.32 |
| PFE | Panteraminerals | 0.036 | -5% | -16% | -47% | -55% | $ 9,653,996.88 |
| PLG | Pearlgullironlimited | 0.025 | -7% | -14% | -4% | -17% | $ 5,113,544.75 |
| RHI | Red Hill Minerals | 6.5 | 7% | 19% | 45% | 48% | $ 415,371,905.00 |
| RIO | Rio Tinto Limited | 129.57 | 1% | 7% | 16% | 11% | $ 48,098,484,847.98 |
| RLC | Reedy Lagoon Corp. | 0.004 | 0% | 0% | -20% | -31% | $ 2,478,162.93 |
| CTN | Catalina Resources | 0.003 | -25% | -25% | -25% | -33% | $ 3,715,460.68 |
| SRK | Strike Resources | 0.043 | -2% | -4% | -16% | -30% | $ 12,201,250.00 |
| SRN | Surefire Rescs NL | 0.0105 | 5% | 5% | -25% | -56% | $ 20,856,232.04 |
| TI1 | Tombador Iron | 0.014 | 0% | 0% | 0% | -42% | $ 30,218,753.22 |
| TLM | Talisman Mining | 0.235 | 0% | 34% | 68% | 62% | $ 44,255,282.02 |
| VMS | Venture Minerals | 0.021 | -22% | 11% | 133% | -9% | $ 47,600,273.74 |
| EQN | Equinoxresources | 0.215 | -4% | 10% | 30% | 48% | $ 21,752,625.65 |
| AMD | Arrow Minerals | 0.005 | 25% | 0% | 150% | 0% | $ 47,398,531.85 |
| CTM | Centaurus Metals Ltd | 0.4 | 5% | 27% | -22% | -53% | $ 197,998,934.80 |
Coal recovery continues in Newcastle
Newcastle’s recovery in coal exports is continuing, with good 36.114Mt of the fossil fuel leaving the New South Wales port in the March quarter.
12.165Mt was shipped from the Hunter Valley in the month of March, 5.8% up on the same month in 2023 and almost 11% up on a down month in February.
YTD exports are more than 13% higher.
Coal shipments are tracking in line with last year’s 144.5Mt on an annualised basis, with output from the region’s coal deposits lifting later in the year in 2023 and peaking at 14.73Mt in December.
That was up from multi-year lows of 136Mt in 2022 but well shy of the 156.6Mt shipped in 2021.
Newcastle coal exports peaked at 165.25Mt in 2019.
The revival has helped keep coal markets well supplied along with fewer disruptions overseas, though rising oil and LNG prices have improved sentiment for switch demand.
Front month futures for May are currently running at US$138/t, with spot around US$130/t.
Singapore coking coal futures fell strongly on Monday from US$275/t to US$253/t.
ASX coal stocks
Scroll or swipe to reveal table. Click headings to sort.
| CODE | COMPANY | PRICE | WEEK RETURN % | MONTH RETURN % | 6 MONTH RETURN % | YEAR RETURN % | MARKET CAP |
|---|---|---|---|---|---|---|---|
| NAE | New Age Exploration | 0.004 | 0% | -11% | -33% | -20% | $ 7,175,595.64 |
| CKA | Cokal Ltd | 0.105 | -9% | 7% | 0% | -34% | $ 113,289,642.90 |
| BCB | Bowen Coal Limited | 0.046 | 0% | 0% | -55% | -81% | $ 130,824,252.91 |
| SVG | Savannah Goldfields | 0.03 | 15% | 11% | -51% | -81% | $ 8,432,547.48 |
| GRX | Greenx Metals Ltd | 0.905 | 0% | -5% | -6% | 19% | $ 247,236,250.44 |
| AKM | Aspire Mining Ltd | 0.19 | 0% | -3% | 150% | 222% | $ 96,451,027.15 |
| AVM | Advance Metals Ltd | 0.025 | -7% | -34% | -58% | -88% | $ 1,139,942.43 |
| YAL | Yancoal Aust Ltd | 5.57 | -5% | 6% | 12% | -2% | $ 7,354,847,664.09 |
| NHC | New Hope Corporation | 4.52 | -2% | 3% | -24% | -15% | $ 3,820,916,297.28 |
| TIG | Tigers Realm Coal | 0.004 | -20% | -27% | -33% | -60% | $ 52,266,809.47 |
| SMR | Stanmore Resources | 3.24 | 4% | 4% | -11% | -1% | $ 2,920,508,894.16 |
| WHC | Whitehaven Coal | 7.65 | 0% | 18% | 2% | 4% | $ 6,399,995,997.60 |
| BRL | Bathurst Res Ltd. | 0.85 | -2% | -3% | -15% | -17% | $ 162,655,813.00 |
| CRN | Coronado Global Res | 1.17 | 0% | -3% | -27% | -30% | $ 1,961,450,864.10 |
| JAL | Jameson Resources | 0.03 | 11% | 36% | -41% | -62% | $ 13,071,999.66 |
| TER | Terracom Ltd | 0.24 | 0% | -2% | -45% | -60% | $ 192,231,896.40 |
| ATU | Atrum Coal Ltd | 0.004526 | 0% | 0% | 0% | 0% | $ 11,966,853.96 |
| MCM | Mc Mining Ltd | 0.16 | 3% | 10% | 14% | -24% | $ 65,262,519.04 |
| DBI | Dalrymple Bay | 2.75 | 0% | 1% | 0% | 2% | $ 1,363,344,584.25 |
| AQC | Auspaccoal Ltd | 0.082 | 5% | -6% | -29% | -42% | $ 42,063,342.46 |
Related Stories


UNLOCK INSIGHTS
Discover the untold stories of emerging ASX stocks.
Daily news and expert analysis, it's free to subscribe.
By proceeding, you confirm you understand that we handle personal information in accordance with our Privacy Policy.


