
Pic: Luftklick, iStock / Getty Images Plus
Gold Digger: Bonanza! Here are some of the biggest ASX gold hits of 2022
Mining
Pic: Luftklick, iStock / Getty Images Plus
Mining
Our Gold Digger column wraps all the news driving ASX stocks with exposure to precious metals.
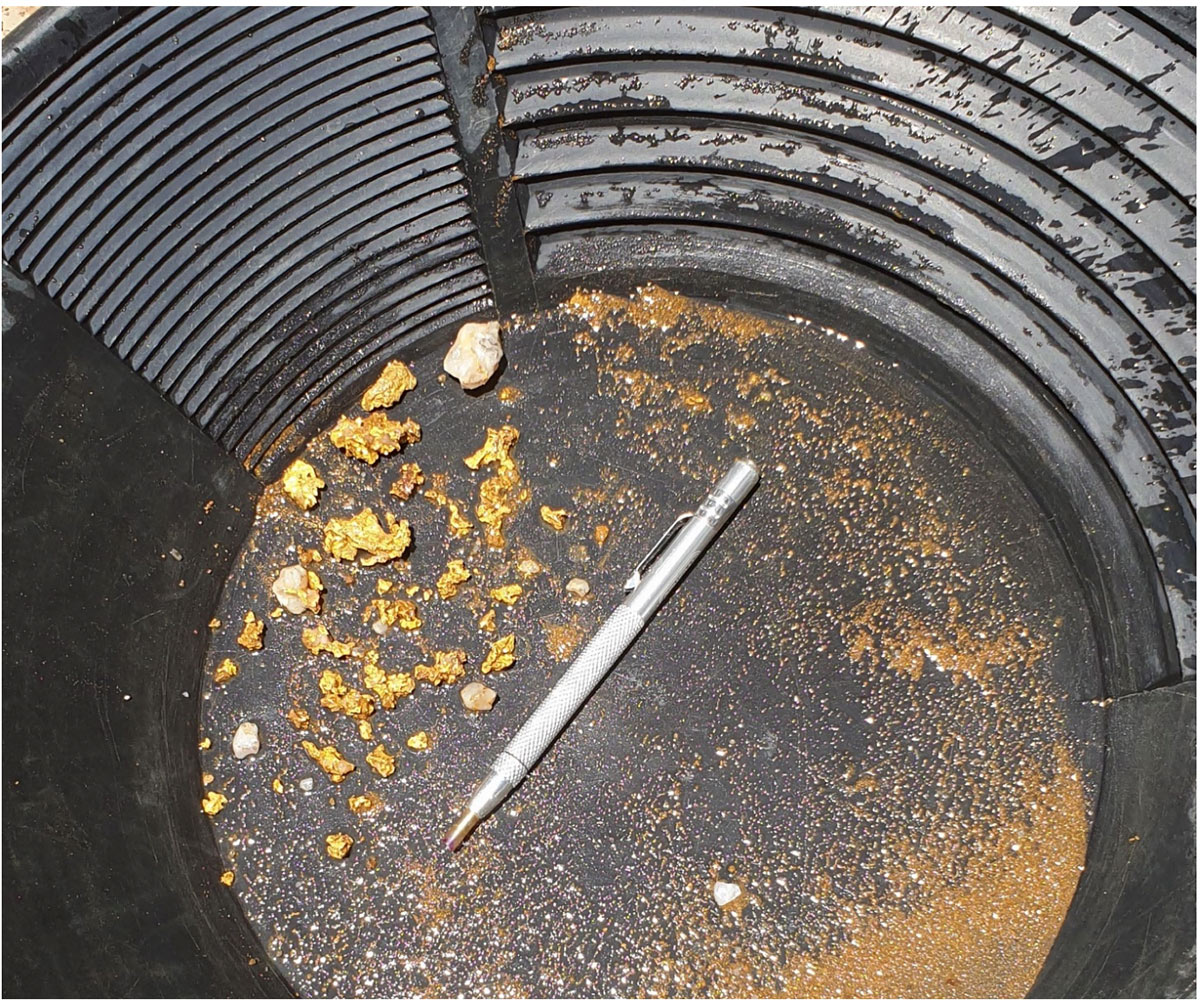
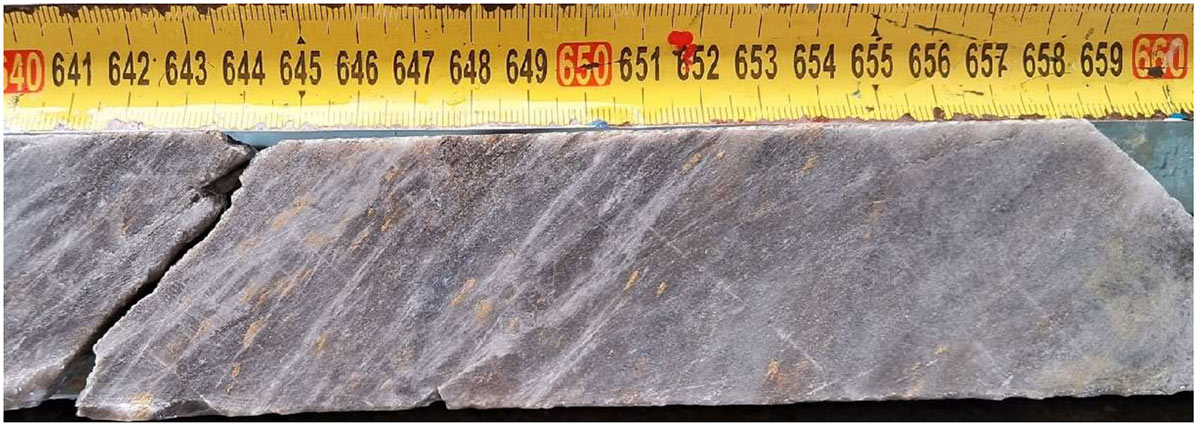
The best gold hits on the ASX for 2022 can be measured on their technical merit – things like grade, width, and depth. Sometimes, the gold just looks cool.
Mining data visualiser MinerDeck has done the hard work by curating its top 20 ASX gold hits of 2022, converted into grams per metre:
🇦🇺 Yearly gold drilling highlights — 2022 pic.twitter.com/jx9CEiOCQ4
— MinerDeck (@MinerDeck) December 27, 2022
Quick explainer: anything above 5g/t is generally considered high grade. The closer the intercept is to surface and the thicker it is, the better.
Here’s a closer look at MinerDeck’s top 5 ASX junior gold hits for 2022.
3m at 2,999g/t from 41m
RED announced this monstrous intersection on December 20 from the St George open pit satellite deposit, part of the Darlot operation in WA.
It equals 105 ounces of gold per tonne of dirt.
The St George area was the richest of the historical mines in the Darlot area, yielding 8,000 ounces from a little over 1,000t of ore from 1897-1919 and 1935-1936, the company says.
RED expects to produce between 90,000oz and 105,000oz from its Darlot and newly commissioned 4.75Moz King of the Hills mining operations in H1 2023.
It says the potential development of a satellite open pit at St George will be evaluated at a later date.
25m at 131g/t from 37m
Barry Fitz reckons these guys are a takeover target.
This fresh gold producer started the year with a bang, announcing this hit – which includes a 1.1m chunk grading 2,853g/t – on January 24 from the Abujar project in Côte d’Ivoire, West Africa.
Here’s what that looks like:
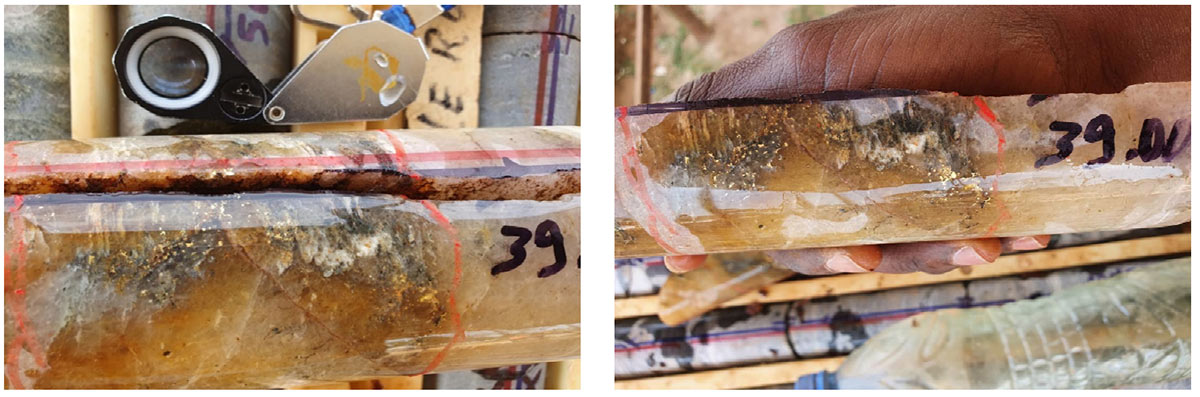
“This fantastic intercept of 1.1m at 2,853g/t gold from our infill drilling program at AG [deposit] is our best achievement to date,” TIE managing director Dr Caigen Wang said at the time.
“This bonanza gold intercept is located close to surface in fresh mineralisation and combined with the multiple high‐grade intercepts we have reported from our infill drilling, it is expected these will have a material impact on the first years of open pit mining at Abujar.”
With construction now pretty much complete, first gold pour at the 3.45Moz Abujar project is pencilled in for this month.
The company is forecasting 260,000oz gold production in 2023.
25m at 90g/t from 353m
Fellow West African gold miner WAF announced this intercept December 15 from resource definition drilling at M1 South, part of the low cost ~230,000ozpa Sanbrado operations in Burkina Faso.
It was one of several high-grade hits from M1 South, where an updated resource is due Q1 2023.
“We look forward to releasing WAF’s updated Mineral Resources, Ore Reserves and 10-year production outlook in Q1 2023,” executive chairman Richard Hyde says.
“WAF is in an exciting growth phase, as we aim to a be a multi-project +400,000ozpa gold producer in 2025.”
161m at 8.1g/t from surface
This exceptional hit announced in August demonstrates why the RPM project is now the jewel in NVA’s golden crown.
RPM — part of the company’s flagship 9.6Moz Estelle gold trend in the prolific Tintina Belt, Alaska – made headlines last year with an 132m at 10.1g/t intercept.
Outrageous numbers. That must be up there as one of the best drilling results of the year, if not the decade.
The hits kept coming in 2022. This exceptional 161m, 8.1g/t intercept announced in August demonstrates why the RPM project is now the jewel in NVA’s golden crown.
Current drilling at RPM is expected to increase both the confidence level of the resource and extend mineralisation, NVA CEO Christopher Gerteisen says.
“…an updated Mineral Resource Estimate (MRE) is now being completed, with the inclusion of the high-grade RPM ore in the production schedule expected to have a significant positive impact on key economic metrics in the Phase 2 Scoping Study, now well underway,” he says.
“With long-term opportunity and the prospect of multiple mining centres across the single project, we continue on our path to becoming a world class, global gold producer.”
9.1m at 124g/t from 27m
In July, PXX hit gold and silver paydirt in maiden drilling at Star Canyon, less than 3km from the 5Moz operating Florida Canyon gold mine in Nevada.
The bonanza result sits within numerous wide lower-grade intersections, and “highlight potential for Star Canyon to host high-grade gold and silver veins within a potentially bulk mineable Carlin-style system”.
Further drilling at the Star Canyon, part of the larger Humboldt Range project, kicked off late November 2022.
PXX is currently enjoying a late year resurgence, thanks to an investment from major gold miner Northern Star Resources (ASX:NST).
NST is now a 10% shareholder after shelling out ~$1m as part of a recent placement. That’s the equivalent of finding a few bucks underneath the couch cushions for NST, but a big deal for PXX which is now cashed up for drilling in 2023.
Here’s how ASX-listed precious metals stocks are performing:
Scroll or swipe to reveal table. Click headings to sort. Best viewed on a laptop.
Stocks missing from this list? Email [email protected]
| CODE | COMPANY | 1 WEEK RETURN % | 1 MONTH RETURN % | 6 MONTH RETURN % | 1 YEAR RETURN % | PRICE | MARKET CAP |
|---|---|---|---|---|---|---|---|
| AL8 | Alderan Resource | 33% | 14% | -33% | -77% | 0.008 | $4,047,863 |
| CTO | Citigold Corp | 20% | 0% | 0% | -25% | 0.006 | $17,001,955 |
| ASR | Asra Minerals | 19% | 19% | -24% | -14% | 0.019 | $26,356,708 |
| KWR | Kingwest Resources | 19% | 12% | -32% | -79% | 0.038 | $10,705,619 |
| BBX | BBX Minerals | 18% | 25% | 0% | -33% | 0.1 | $48,672,148 |
| SVY | Stavely Minerals | 18% | 27% | 18% | -56% | 0.235 | $77,509,117 |
| FML | Focus Minerals | 17% | -5% | 50% | -33% | 0.21 | $57,311,729 |
| KCC | Kincora Copper | 16% | 12% | 46% | -42% | 0.073 | $7,278,983 |
| IPT | Impact Minerals | 14% | -11% | 14% | -37% | 0.008 | $19,850,964 |
| BAT | Battery Minerals | 14% | 0% | -20% | -67% | 0.004 | $11,700,969 |
| SBR | Sabre Resources | 14% | 0% | 0% | 0% | 0.04 | $11,076,475 |
| ICG | Inca Minerals | 14% | -25% | -70% | -77% | 0.024 | $11,093,459 |
| CLA | Celsius Resource | 13% | 0% | 42% | -11% | 0.017 | $24,093,265 |
| CDR | Codrus Minerals | 13% | 35% | 108% | 8% | 0.135 | $5,660,200 |
| OAU | Ora Gold Limited | 13% | 50% | 0% | -40% | 0.009 | $8,858,082 |
| MTC | Metalstech | 12% | 31% | 72% | 88% | 0.525 | $89,029,285 |
| AVM | Advance Metals | 11% | -23% | 11% | -38% | 0.01 | $5,800,441 |
| VKA | Viking Mines | 11% | 11% | 67% | -33% | 0.01 | $10,252,584 |
| TMZ | Thomson Res | 11% | -13% | 5% | -71% | 0.02 | $15,737,403 |
| OBM | Ora Banda Mining | 11% | -1% | 207% | 39% | 0.083 | $119,766,548 |
| SXG | Southern Cross Gold | 10% | 15% | 91% | 0% | 0.81 | $67,369,474 |
| QML | Qmines Limited | 10% | -6% | -3% | -47% | 0.165 | $14,884,490 |
| LCL | Los Cerros Limited | 10% | 47% | 84% | -49% | 0.056 | $40,795,683 |
| DRE | Dreadnought Resources | 9% | 5% | 114% | 169% | 0.105 | $298,715,854 |
| ENR | Encounter Resources | 9% | -3% | 46% | 8% | 0.175 | $56,884,125 |
| PRX | Prodigy Gold NL | 9% | 9% | -4% | -63% | 0.012 | $20,974,594 |
| BYH | Bryah Resources | 8% | 0% | -16% | -42% | 0.026 | $7,312,590 |
| THR | Thor Mining PLC | 8% | -19% | -28% | -46% | 0.0065 | $9,374,383 |
| PNR | Pantoro Limited | 8% | -18% | -48% | -71% | 0.098 | $165,430,313 |
| SLZ | Sultan Resources | 8% | 6% | -13% | -47% | 0.085 | $7,079,173 |
| SMS | Starmineralslimited | 7% | 3% | -5% | -66% | 0.072 | $2,129,760 |
| RGL | Riversgold | 7% | -15% | 4% | 100% | 0.029 | $26,473,096 |
| VRC | Volt Resources | 7% | 0% | -12% | -44% | 0.015 | $58,191,358 |
| GMR | Golden Rim Resources | 7% | -9% | -50% | -77% | 0.031 | $11,771,752 |
| CWX | Carawine Resources | 6% | 10% | 18% | -44% | 0.1 | $19,681,747 |
| AWV | Anova Metals | 6% | 0% | 113% | -15% | 0.017 | $32,630,693 |
| BTR | Brightstar Resources | 6% | 10% | -6% | -61% | 0.017 | $12,454,690 |
| BEZ | Besragoldinc | 6% | 0% | 12% | -50% | 0.052 | $13,109,914 |
| SNG | Siren Gold | 6% | -10% | -30% | -30% | 0.185 | $21,631,213 |
| NML | Navarre Minerals | 5% | -6% | -5% | -47% | 0.041 | $58,953,045 |
| CBY | Canterbury Resources | 5% | 5% | 3% | -51% | 0.041 | $5,494,965 |
| ZAG | Zuleika Gold | 5% | -13% | -16% | 17% | 0.021 | $10,984,063 |
| GTR | Gti Energy | 5% | -4% | -12% | -52% | 0.0115 | $16,560,319 |
| BC8 | Black Cat Syndicate | 4% | 8% | 15% | -40% | 0.355 | $73,079,320 |
| SKY | SKY Metals | 4% | -13% | -19% | -52% | 0.048 | $18,085,607 |
| VMC | Venus Metals Cor | 4% | -10% | -16% | -18% | 0.135 | $24,040,622 |
| GSR | Greenstone Resources | 4% | 8% | -36% | -4% | 0.027 | $29,013,632 |
| RSG | Resolute Mining | 4% | 19% | -1% | -37% | 0.2075 | $447,091,379 |
| WCN | White Cliff Min | 4% | -9% | 12% | -3% | 0.0145 | $10,922,635 |
| M24 | Mamba Exploration | 4% | 0% | 53% | -28% | 0.145 | $5,904,500 |
| HRN | Horizon Gold | 3% | -2% | -5% | -21% | 0.31 | $38,806,309 |
| CST | Castile Resources | 3% | -24% | -37% | -51% | 0.095 | $23,222,633 |
| MRZ | Mont Royal Resources | 3% | -8% | -41% | -49% | 0.175 | $11,642,054 |
| MKG | Mako Gold | 3% | -5% | -35% | -64% | 0.04 | $17,922,752 |
| SVL | Silver Mines Limited | 3% | 0% | 48% | -11% | 0.2 | $258,366,429 |
| MGV | Musgrave Minerals | 3% | 0% | -18% | -43% | 0.205 | $121,197,630 |
| IVR | Investigator Res | 2% | -18% | 14% | -41% | 0.042 | $58,923,710 |
| MAU | Magnetic Resources | 2% | 6% | -31% | -42% | 0.85 | $195,085,524 |
| ADN | Andromeda Metals | 2% | -9% | -39% | -76% | 0.043 | $130,620,354 |
| RDT | Red Dirt Metals | 2% | -18% | 16% | -28% | 0.465 | $181,014,733 |
| LEX | Lefroy Exploration | 2% | -4% | 4% | -17% | 0.25 | $39,760,334 |
| SBM | St Barbara Limited | 2% | 20% | 0% | -46% | 0.775 | $632,819,775 |
| HCH | Hot Chili | 2% | -4% | 6% | -52% | 0.84 | $96,153,391 |
| TCG | Turaco Gold Limited | 2% | 0% | 2% | -52% | 0.058 | $24,807,567 |
| HAV | Havilah Resources | 2% | -2% | 29% | 97% | 0.315 | $98,158,155 |
| X64 | Ten Sixty Four | 2% | 14% | -10% | -9% | 0.635 | $143,887,780 |
| HMX | Hammer Metals | 2% | 3% | 46% | 26% | 0.067 | $55,034,292 |
| WRM | White Rock Min | 2% | -24% | -36% | -70% | 0.067 | $16,525,766 |
| TUL | Tulla Resources | 2% | -13% | -34% | -40% | 0.335 | $68,111,504 |
| AAR | Astral Resources NL | 1% | 6% | -6% | -33% | 0.069 | $45,913,289 |
| AGG | AngloGold Ashanti | 1% | 12% | 31% | 7% | 5.88 | $524,541,658 |
| BGL | Bellevue Gold | 0% | 14% | 78% | 33% | 1.155 | $1,275,894,095 |
| SSR | SSR Mining Inc. | 0% | 8% | -5% | -3% | 23.23 | $433,523,507 |
| MRR | Minrex Resources | 0% | -15% | -6% | -18% | 0.033 | $37,970,363 |
| NPM | Newpeak Metals | 0% | 0% | 0% | 0% | 0.001 | $9,145,132 |
| FFX | Firefinch | 0% | 0% | 0% | -30% | 0.2 | $236,248,644 |
| GED | Golden Deeps | 0% | 11% | -23% | -17% | 0.01 | $11,552,267 |
| DCX | Discovex Res | 0% | 0% | -25% | -65% | 0.003 | $9,907,704 |
| AQX | Alice Queen | 0% | 0% | -33% | -82% | 0.002 | $4,400,500 |
| PNX | PNX Metals Limited | 0% | 0% | -20% | -31% | 0.004 | $17,776,231 |
| GIB | Gibb River Diamonds | 0% | 9% | 46% | -25% | 0.06 | $12,690,567 |
| FAU | First Au | 0% | -20% | -60% | -56% | 0.004 | $3,807,973 |
| MOH | Moho Resources | 0% | -8% | -8% | -65% | 0.022 | $4,568,568 |
| CAZ | Cazaly Resources | 0% | 7% | -16% | -30% | 0.031 | $11,526,476 |
| MEI | Meteoric Resources | 0% | 247% | 373% | 225% | 0.052 | $74,788,571 |
| SRN | Surefire Rescs NL | 0% | 9% | -50% | 20% | 0.012 | $17,394,998 |
| AME | Alto Metals Limited | 0% | -3% | -13% | -31% | 0.066 | $40,445,822 |
| M2R | Miramar | 0% | -19% | -6% | -56% | 0.08 | $5,654,539 |
| TRY | Troy Resources | 0% | 0% | 0% | 0% | 0.0295 | $62,920,961 |
| CGN | Crater Gold Min | 0% | 0% | 0% | 0% | 0.017 | $21,063,474 |
| EMC | Everest Metals Corp | 0% | 13% | -9% | -49% | 0.08 | $8,514,649 |
| CY5 | Cygnus Gold Limited | 0% | -25% | 145% | 105% | 0.38 | $70,791,572 |
| G50 | Gold50Limited | 0% | 25% | 61% | 0% | 0.25 | $13,666,320 |
| ADV | Ardiden | 0% | -20% | 14% | -27% | 0.008 | $18,818,347 |
| MTH | Mithril Resources | 0% | -33% | -40% | -81% | 0.003 | $9,789,271 |
| RMX | Red Mount Min | 0% | 0% | -25% | -55% | 0.0045 | $8,947,570 |
| PRS | Prospech Limited | 0% | -17% | -12% | -55% | 0.029 | $2,560,659 |
| XTC | Xantippe Res | 0% | -29% | -29% | -17% | 0.005 | $51,460,174 |
| BCN | Beacon Minerals | 0% | 4% | 0% | -16% | 0.027 | $97,675,972 |
| WWI | West Wits Mining | 0% | -12% | -25% | -53% | 0.015 | $30,675,565 |
| RML | Resolution Minerals | 0% | 0% | 14% | -56% | 0.008 | $8,557,970 |
| MEG | Megado Minerals | 0% | -8% | -44% | -47% | 0.045 | $6,187,500 |
| HMG | Hamelingoldlimited | 0% | -22% | 38% | 4% | 0.145 | $15,950,000 |
| HMG | Hamelingoldlimited | 0% | -22% | 38% | 4% | 0.145 | $15,950,000 |
| TBA | Tombola Gold | 0% | 0% | -26% | -7% | 0.026 | $33,129,243 |
| BM8 | Battery Age Minerals | 0% | 0% | 0% | 74% | 0.5 | $28,984,082 |
| RDN | Raiden Resources | 0% | -29% | -29% | -74% | 0.005 | $9,927,495 |
| DTM | Dart Mining NL | 0% | -19% | 10% | -32% | 0.056 | $8,694,569 |
| MKR | Manuka Resources. | 0% | -43% | -52% | -72% | 0.086 | $43,180,732 |
| EMU | EMU NL | 0% | 0% | -30% | -65% | 0.007 | $4,810,877 |
| SFM | Santa Fe Minerals | 0% | -2% | -17% | -38% | 0.08 | $5,825,503 |
| SI6 | SI6 Metals Limited | 0% | 20% | -14% | -40% | 0.006 | $8,972,368 |
| BGD | Bartongoldholdings | 0% | 30% | 16% | 5% | 0.215 | $18,542,095 |
| AGC | AGC | 0% | -12% | -14% | -38% | 0.06 | $4,063,637 |
| RVR | Red River Resources | 0% | 0% | -51% | -63% | 0.073 | $37,847,908 |
| CPM | Coopermetalslimited | 0% | -21% | -39% | 28% | 0.23 | $9,434,600 |
| WMC | Wiluna Mining Corp | 0% | 0% | -15% | -77% | 0.205 | $74,238,031 |
| POL | Polymetals Resources | 0% | 23% | 175% | 58% | 0.245 | $11,069,760 |
| RDS | Redstone Resources | 0% | -11% | 14% | -47% | 0.008 | $5,894,659 |
| KAI | Kairos Minerals | 0% | -21% | 10% | -19% | 0.022 | $41,245,963 |
| HRZ | Horizon | 0% | -8% | -15% | -53% | 0.061 | $37,993,619 |
| LCY | Legacy Iron Ore | 0% | 0% | 0% | -25% | 0.018 | $115,322,872 |
| MAT | Matsa Resources | 0% | -8% | -5% | -36% | 0.037 | $15,244,171 |
| STK | Strickland Metals | 0% | -5% | -29% | -44% | 0.04 | $57,476,080 |
| SAU | Southern Gold | 0% | -8% | -20% | -59% | 0.024 | $6,399,861 |
| CEL | Challenger Exp | 0% | 9% | 0% | -39% | 0.18 | $182,859,469 |
| OZM | Ozaurum Resources | 0% | -1% | -59% | -46% | 0.07 | $4,880,120 |
| XAM | Xanadu Mines | 0% | 11% | 25% | 0% | 0.03 | $42,367,806 |
| CHZ | Chesser Resources | 0% | 13% | -1% | -32% | 0.085 | $49,990,464 |
| TAR | Taruga Minerals | 0% | -40% | 26% | -35% | 0.024 | $17,449,777 |
| S2R | S2 Resources | 0% | 6% | 21% | -11% | 0.17 | $58,884,351 |
| NES | Nelson Resources. | 0% | 0% | -18% | -73% | 0.007 | $4,120,160 |
| PUR | Pursuit Minerals | 0% | 45% | 33% | -41% | 0.016 | $15,995,698 |
| GNM | Great Northern | 0% | 0% | 0% | -38% | 0.004 | $6,836,204 |
| TRM | Truscott Mining Corp | 0% | 8% | -20% | 24% | 0.041 | $6,853,439 |
| DEX | Duke Exploration | 0% | 0% | -10% | -70% | 0.053 | $5,587,240 |
| KNB | Koonenberrygold | 0% | -23% | -23% | -62% | 0.062 | $4,696,900 |
| AZS | Azure Minerals | 0% | -12% | 13% | -39% | 0.225 | $68,690,134 |
| AYM | Australia United Min | 0% | -25% | -50% | -63% | 0.003 | $5,527,732 |
| BRB | Breaker Res NL | 0% | 3% | 78% | 12% | 0.32 | $104,366,240 |
| GCY | Gascoyne Res | 0% | 0% | -17% | -32% | 0.195 | $83,082,880 |
| GCY | Gascoyne Res | 0% | 0% | -17% | -32% | 0.195 | $83,082,880 |
| MEK | Meeka Metals Limited | 0% | -1% | 39% | 62% | 0.068 | $72,597,407 |
| TGM | Theta Gold Mines | 0% | -8% | 21% | -56% | 0.068 | $42,092,617 |
| TBR | Tribune Res | 0% | 5% | 3% | -14% | 4.01 | $210,396,989 |
| CHN | Chalice Mining | 0% | 20% | 64% | -33% | 6.29 | $2,349,030,491 |
| EVN | Evolution Mining | 0% | 13% | 25% | -26% | 3.01 | $5,541,749,283 |
| WAF | West African Res | -1% | 3% | -3% | -11% | 1.1775 | $1,212,067,762 |
| CAI | Calidus Resources | -1% | -24% | -55% | -56% | 0.2675 | $118,241,560 |
| NST | Northern Star | -1% | 4% | 57% | 17% | 11.01 | $12,833,419,650 |
| GOR | Gold Road Res | -1% | -2% | 46% | 7% | 1.7 | $1,834,464,568 |
| PNM | Pacific Nickel Mines | -1% | 22% | 4% | 5% | 0.083 | $30,429,672 |
| PGO | Pacgold | -1% | -10% | -37% | -33% | 0.36 | $19,786,253 |
| TIE | Tietto Minerals | -1% | -14% | 116% | 41% | 0.69 | $744,873,968 |
| KIN | KIN Min NL | -2% | -13% | -10% | -38% | 0.065 | $68,153,899 |
| GUL | Gullewa Limited | -2% | -2% | 2% | -23% | 0.06 | $11,722,386 |
| ANX | Anax Metals | -2% | -12% | -30% | -33% | 0.053 | $21,697,926 |
| SPQ | Superior Resources | -2% | -13% | 47% | 104% | 0.053 | $88,463,462 |
| EMR | Emerald Res NL | -2% | 4% | 5% | 10% | 1.175 | $700,685,160 |
| CYL | Catalyst Metals | -2% | -14% | -9% | -41% | 1.15 | $113,224,570 |
| AUC | Ausgold Limited | -2% | 5% | -2% | -4% | 0.046 | $93,355,829 |
| MEU | Marmota Limited | -2% | -2% | -18% | 7% | 0.045 | $48,704,826 |
| LM8 | Lunnonmetalslimited | -2% | 10% | 21% | 112% | 0.88 | $94,493,469 |
| MLS | Metals Australia | -2% | 0% | -8% | 10% | 0.044 | $26,102,556 |
| NCM | Newcrest Mining | -2% | 5% | -4% | -15% | 20.63 | $18,499,772,615 |
| GSM | Golden State Mining | -2% | -12% | 8% | -46% | 0.043 | $5,031,611 |
| AQI | Alicanto Min | -2% | -26% | -34% | -64% | 0.043 | $20,079,613 |
| DCN | Dacian Gold | -2% | -21% | 31% | -45% | 0.1025 | $121,680,094 |
| AM7 | Arcadia Minerals | -2% | -23% | 18% | 3% | 0.2 | $9,339,578 |
| PNT | Panthermetals | -2% | 8% | -9% | 0% | 0.2 | $6,150,000 |
| SFR | Sandfire Resources | -3% | 6% | 20% | -16% | 5.46 | $2,471,785,330 |
| AXE | Archer Materials | -3% | -12% | 1% | -50% | 0.585 | $145,645,816 |
| CMM | Capricorn Metals | -3% | 10% | 42% | 41% | 4.63 | $1,723,542,605 |
| IDA | Indiana Resources | -3% | 3% | 1% | -13% | 0.0555 | $27,805,767 |
| PDI | Predictive Disc | -3% | -5% | -3% | -26% | 0.185 | $322,077,482 |
| DTR | Dateline Resources | -3% | -50% | -56% | -56% | 0.037 | $20,911,827 |
| SVG | Savannah Goldfields | -3% | 6% | 29% | -22% | 0.18 | $31,067,719 |
| TTM | Titan Minerals | -3% | -25% | 16% | -27% | 0.072 | $103,022,943 |
| RXL | Rox Resources | -3% | 3% | -29% | -51% | 0.175 | $38,009,623 |
| RXL | Rox Resources | -3% | 3% | -29% | -51% | 0.175 | $38,009,623 |
| RND | Rand Mining | -3% | 1% | 1% | -6% | 1.36 | $77,351,307 |
| DEG | De Grey Mining | -3% | -1% | 54% | 8% | 1.2675 | $1,967,070,313 |
| KAU | Kaiser Reef | -3% | -3% | 14% | -23% | 0.165 | $21,492,431 |
| RRL | Regis Resources | -3% | 7% | 52% | 10% | 2.065 | $1,562,903,665 |
| IGO | IGO Limited | -3% | -8% | 34% | 18% | 13.49 | $10,162,534,050 |
| GWR | GWR Group | -3% | -2% | -35% | -52% | 0.06 | $19,272,999 |
| OKR | Okapi Resources | -3% | -17% | -25% | -58% | 0.15 | $22,100,774 |
| MM8 | Medallion Metals. | -3% | 0% | -29% | -27% | 0.15 | $20,993,259 |
| NSM | Northstaw | -3% | 45% | -17% | -52% | 0.145 | $17,418,415 |
| TLM | Talisman Mining | -4% | 4% | 0% | -16% | 0.135 | $25,344,832 |
| ERM | Emmerson Resources | -4% | -3% | -17% | -46% | 0.076 | $41,397,944 |
| NVA | Nova Minerals | -4% | -5% | 1% | -44% | 0.63 | $127,082,749 |
| MVL | Marvel Gold Limited | -4% | 0% | -7% | -57% | 0.025 | $17,612,359 |
| AUT | Auteco Minerals | -4% | -16% | 7% | -32% | 0.048 | $99,256,142 |
| G88 | Golden Mile Res | -4% | -18% | -18% | -53% | 0.023 | $4,705,564 |
| ALY | Alchemy Resource | -4% | -15% | 64% | 92% | 0.023 | $27,095,754 |
| KTA | Krakatoa Resources | -4% | -24% | -2% | -8% | 0.045 | $15,511,946 |
| PRU | Perseus Mining | -4% | -4% | 32% | 30% | 2.125 | $2,912,696,431 |
| KCN | Kingsgate Consolid. | -4% | -10% | 24% | -14% | 1.665 | $377,351,372 |
| NAG | Nagambie Resources | -4% | -6% | 50% | 10% | 0.066 | $35,218,291 |
| KRM | Kingsrose Mining | -4% | 16% | 14% | -22% | 0.065 | $48,914,224 |
| RMS | Ramelius Resources | -4% | 5% | 0% | -42% | 0.9175 | $802,512,587 |
| BNR | Bulletin Res | -4% | -26% | -19% | 21% | 0.085 | $24,285,061 |
| KSN | Kingston Resources | -5% | -14% | -2% | -51% | 0.081 | $33,667,946 |
| FG1 | Flynngold | -5% | -20% | 10% | -35% | 0.1 | $7,832,354 |
| ADT | Adriatic Metals | -5% | 5% | 60% | 27% | 3.14 | $673,998,537 |
| NXM | Nexus Minerals | -5% | 8% | 11% | -54% | 0.195 | $63,463,395 |
| TAM | Tanami Gold NL | -5% | -7% | -16% | -41% | 0.038 | $44,653,688 |
| VAN | Vango Mining | -5% | -3% | -10% | -34% | 0.037 | $46,617,692 |
| ALK | Alkane Resources | -5% | -13% | -16% | -42% | 0.54 | $317,360,074 |
| STN | Saturn Metals | -5% | 0% | -36% | -57% | 0.18 | $27,259,654 |
| CLZ | Classic Min | -5% | 0% | -94% | -94% | 0.009 | $7,886,028 |
| LRL | Labyrinth Resources | -6% | 0% | -11% | -54% | 0.017 | $16,311,285 |
| FAL | Falconmetals | -6% | 9% | 32% | -43% | 0.25 | $46,020,000 |
| SMI | Santana Minerals | -6% | -4% | -1% | 89% | 0.66 | $99,680,991 |
| MBK | Metal Bank | -6% | -11% | -18% | -53% | 0.033 | $9,400,508 |
| ZNC | Zenith Minerals | -6% | -23% | -14% | 4% | 0.245 | $87,828,645 |
| ASO | Aston Minerals | -6% | -9% | 13% | -26% | 0.081 | $89,082,475 |
| HXG | Hexagon Energy | -6% | -6% | -11% | -79% | 0.016 | $8,206,654 |
| A1G | African Gold . | -6% | 14% | 2% | -49% | 0.08 | $12,278,216 |
| YRL | Yandal Resources | -6% | -22% | -39% | -75% | 0.094 | $14,833,489 |
| GBR | Greatbould Resources | -6% | 8% | 32% | -36% | 0.09 | $38,381,847 |
| GMD | Genesis Minerals | -7% | -5% | -5% | -26% | 1.215 | $494,333,112 |
| GSN | Great Southern | -7% | -39% | -35% | -58% | 0.028 | $16,249,195 |
| CXU | Cauldron Energy | -7% | -28% | 3% | -72% | 0.007 | $4,890,732 |
| MI6 | Minerals260Limited | -7% | -17% | 47% | -43% | 0.345 | $77,000,000 |
| LYN | Lycaonresources | -7% | -21% | 2% | -15% | 0.275 | $9,052,656 |
| RED | Red 5 Limited | -7% | 21% | -23% | -29% | 0.205 | $586,491,510 |
| KZR | Kalamazoo Resources | -7% | -5% | 11% | -45% | 0.2 | $29,763,875 |
| MXR | Maximus Resources | -7% | -7% | -9% | -46% | 0.04 | $12,762,231 |
| WGX | Westgold Resources. | -7% | 15% | -28% | -57% | 0.855 | $409,683,661 |
| NWM | Norwest Minerals | -7% | -7% | 86% | -24% | 0.052 | $11,549,584 |
| GRL | Godolphin Resources | -8% | -10% | -18% | -47% | 0.074 | $9,351,186 |
| ARL | Ardea Resources | -8% | -24% | -7% | 54% | 0.725 | $119,194,427 |
| TMX | Terrain Minerals | -8% | -14% | -33% | -25% | 0.006 | $5,885,899 |
| ARV | Artemis Resources | -8% | -8% | -17% | -70% | 0.024 | $33,394,041 |
| MZZ | Matador Mining | -8% | -23% | -18% | -67% | 0.115 | $36,249,246 |
| SLR | Silver Lake Resource | -8% | -4% | -6% | -34% | 1.1625 | $1,092,449,591 |
| ARN | Aldoro Resources | -8% | -43% | 31% | -56% | 0.17 | $18,630,532 |
| PGD | Peregrine Gold | -8% | -16% | 0% | -4% | 0.39 | $15,500,756 |
| MHC | Manhattan Corp | -8% | -8% | -21% | -56% | 0.0055 | $8,394,533 |
| HAW | Hawthorn Resources | -8% | -4% | 34% | 22% | 0.11 | $36,686,717 |
| EM2 | Eagle Mountain | -9% | 3% | -26% | -73% | 0.16 | $45,831,501 |
| TSO | Tesoro Gold | -9% | -9% | -26% | -57% | 0.032 | $37,433,294 |
| AWJ | Auric Mining | -9% | -17% | -16% | -33% | 0.064 | $6,006,056 |
| KAL | Kalgoorliegoldmining | -9% | -22% | -18% | -43% | 0.082 | $6,194,768 |
| BMR | Ballymore Resources | -9% | -6% | -9% | -21% | 0.15 | $14,929,206 |
| MDI | Middle Island Res | -9% | -31% | -70% | -62% | 0.04 | $4,896,729 |
| FEG | Far East Gold | -9% | -21% | 53% | 0% | 0.45 | $62,797,418 |
| AAU | Antilles Gold | -9% | -19% | -55% | -62% | 0.029 | $13,523,008 |
| GAL | Galileo Mining | -10% | -22% | -39% | 258% | 0.805 | $156,123,692 |
| BNZ | Benzmining | -10% | -4% | -9% | -37% | 0.41 | $29,224,489 |
| E2M | E2 Metals | -11% | 10% | 42% | -41% | 0.17 | $33,852,495 |
| AMI | Aurelia Metals | -11% | -24% | -54% | -71% | 0.125 | $148,492,466 |
| TG1 | Techgen Metals | -11% | -23% | -38% | -44% | 0.081 | $4,456,557 |
| ADG | Adelong Gold Limited | -11% | 14% | -60% | -73% | 0.008 | $3,211,756 |
| MOM | Moab Minerals | -11% | -20% | -71% | -68% | 0.008 | $5,455,708 |
| BMO | Bastion Minerals | -12% | -53% | -79% | -88% | 0.03 | $3,147,498 |
| CDT | Castle Minerals | -13% | -19% | -5% | -19% | 0.021 | $21,988,846 |
| AAJ | Aruma Resources | -13% | -29% | -8% | -20% | 0.055 | $8,789,844 |
| GBZ | GBM Rsources | -13% | -17% | -35% | -64% | 0.04 | $22,510,623 |
| PKO | Peako Limited | -13% | 0% | 18% | -35% | 0.013 | $4,929,799 |
| A8G | Australasian Metals | -14% | -24% | 6% | -62% | 0.19 | $8,439,951 |
| MCT | Metalicity Limited | -14% | -14% | -25% | -69% | 0.003 | $10,476,118 |
| GML | Gateway Mining | -14% | -18% | -23% | -61% | 0.054 | $11,978,581 |
| ICL | Iceni Gold | -15% | -38% | -12% | -53% | 0.08 | $10,768,500 |
| NMR | Native Mineral Res | -15% | -42% | -29% | -51% | 0.11 | $12,721,483 |
| REZ | Resourc & En Grp | -16% | -6% | -47% | -73% | 0.016 | $7,996,893 |
| PUA | Peak Minerals | -17% | -17% | -50% | -64% | 0.005 | $5,206,854 |
| NAE | New Age Exploration | -22% | 0% | 17% | -42% | 0.007 | $10,051,292 |
| GMN | Gold Mountain | -28% | -28% | 63% | -59% | 0.0065 | $11,047,044 |
| AVW | Avira Resources | -33% | -33% | -43% | -60% | 0.002 | $4,267,580 |
| ANL | Amani Gold | -33% | 0% | 0% | 0% | 0.001 | $24,693,441 |
| SIH | Sihayo Gold Limited | -50% | -50% | -60% | -88% | 0.001 | $6,102,128 |
| CODE | COMPANY | 1 WEEK RETURN % | 1 MONTH RETURN % | 6 MONTH RETURN % | 1 YEAR RETURN % | PRICE | MARKET CAP |
| AL8 | Alderan Resource | 33% | 14% | -33% | -77% | 0.008 | $4,047,863 |


Get the latest Stockhead news delivered free to your inbox.