
Via Getty
The Candlestick: Your awesome ASX 200 baby bump checklist
Experts
Via Getty
Experts
Carl Capolingua is the only Australian technical analyst you will meet in this story.
He works by candlelight at ThinkMarkets and lives with the little candelabrums in the western state that does what it wants, where they admire his unique brand of price action-based naked trend tracking.
Capo has been honing this art over some 30 years of investing, advising, and managing funds.
Every week in The Candlestick, Capo muscles into the unknowable iterations of markets – global, local and then rips into the very stocks that drive them.
Here he is sans photoshop:

Morning all.
Awesome. There’s no other word for it.
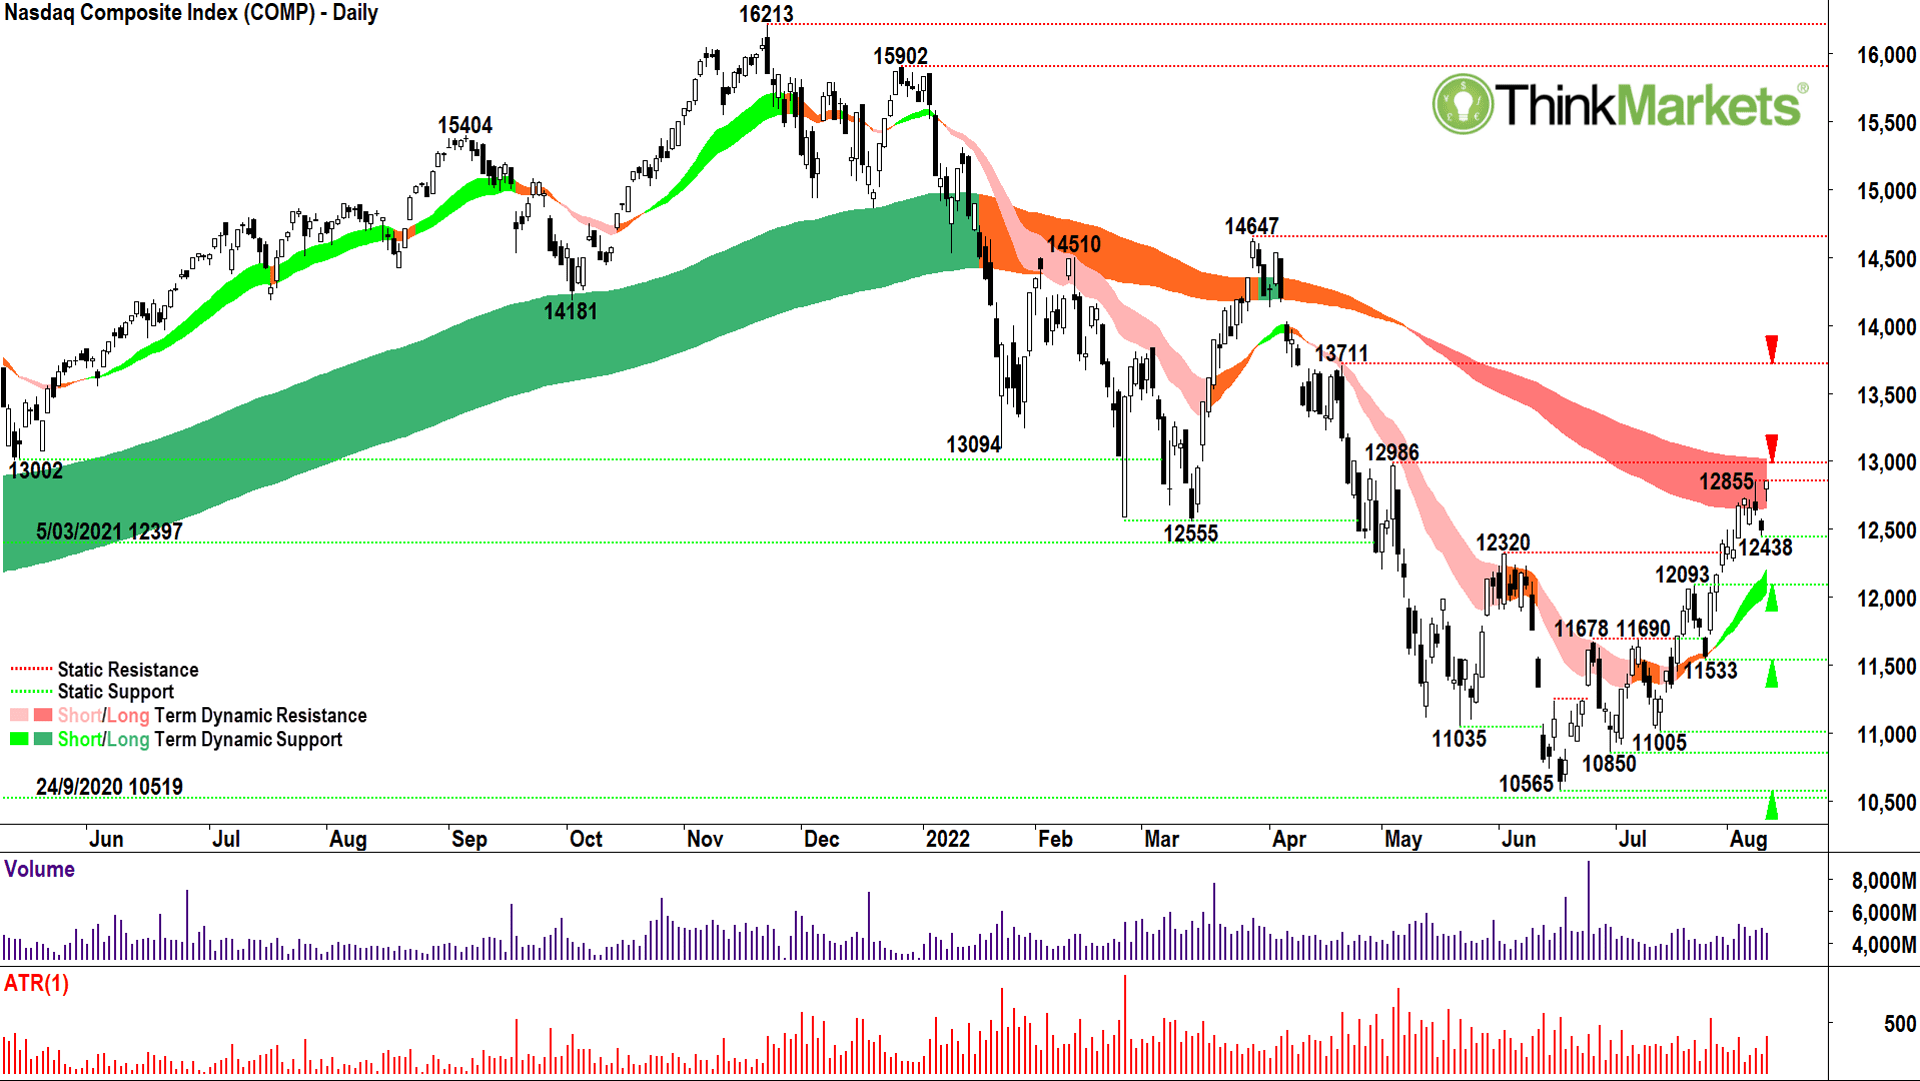
As in, I am in awe of some of the speed and magnitude of the rally in global equities led by the Nasdaq Composite (COMP) in the USA.
The COMP’s rally from the 10,565 bear market low to Wednesday’s close of 12,861 is a monster. I certainly did not foresee it at that low, nor really did I believe it could happen pretty much any of the way. Even now, there’s something nagging at the back of my mind which tells me not to go with it. But, as a trend follower, I must put aside those nagging suspicions and assume the market’s got it right!
+21.7% in 37 trading sessions.
That’s the damage if you’re a bear, the equity in the bank if you’re a bull. Note, there have been only four times the COMP has rallied this far this fast.
One occurred after the Covid-19 Pandemic slump in 2020 as central bankers and politicians rode to the rescue of the global economy. Given the unprecedented magnitude of the stimulus it kinda made sense at the time.
One occurred in 2009 as the bear market caused by the GFC ended – again plenty of punchbowl for investors to commence the partying. One occurred in 2002 to cause the COMP to emerge from its worst ever bear market – the dreaded Dot-com crash. Similar, recession busting stimulus.
The fourth rally of note, investors will hope, is not a template for the current rally. It occurred in 2001 within the broader secular Dot-com bear market. Then, the COMP rallied a whopping 48.5% from its low before dropping back to take out the prior low and plumb the final bear market low in 2002.
Still, even if it is a template, doesn’t that mean we could have far more to rise before any eventual worse case stagflation scenario plays out? Possibly.
One thing is for sure, the candles will tell us when supply is building, when demand is waning, and when this uptrend has come to an end.
With that in mind, let’s look at some charts!
I reckon this stat’s flown under the radar a little.
A common definition of a bull market is a 20% rally from the bear market low on an end of day closing basis.
The Nasdaq Composite quietly notched this milestone Thursday 4 August closing at 12720, up 20.4% from its 16 June low of 10565.
Officially, then, welcome to the new COMP bull market! Woo-hoo!
The reason why you haven’t heard more about this (I believe important psychological milestone) is because the benchmark US stock index, the S&P500, remains in bear market territory. At its most recent best close of 4211 on 10 August, it’s 15.8% above its 3636 16 June low, and therefore, requires a further 4.2% closing gain to signal its own bull market.
For the COMP at least, the argument of whether this is just another bear market rally, or the start of the next bull market, is officially moot! Clearly, the more important question is how much the new bull has to run?
The answer on the chart is 13,711 – the next key static supply point, and besting that, 14,647.
Watch for supply-side candles (i.e., black bodied candles and or upper shadows) at each of these zones to signal the current short-term uptrend is about to pause. But that short-term uptrend, as evidenced by the short-term trend ribbon (light-green zone), appears strong and sustainable – the ribbon is both steepening and expanding, that is!
Before we get to 13,711 or 14,647, we must first properly deal with the long-term downtrend ribbon (dark-pink zone) within which the current price action resides. The clear supply-side candle plus follow-through selling on 8 and 9 August should have precipitated a greater decline from this zone.
The fact that the massive “gap and run” on 10 August smashed through that two-candle pattern’s high is a major show of force by the demand-side. It also shows the supply-side is running scared.
I suggest a close above 12,986 seals the deal for dispensing with the long-term trend ribbon as a nagging dynamic supply zone.
Given the strength of the 10 August move, I’m going to jump the 12,986 gun a little and concede this new COMP bull has legs. In the previous Candlestick a couple of weeks ago, I switched my bias on the COMP from “Bearish” to “Neutral”; today I’m switching to “Bullish”.
Watch the candles carefully, white bodies and lower shadows are the bull market’s best friend.
Black candles and upper shadows will give cause for concern. But while the demand zone between 12,093 and 12,320 holds, the COMP rally remains intact.
View: Bullish, happy to buy pullbacks to areas of demand until a close below 12,093.
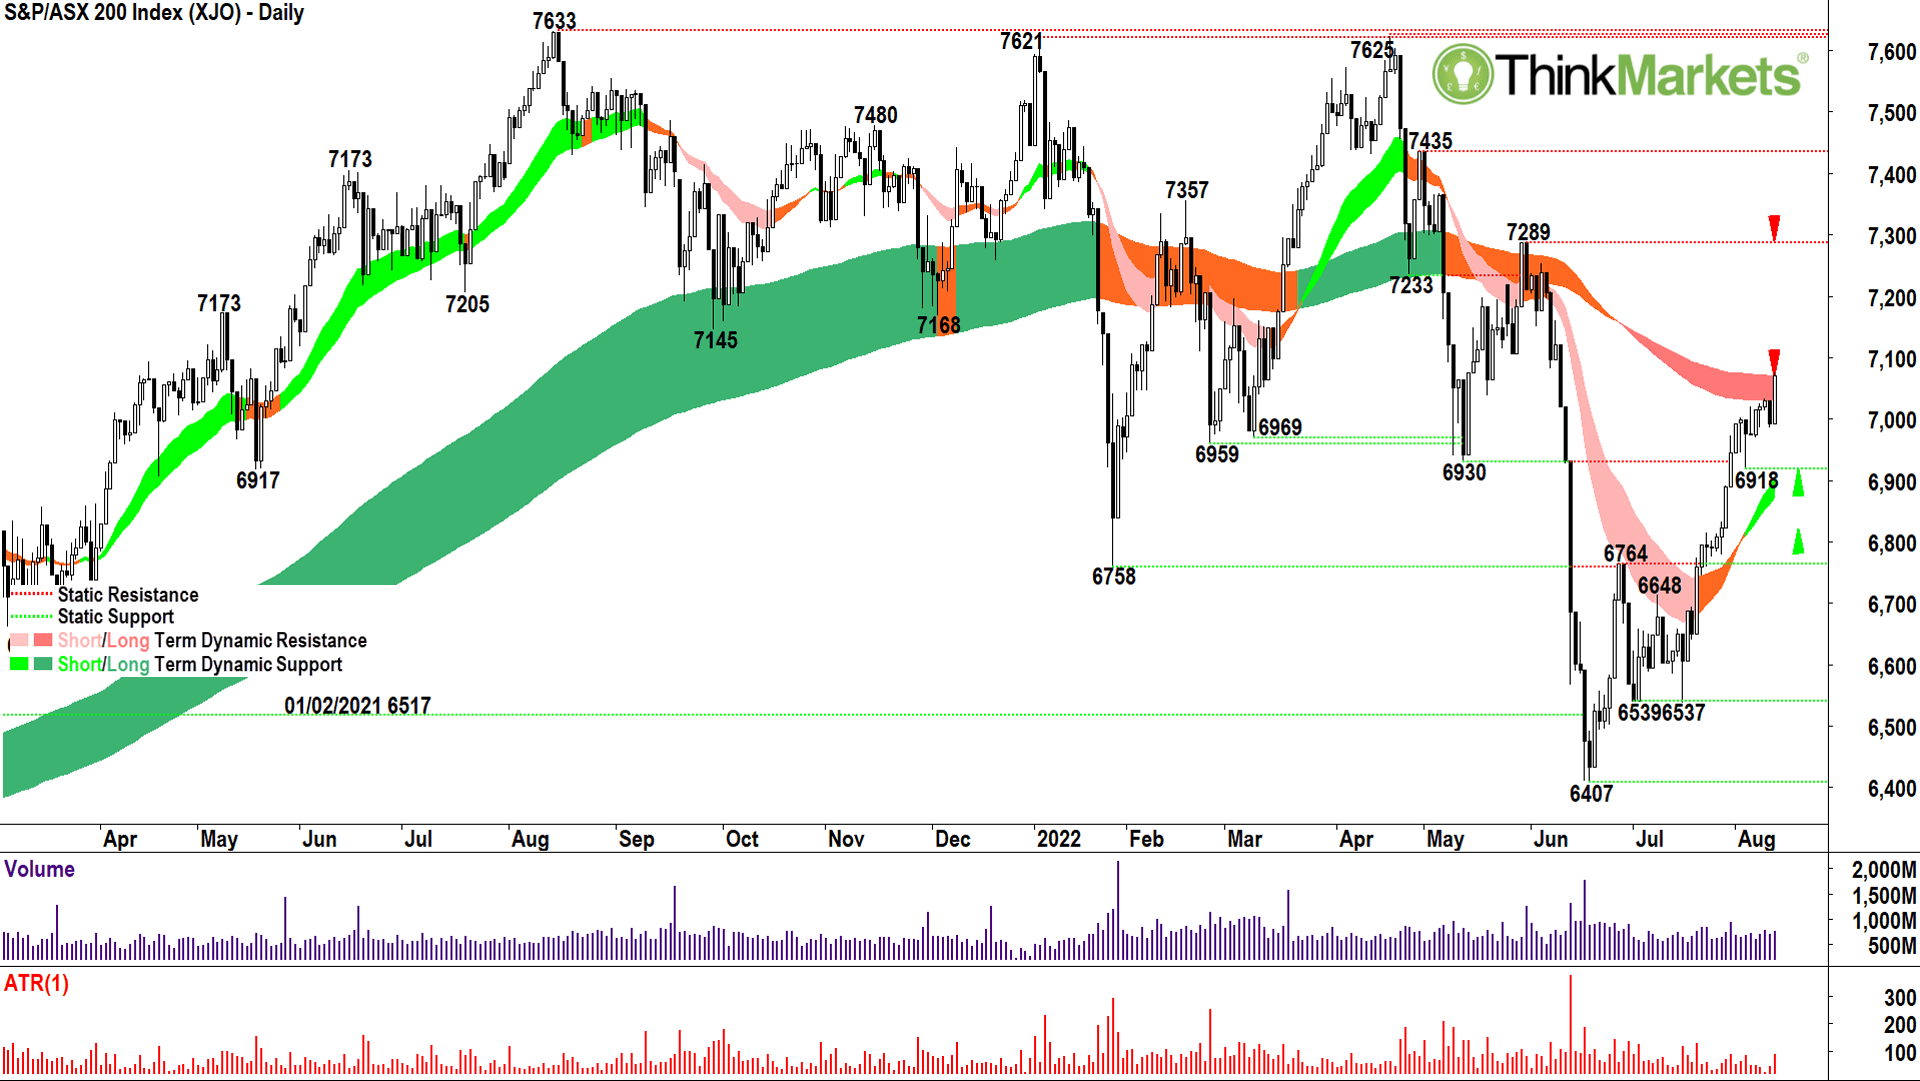
In the last Candlestick the XJO was just clipping the static supply point at 6764. The chart above shows what a stonking great rally it’s had since then! Complete with a new “seven handle” – that’s trader talk for the index is now trading in the 7,000’s.
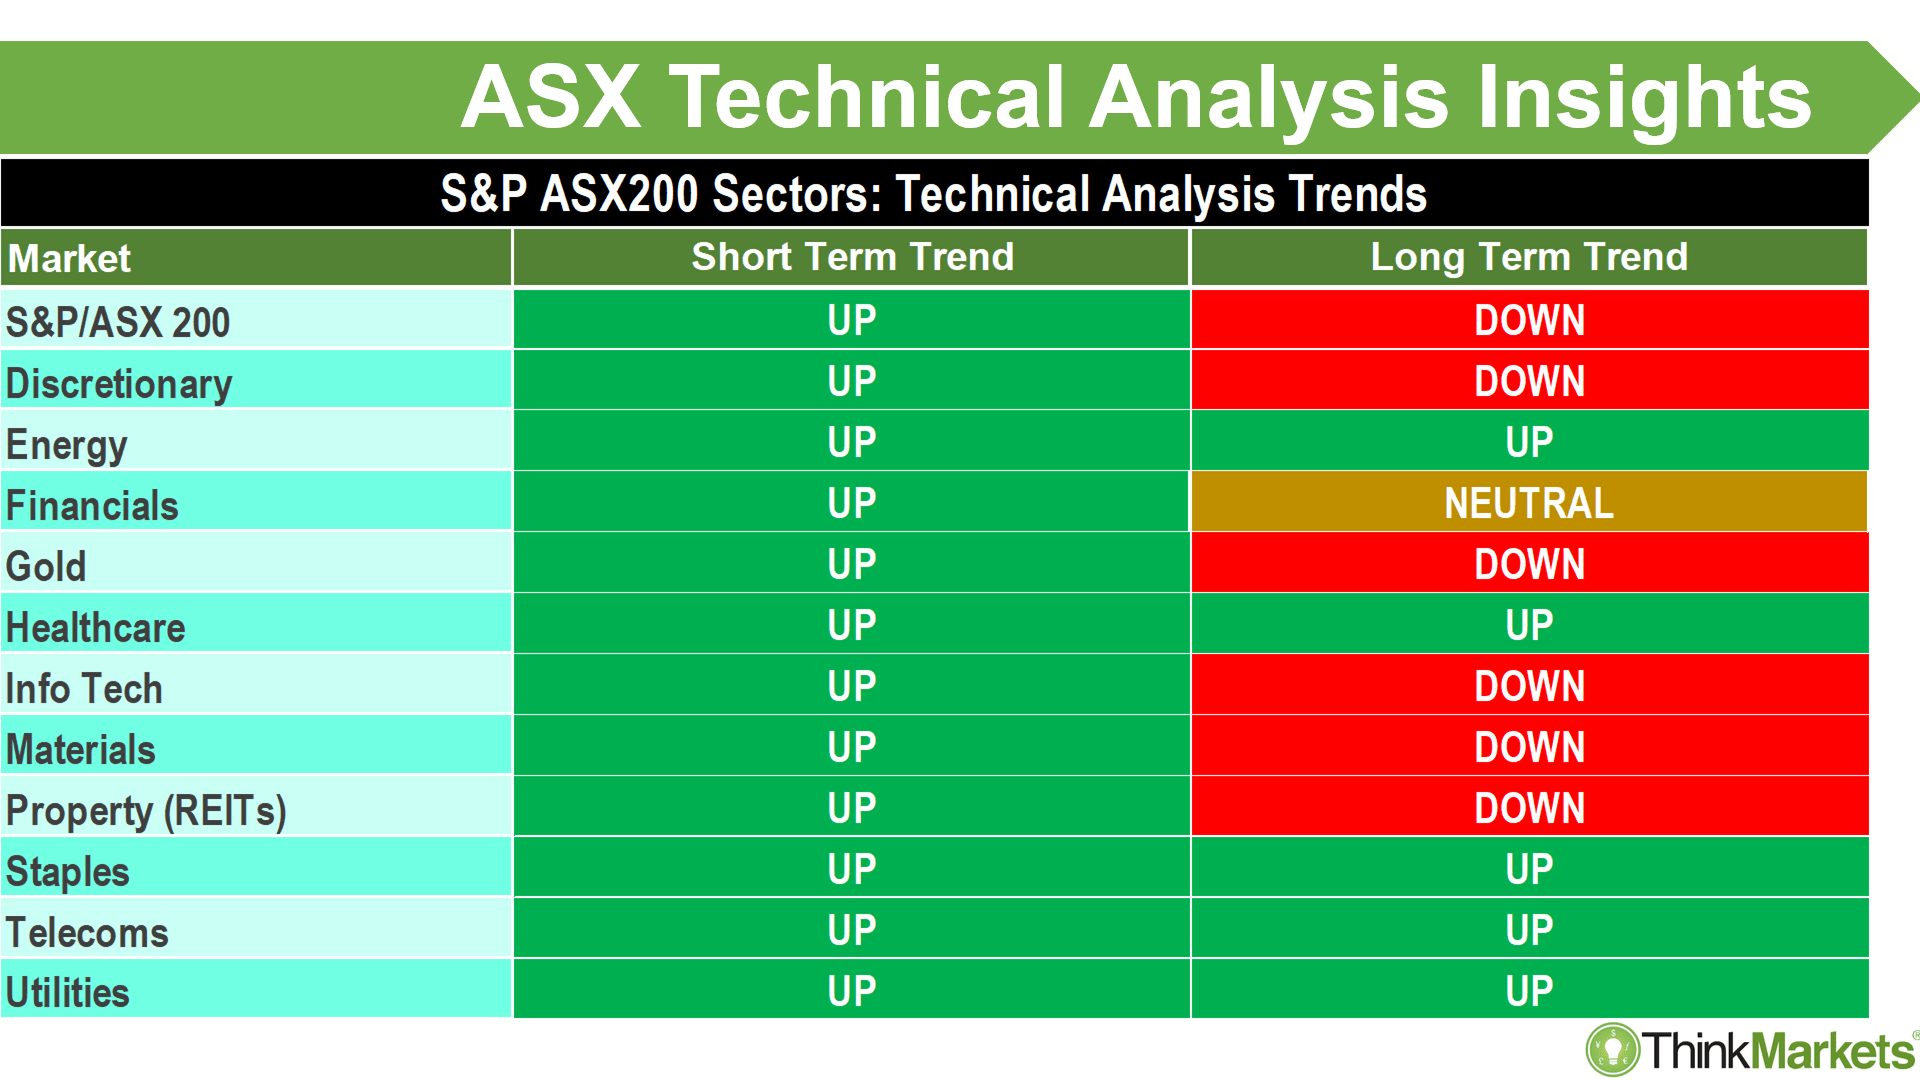
The rally has been broad-based with all sectors participating in the short-term rally at least. Much of the short-term momentum is also beginning to spill into longer term trends. Still, I prefer to stick with the “double greens” of Healthcare, Consumer Staples and Utilities.
These sectors have the benefit of being traditionally quite defensive, that is, they tend to hold up better in market downturns. Energy’s long-term trend is flattening out, and Telecom’s is too early to embrace with any confidence just yet. Financials are the closest of the other sectors to moving into a double green scenario.
The others are a mixed bag.
I don’t mind Discretionary, Info Tech, and REITs – these short-term uptrends look solid enough to allow some strategic nibbles. I remain sceptical on the recovery in Gold and Materials.
Back to the XJO technicals. Like the COMP, the long-term downtrend ribbon (dark-pink zone) is in play. To resume a long-term uptrend, the XJO needs to trade and hold above it.
The next few candles are going to be crucial in telling us whether we can dispense with this dangerous dynamic supply zone and push on to test higher supply points at 7289 and 7435, or if supply reasserts and we fall back to demand at 6918. The bottom of the short-term trend ribbon (light-green zone) at 6875 would be the last line of demand – below here and there’s a good chance we’re headed back down again.
So, watch for white candles and or lower shadows around current prices to signal the former, or black candles and upper shadows to signal the latter. I’m happy to take frequent nibbles on individual plays, but I’m not ready to go all out bullish just yet. Having said that, I will switch the bias to a tentative “Bullish” from the previous “Neutral”.
View: Bullish, happy to buy pullbacks to areas of demand until a close below 6875.
And now for your sheer charting pleasure, let’s expand a little on this theme of “dealing with the long-term trend ribbon”.
I’ve compiled a group of charts of stocks at various stages of doing this to give you a better idea of what needs to occur on the indices as discussed above, and possibly also those stocks in your portfolio which have not yet scraped themselves off the canvas!
As a trend follower, I can never pick the bottom of a major move. I must wait for sufficient evidence excess demand is returning to the system to facilitate a high probability entry.
So, predominantly supply-side candles must transition to predominantly demand-side candles. Lower peaks and lower troughs must transition to higher peaks and higher troughs. Falling trend ribbons should transition to rising trend ribbons – and they should begin to support prices on the way up instead of impede them as they did on the way down.
Let’s call this the “Turnaround Checklist”!
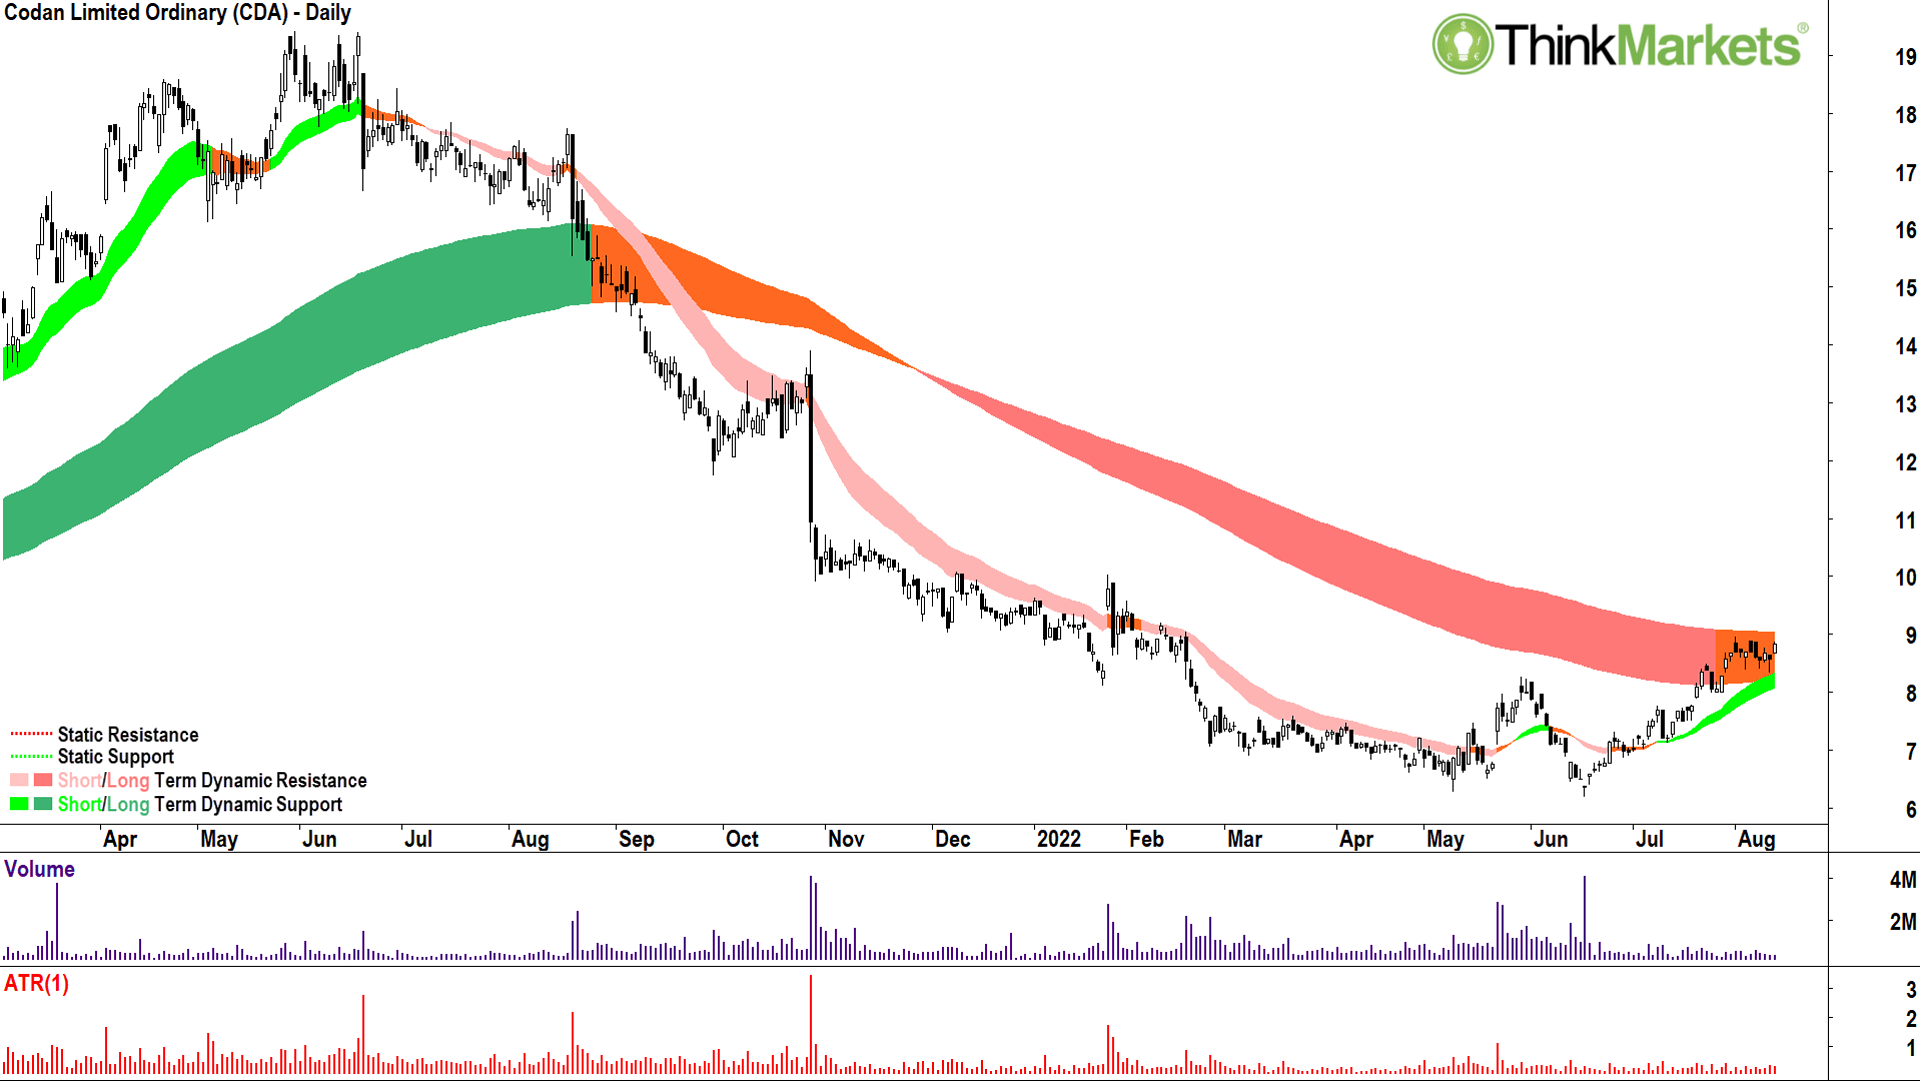
A one-time market darling, and then from June 2021, the worst mistake many made in a long time! Well, if you’ve been holding on belligerently in hope, Codan is starting to show signs excess demand is returning to the system.
Tick, tick, tick, tick on the Turnaround Checklist.
Just the pesky long-term trend ribbon (orange zone) to deal with. Ideally, we see a close above this zone before entering.
I peg the all-important key level as $9.05. Even better, a close above this would also take out the 1 August swing high at $8.97.
View: Bullish on a close above $9.05.
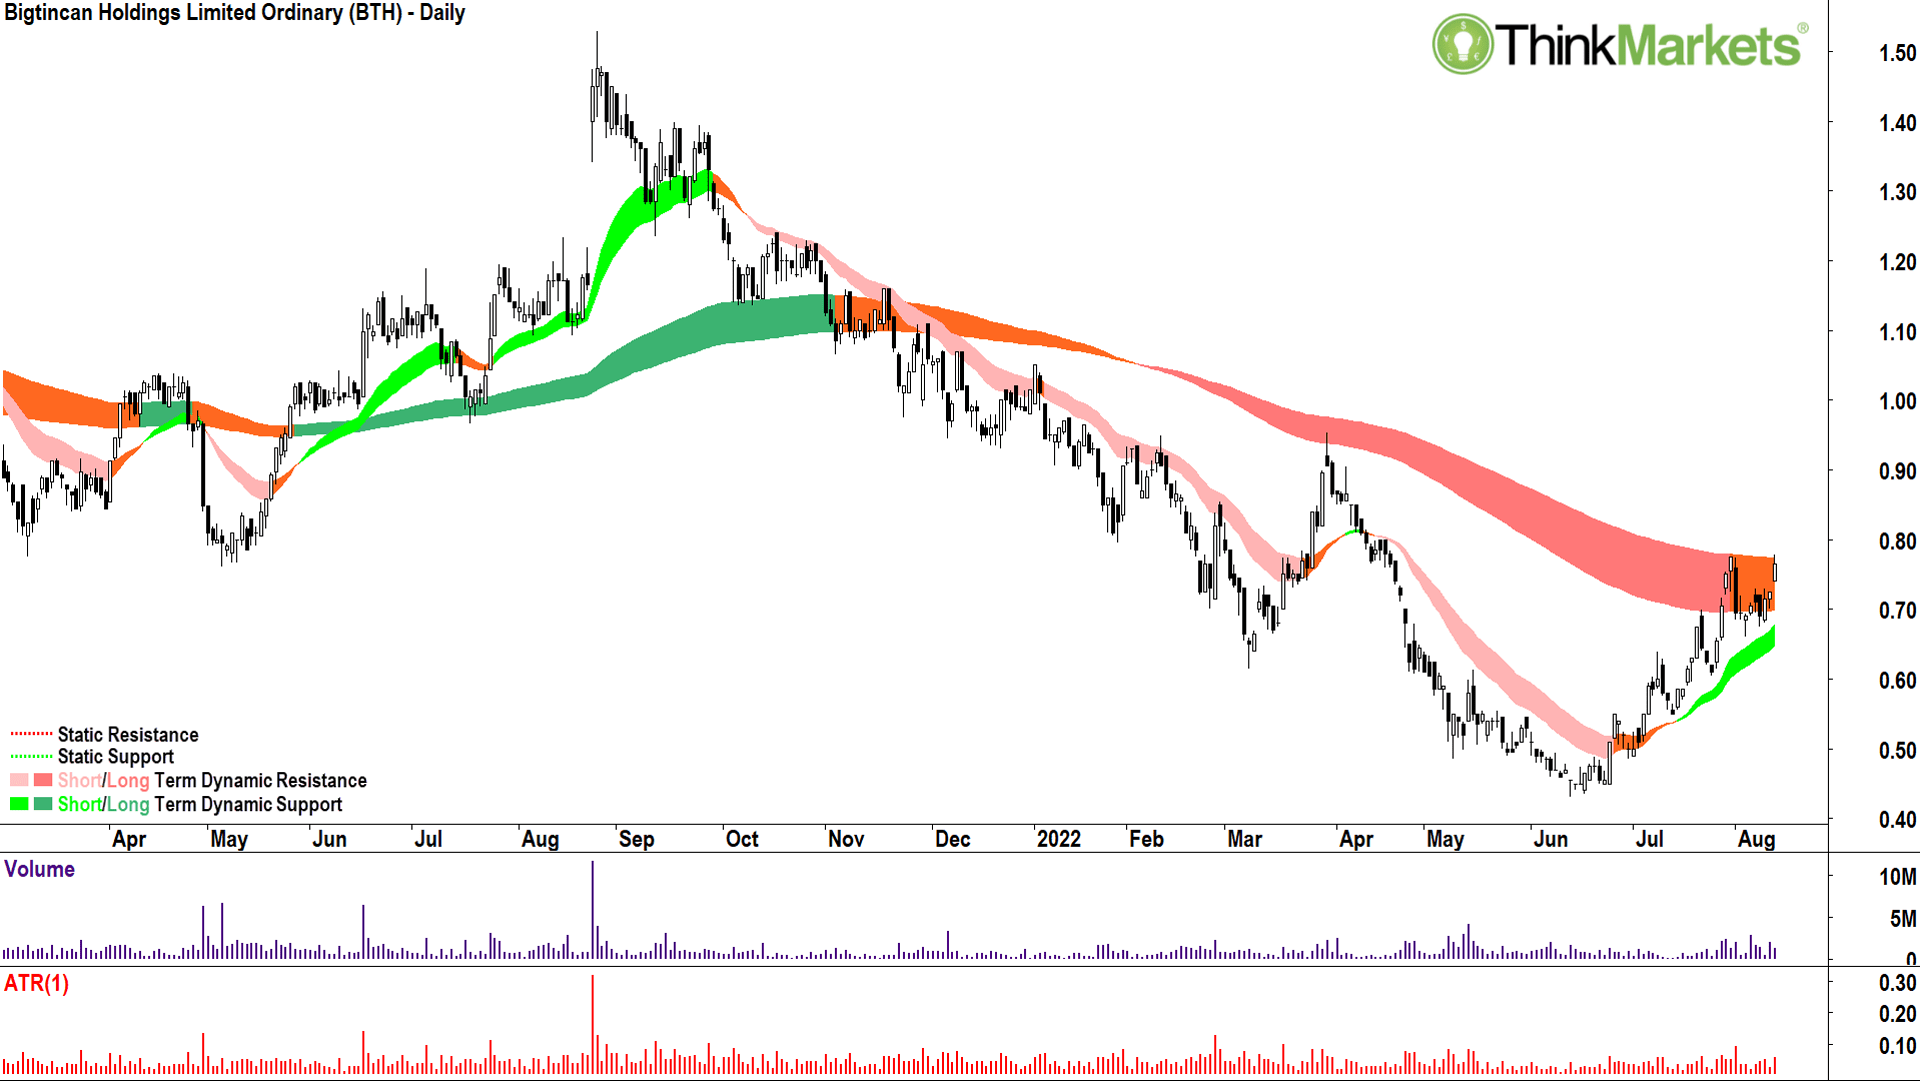
Similar to Codan, Bigtincan went from hero to zero.
The chart shows it might be about to take a shot at hero again. The technicals are shaping up nicely with an improving short-term trend ribbon (light-green zone), consistent white candles, and sound price action. Again, Bigtincan just needs to confirm the move back to a long-term uptrend by dispensing with the long-term trend ribbon (orange zone).
I peg the key level as $0.78, and a close above this would also take out the 29 July swing high at $0.775.
View: Bullish on a close above $0.78.
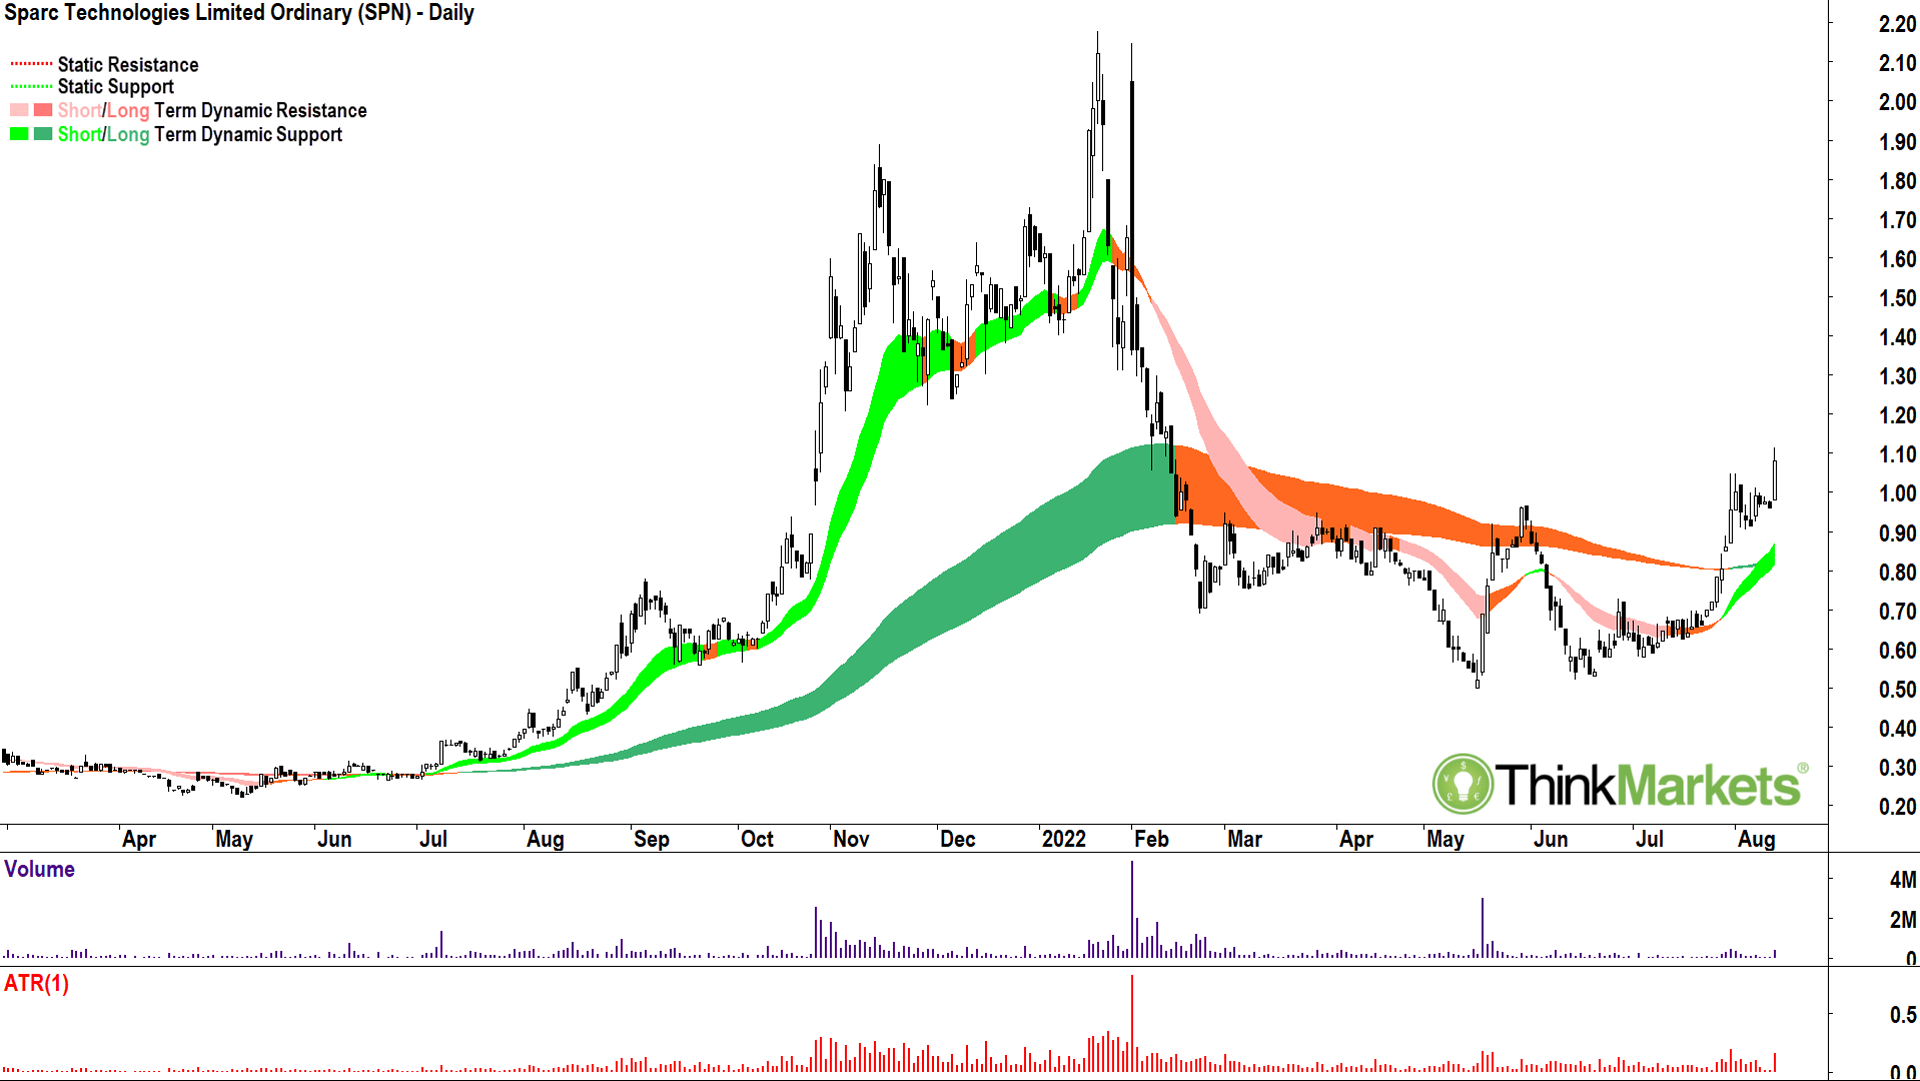
This is one I’ve been tracking with clients in my weekly Tuesday webinars. It’s a textbook example of how you turn around! Great candles, great price action, expanding and steepening short-term trend ribbon (light-green zone). It smashed through the long-term trend ribbon (orange zone), pulled back to test it, held, and is shooting higher again.
All good stuff. Volume shows some solid supply removal. Next supply point is the 6 October 2021 major swing low at $14.36 – but there’s plenty of room to move until we get there.
View: Bullish, happy to buy pullbacks to areas of demand until a close below the 8 August low at $10.36.
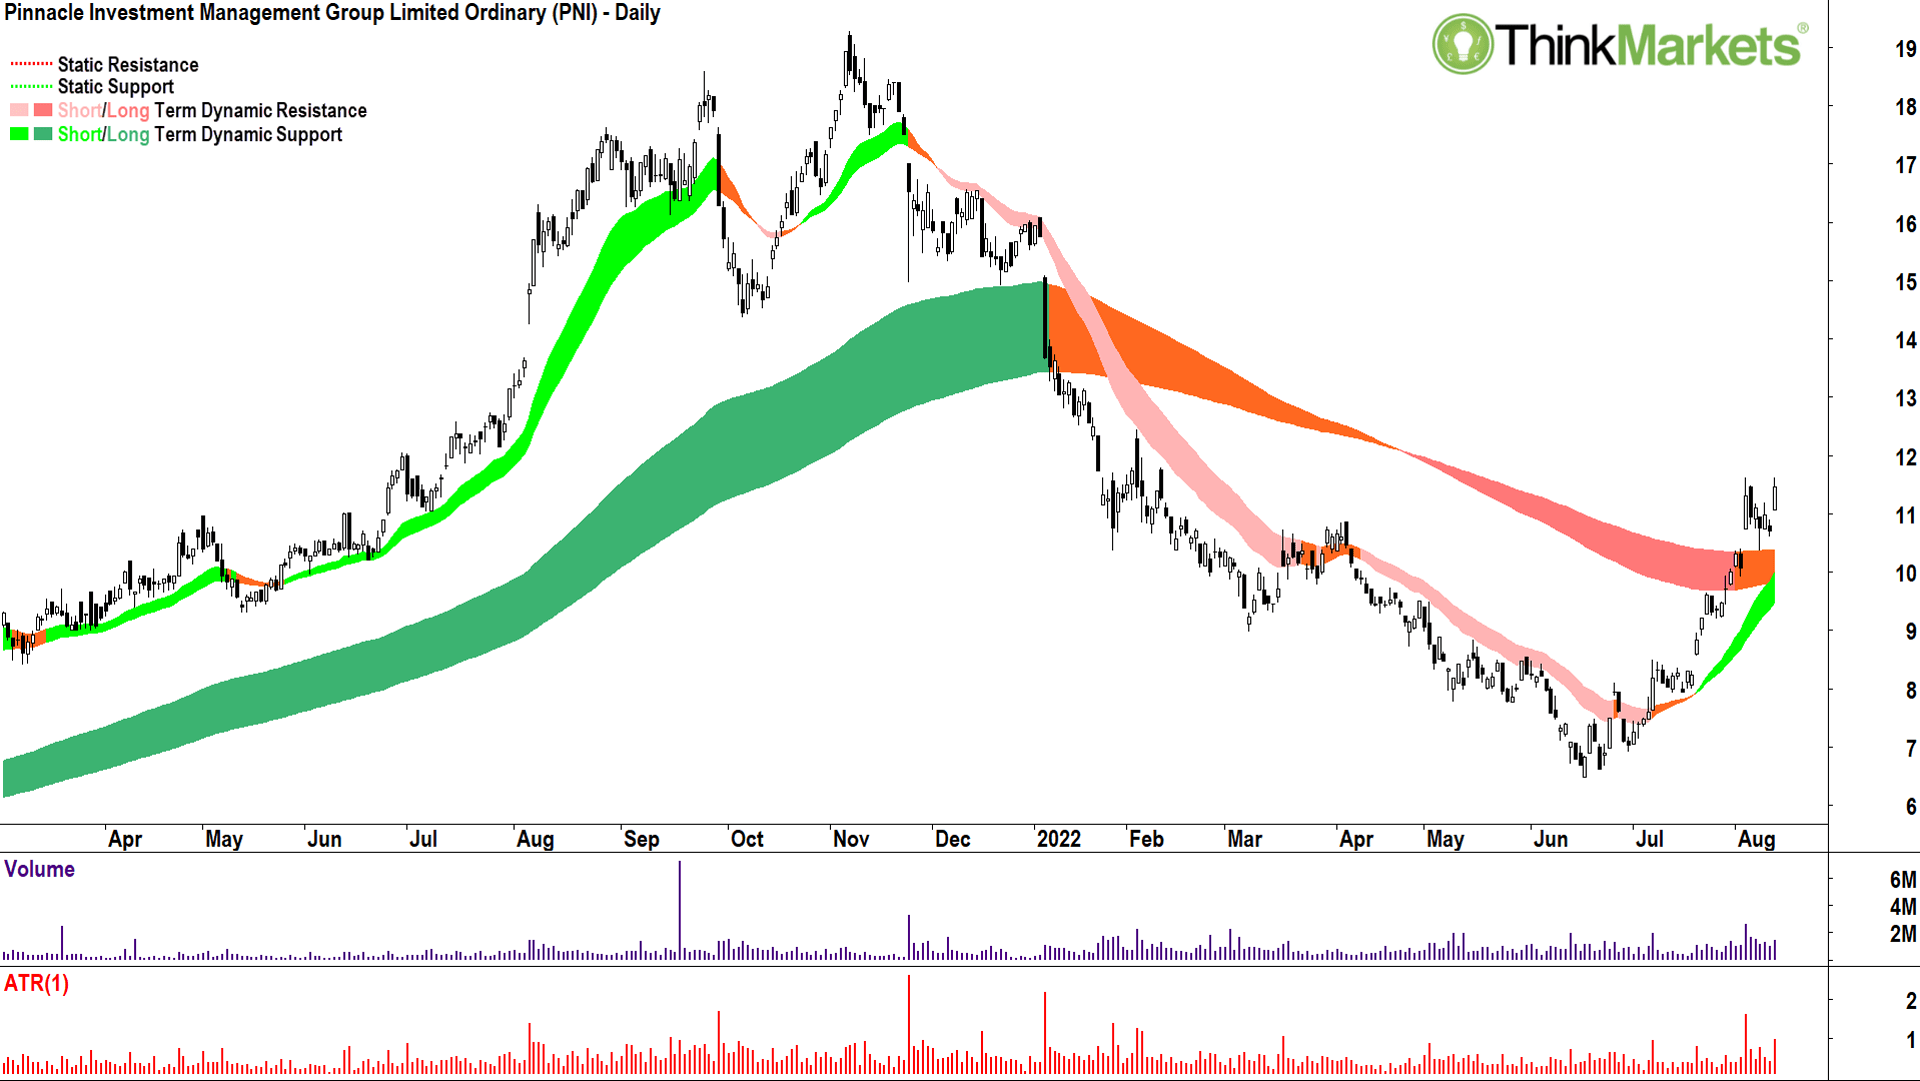
Another really attractive turnaround play. Ditto on the PNI techncials.
Supply is potentially a little closer, however (29 November 2021 major swing low at $1.22), but I expect this will be a formality based upon the demand-side control exhibited in those beautiful candles.
A very pretty chart.
View: Bullish, happy to buy pullbacks to areas of demand until a close below the 3 August low at $0.90.
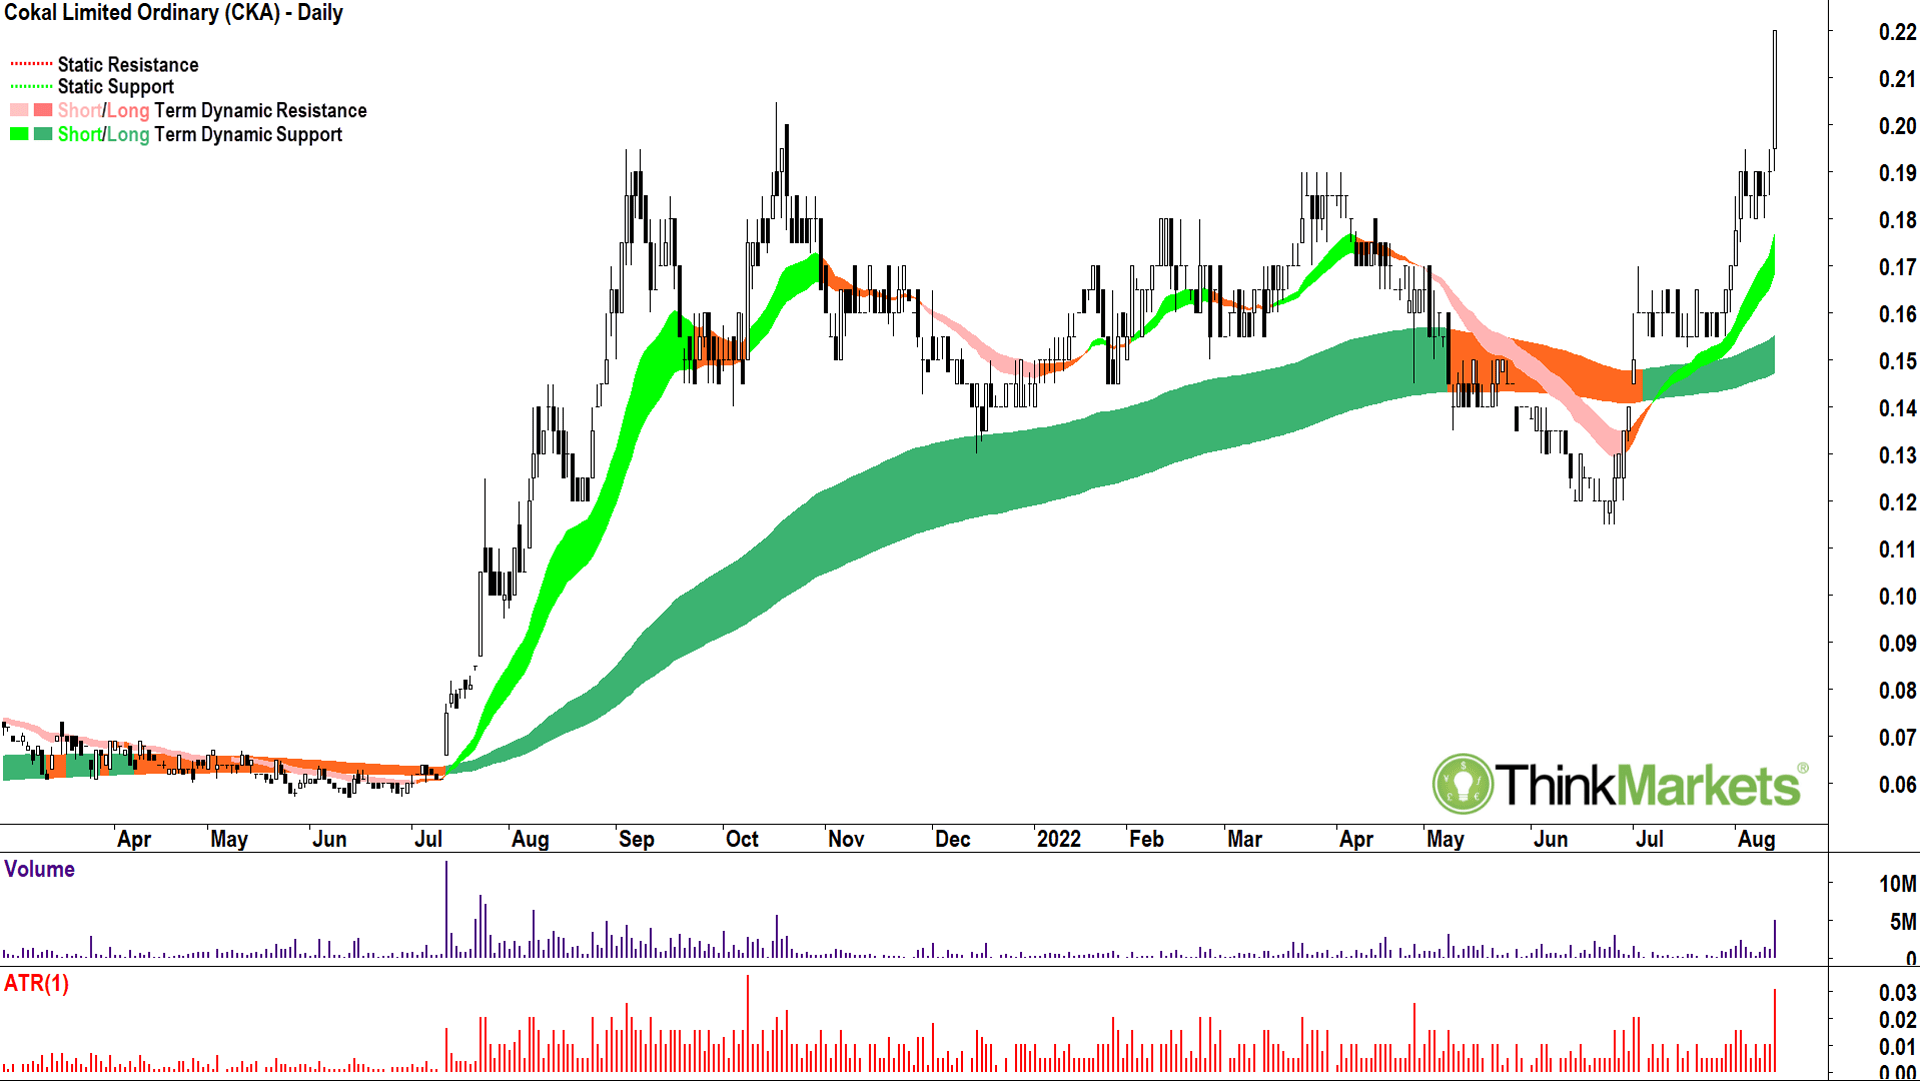
It’s now trading at 9-year highs. Double green on the trend ribbons, solid price action, and total demand-side control exhibited in the candles. There’s nothing I don’t like about the Cokal chart.
View: Bullish, happy to buy pullbacks to areas of demand until a close below the 3 August low at $0.90.
The views, information, or opinions expressed in the interviews in this article are solely those of the interviewees and do not represent the views of Stockhead. Stockhead does not provide, endorse or otherwise assume responsibility for any financial product advice contained in this article.


Get the latest Stockhead news delivered free to your inbox.