
Mining
Fortescue is dialled in to critical minerals; here's some areas the major miner is tuned into

Mining
Reporting Rodeo Pt. 2: Here's how analysts think another 7 mid-tier ASX miners performed in the March quarter

Mining

Via Getty
Experts
Carl Capolingua is Australia’s only technical analyst.
None other shall pass.
Carl works by candlelight at ThinkMarkets and lives with the little candelabrums in the western state that does what it wants, where they admire his unique brand of price action-based naked trend tracking.
Capo has been honing this art over some 30 years of investing, advising, and managing funds.
Every week in The Candlestick, Capo plots the unknowable iterations of markets global, local and the very stocks within them.
Here he is:

Steady as she goes… until she goes (one way or the other that is!)
I can do this week’s Candlestick pretty quickly. Not a great deal has changed since our last update.*
(ED: Due to an editing delay, this week’s Candlestick was written during Tuesday’s session.)
Mostly, I can see short-term uptrends within long-term downtrends. So, as a trend follower, it’s very much sit on your hands kind of stuff.
If you’ve been investing for longer than 5 minutes, you’ve probably come to realise sometimes not doing anything is far more effective than continuing to bang away at a strategy which worked great when everything was going up… but has been 11/10ths of useless since the good times ended.
A mentor of mine (let’s call him Wise Candlestick) once told me when I was just starting out on my investing journey, “Carl, there are old traders and there are bold traders, but there are very few old, bold traders.”
Now, it turns out Wise Candlestick stole that pearl from investing legend Ed Seykota, who told it to author Jack Schwager in his classic book on investing Market Wizards: Interviews with Top Traders (First Ed. 1989). If you’re serious about transforming your investing into something more than a hobby, I highly recommend getting a copy of that book and committing every word to memory (Wise Candlestick subsequently lent me his tattered and underlined copy!).
Market Wizards is a compilation of interviews with winners. If you want to be a winner, then you have to behave how winners do.
When it comes to investing, winners understand managing your risk and protecting your capital is more important than making money. Sure, making money is important, otherwise how would you know if you’re a winner? But the winners in that book each came to the same realisation somewhere in their journey: If I don’t manage my risk and protect my capital, I’m never going to have enough capital left after the bad times to come back and make any serious money during the good times.
I’m not proposing to be your Wise Candlestick, (are we having a moment here?) but let me suggest you start with the risk part first!
Understand when the odds are stacked in your favour (for me it’s when there’s a strong trend one way or the other) and go hell for leather when it is.
When it’s not, sit on your hands and wait until there is. Almost invariably, your patience will be rewarded.
If you do decide to play, work out where your exit point is if your thesis is wrong first. Then determine if there’s enough upside if your thesis is correct so you stand to gain at least as much as what you’re risking.
If the reward to risk is skewed in your favour, play – if there isn’t, move on.
Always: respect the fact the market can and will make a monkey out of your original thesis.
Don’t take it personally, the market does this to everyone! Be humble, take a small measured loss and live to fight another day. Don’t be a hero, don’t insist the market’s got it wrong this time, and please, please, please, don’t be ‘that person’ who holds all the way down (Zip Co. shareholders, I am talking to you! 😁).
Anyways, enough italicised wisdom-babble, let’s look at some charts!
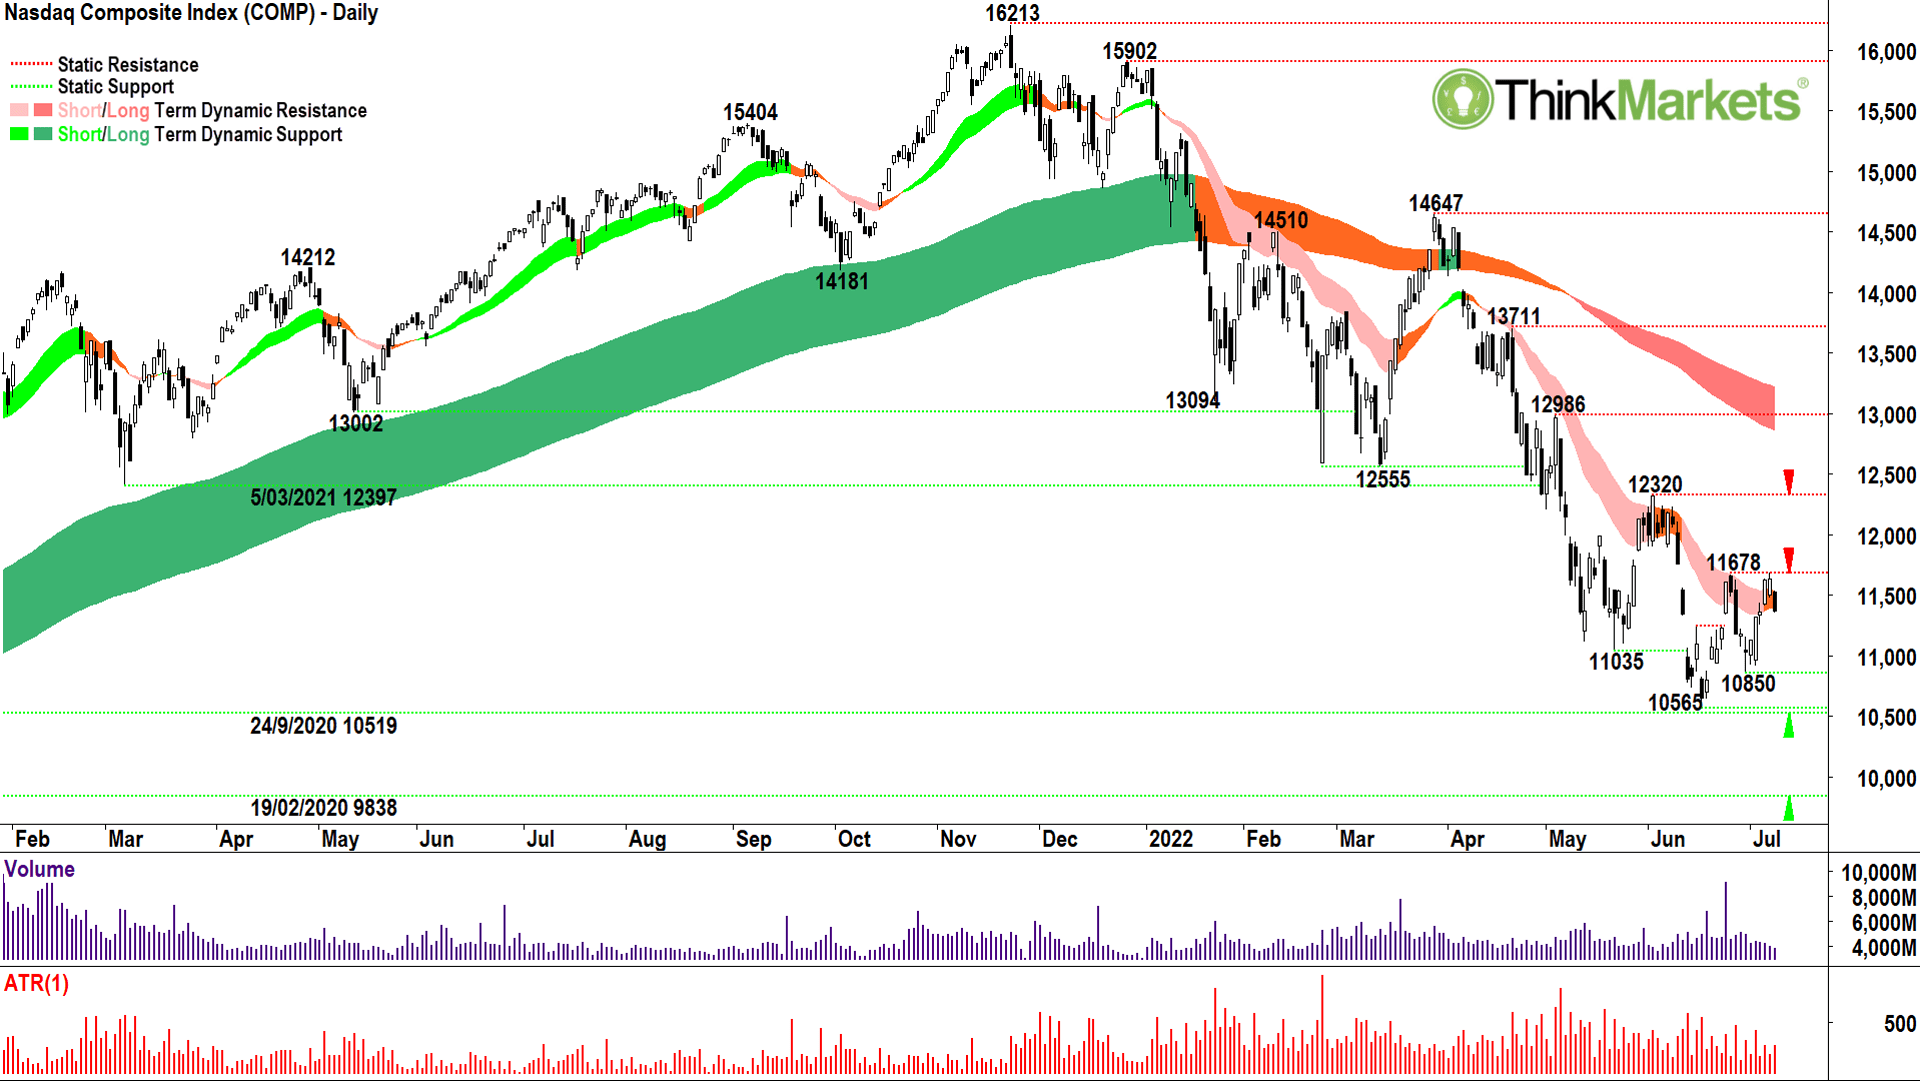
Last week we noted a promising rally on the COMP, but like a broken record, pondered how it would fare in the short-term downtrend ribbon (light pink zone). That ribbon has been absolutely prophetic since the start of the bear market in determining where fledgling rallies go to die. Really, only the monster from 12,555 to 14,647 in March escaped its vice-like grip – and even then, not for very long. Monday’s candle appears to show more of the same is ahead.
However, I do note some positives in the price action. The 8 July high of 11,690 (now a peak) just pipped the 11,678 peak and with the 10,850 trough above the 10,565 (now) swing low, well, that’s higher peaks and higher troughs! The short-term downtrend ribbon is flattening (if I squint), and the candles since 10,565 have been skewed to the demand-side.
I know I am hedging my bets here a little – but that’s just the kind of market we’re in – it could go either way… Keep an eye out now for: 1. Follow through supply-side candles (i.e., large black and or upper shadows) pushing lower out of the short-term downtrend ribbon = bearish case = expect a retest of 10,565; or, 2. This rally has legs, the bulls snap it back and quickly close above 11,690, it confirms higher peaks and higher troughs and we’re headed to test 12,320. My tip, well the next bit says it all…
View: Bearish, continue to sell rallies until a close above 12,320.
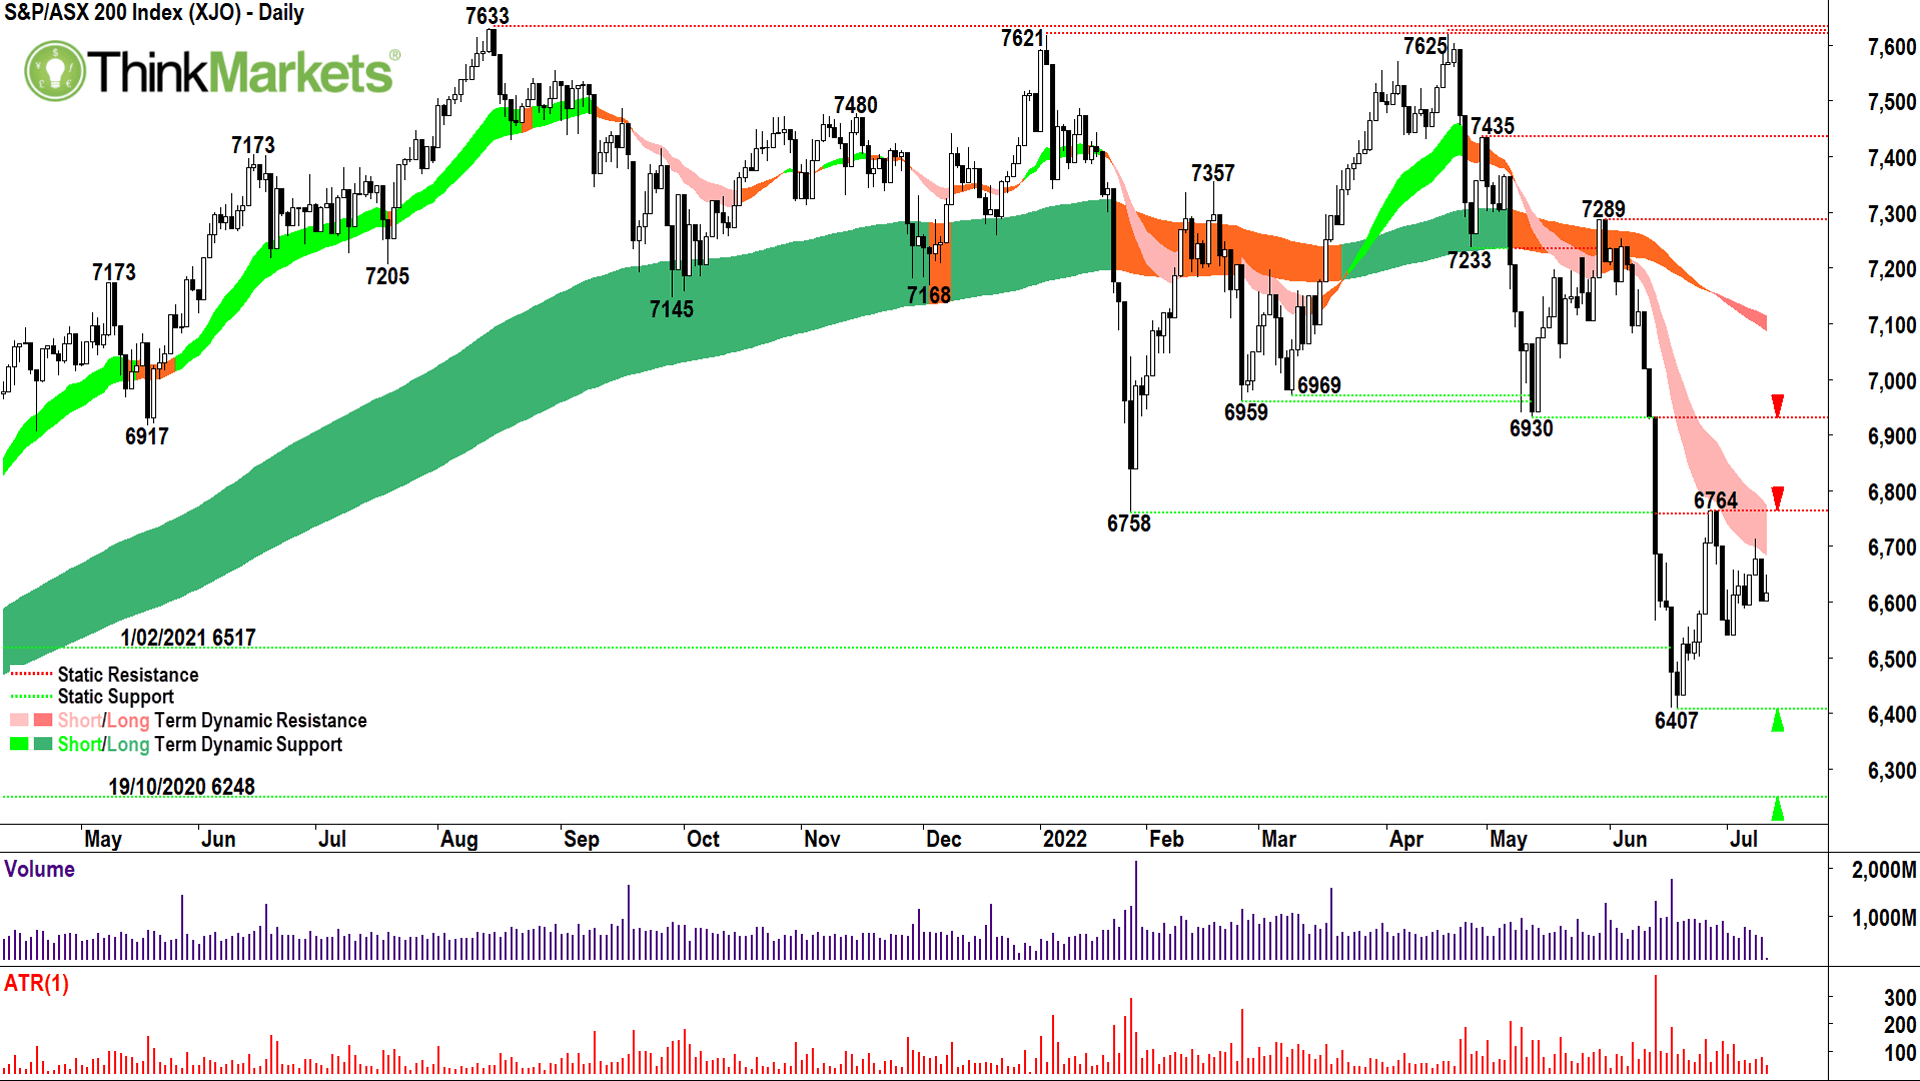
As I write this candle – halfway through Tuesday’s session – I am both surprised at how strong the XJO is today, but also not surprised by the underlying weakness in the Materials sector.
Commodity prices such as copper, nickel, and iron ore remain under pressure, and each of these trends are now well entrenched to the downside. I can see some strength in the Financials sector as fund managers who must remain fully invested switch out of recession-vulnerable Materials plays into the perceived relative safety of the Financials.
The financials have such a huge weighting in our index that net-net we’re up some points by mid-mark Tuesday.
Because this strategy is only likely to last so long if recession fears overtake hopes of a soft landing. Nowhere will be safe to hide…
Either way, the short-term downtrend ribbon is all powerful once again. Until we get decisively above that pesky pink zone of supply, there’s not a great deal more I can say apart from: Beware sucker rallies in a long-term downtrend!
For your reference, the top of the pink zone is 6785. A close above this would also take out the static supply point at 6764 which is a bonus.
Ideally though, 6930 is reclaimed before we can even contemplate the bear market low is in.
View: Bearish, continue to sell rallies until a close above 6930.
It’s time for a cup of tea. After our intermission – with Gwen Stefani (ft: Eve) – for your sheer charting pleasure, two charts which look like going higher, two which look like going lower, and all four which no doubt the market is going to make a lot of monkey – I mean money – out of someone by the next Candlestick!
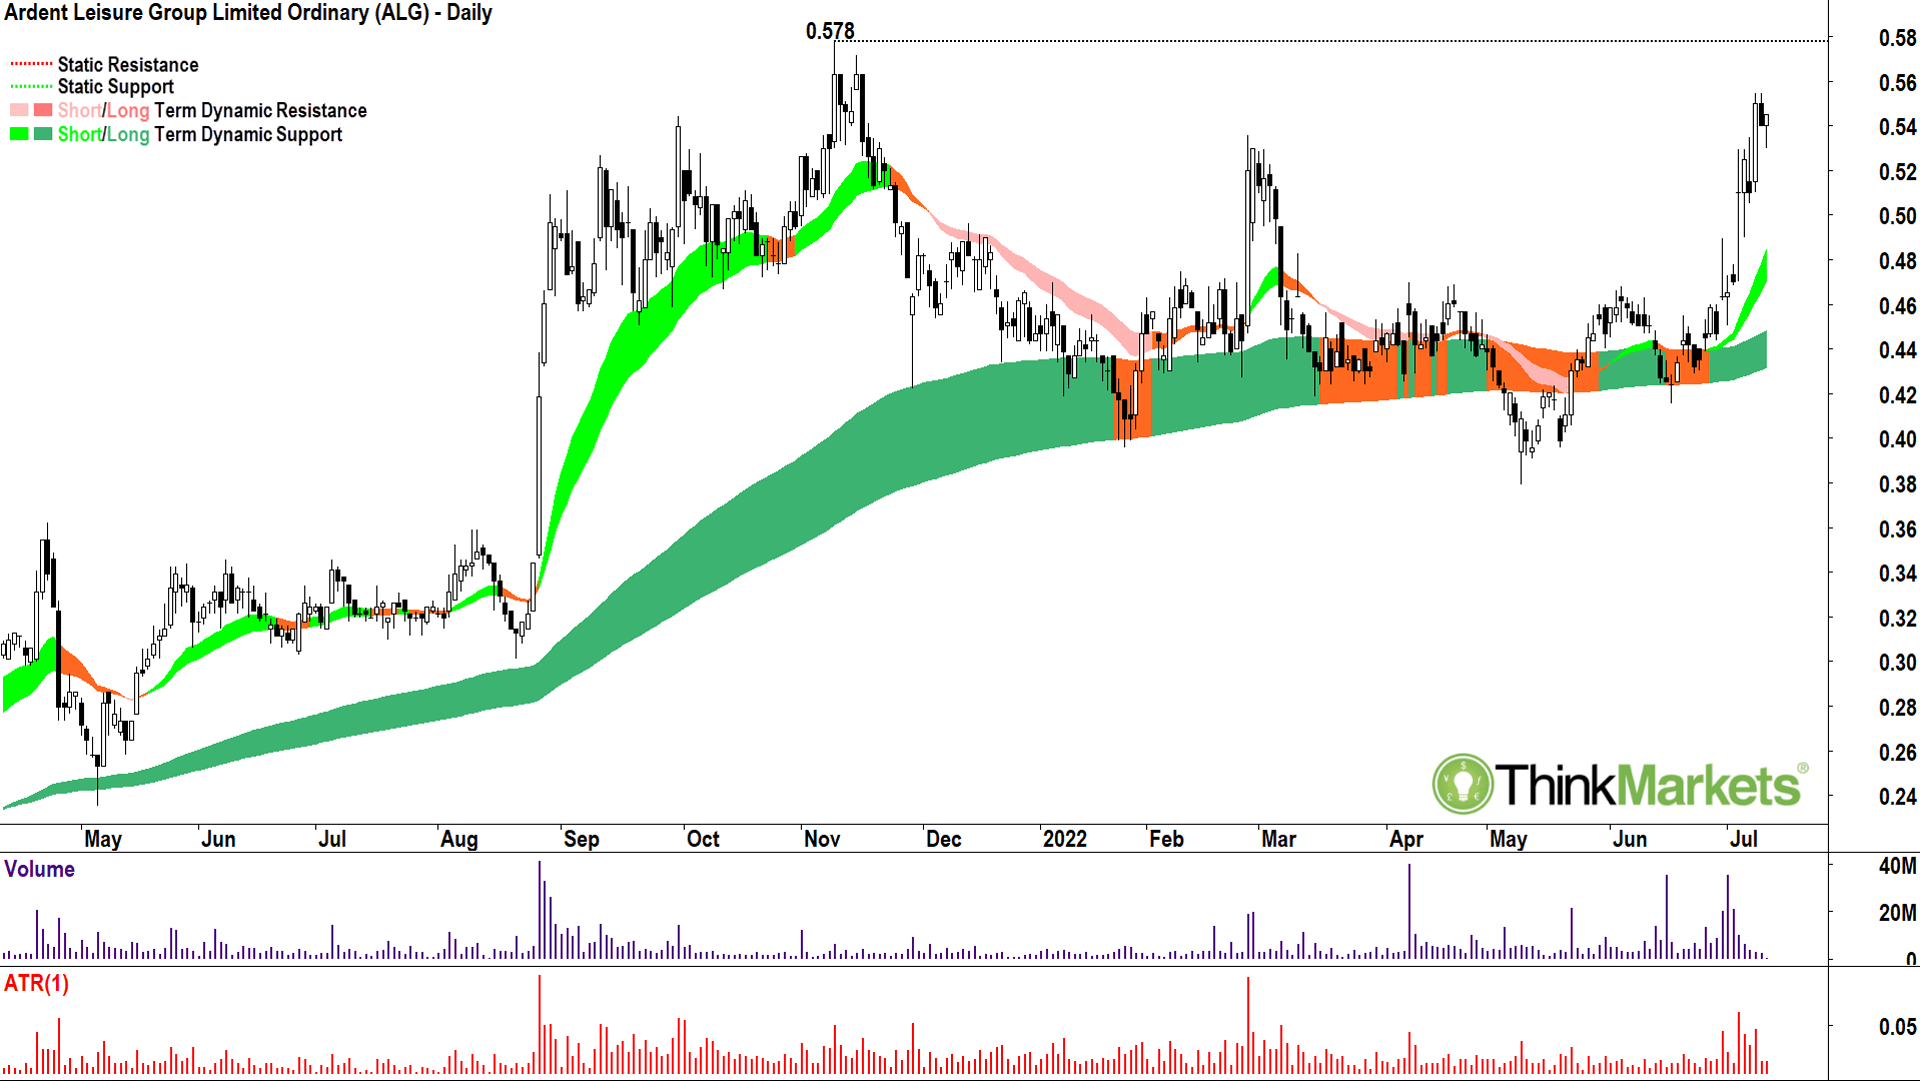
This is something I’m not going to say very often in this edition: short-term uptrend ribbon (light green zone), long-term uptrend ribbon (dark green zone), demand-side candles (large white and or lower shadows), higher peaks and troughs. Tick, tick, tick, tick. Would I buy Ardent Leisure Group (ASX:ALG) right now?
Yeah, I could add some here. I’d prefer, however, a pullback to the short-term uptrend ribbon first which sits around 0.49-0.50. If I see a nice demand-side candle in there, I’d happily buy/add some more.
View: Bullish, buy pullbacks until a close below the 17 June low of 0.415.
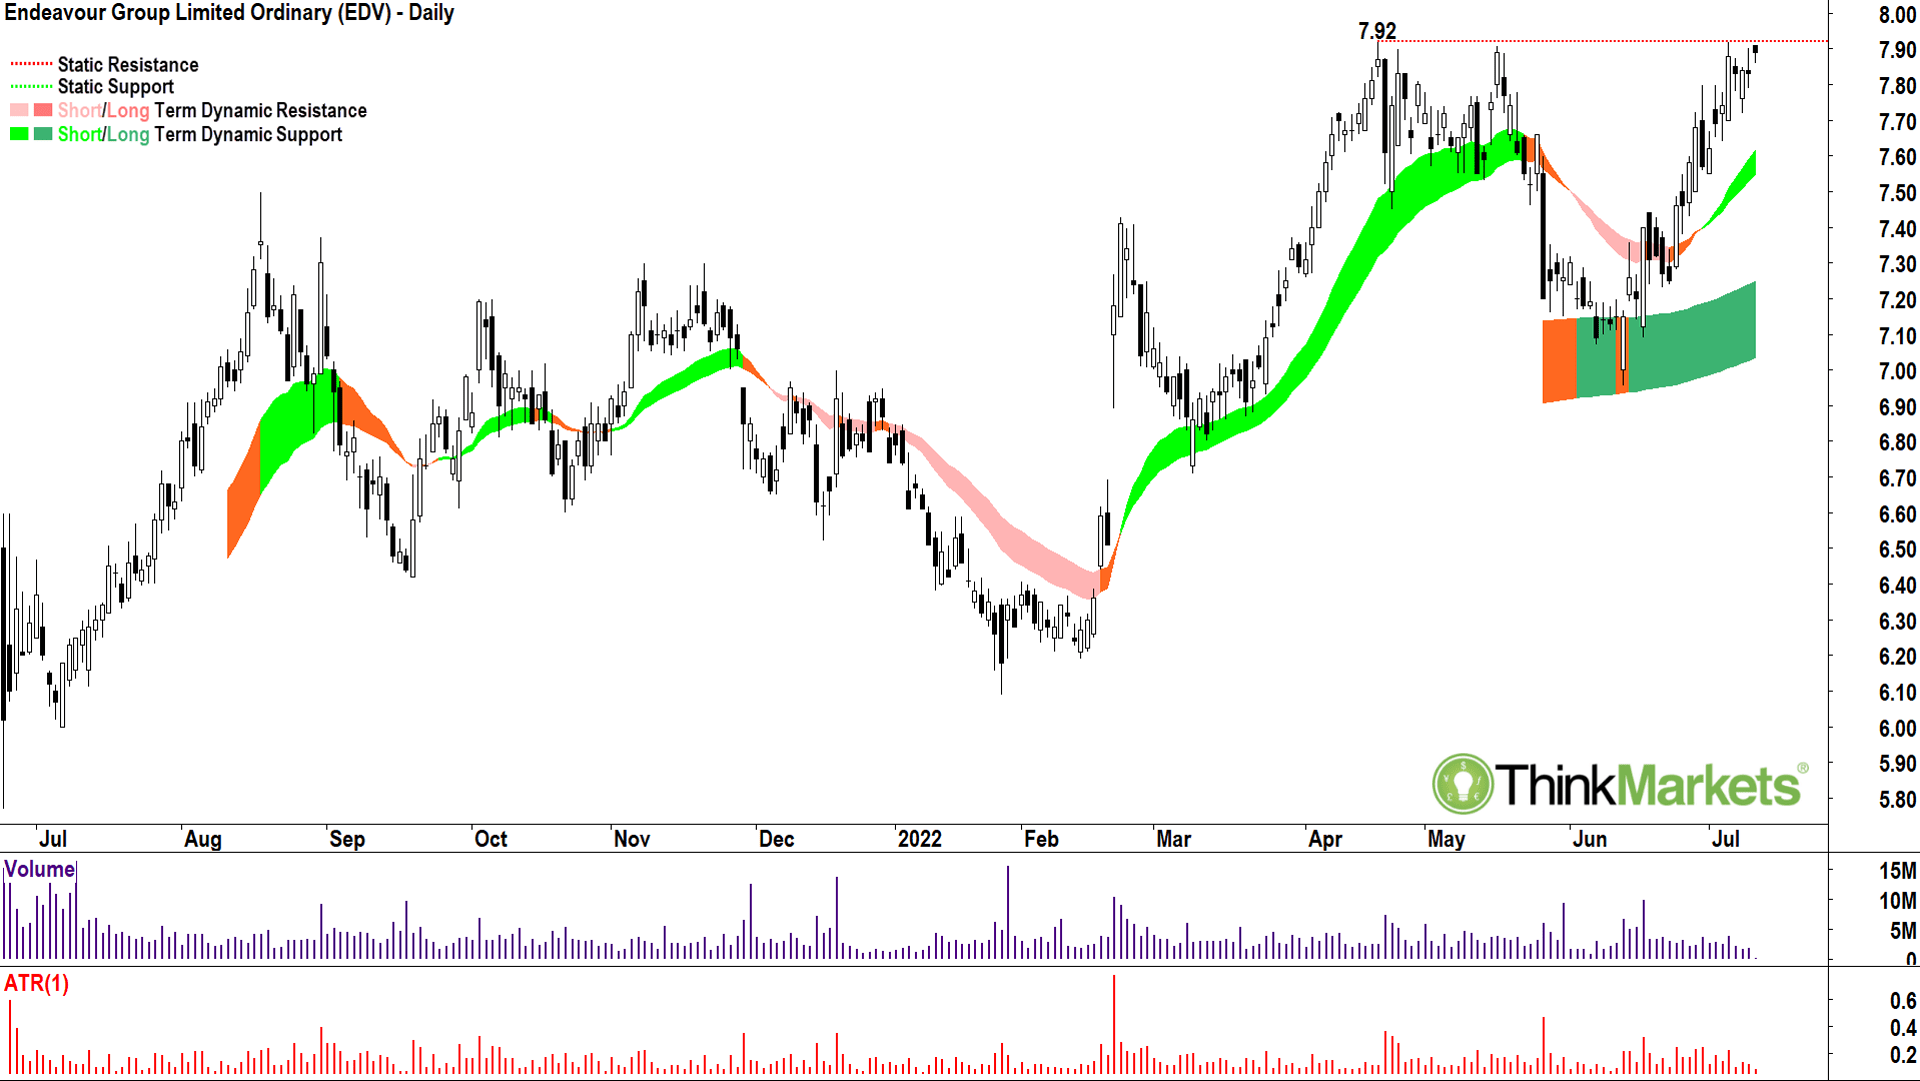
Ditto on the Endeavour Group (ASX:EDV) technicals! Just look at all those wonderful white candles!
The fact it’s done so well while the rest of the market has struggled is a clear sign it is on the “accumulate” list of many cashed up fund managers.
Think about how you get a white candle. You open low and close high.
As the XJO price has unravelled over the last few months, there have been many opportunities for EDV (and everything else) to open lower. Doom, gloom, pessimism, inflation, recession… blah blah blah.
EDV opens low, then the buying comes in (because when it comes to EDV the fund managers don’t care about all that negative stuff), and EDV closes higher on the day. Compare this to the tsunami of black candles on the stocks in your portfolio! (OK, that was a cheap shot!)
EDV has what I call “relative strength versus the index”.
It can be measured using the “Relative Strength Comparative” or RSC indicator, using EDV as the base security and the XJO as the comparison security. (Note, RSC is not to be confused with the popular Relative Strength Index or RSI!).
Outperformance versus a benchmark index is an important part of the broader technical puzzle, and it’s especially gold in a bear market. I always check a stock’s RSC before recommending it to clients!
View: Bullish, buy pullbacks until a close below the 20 June high of 7.44.
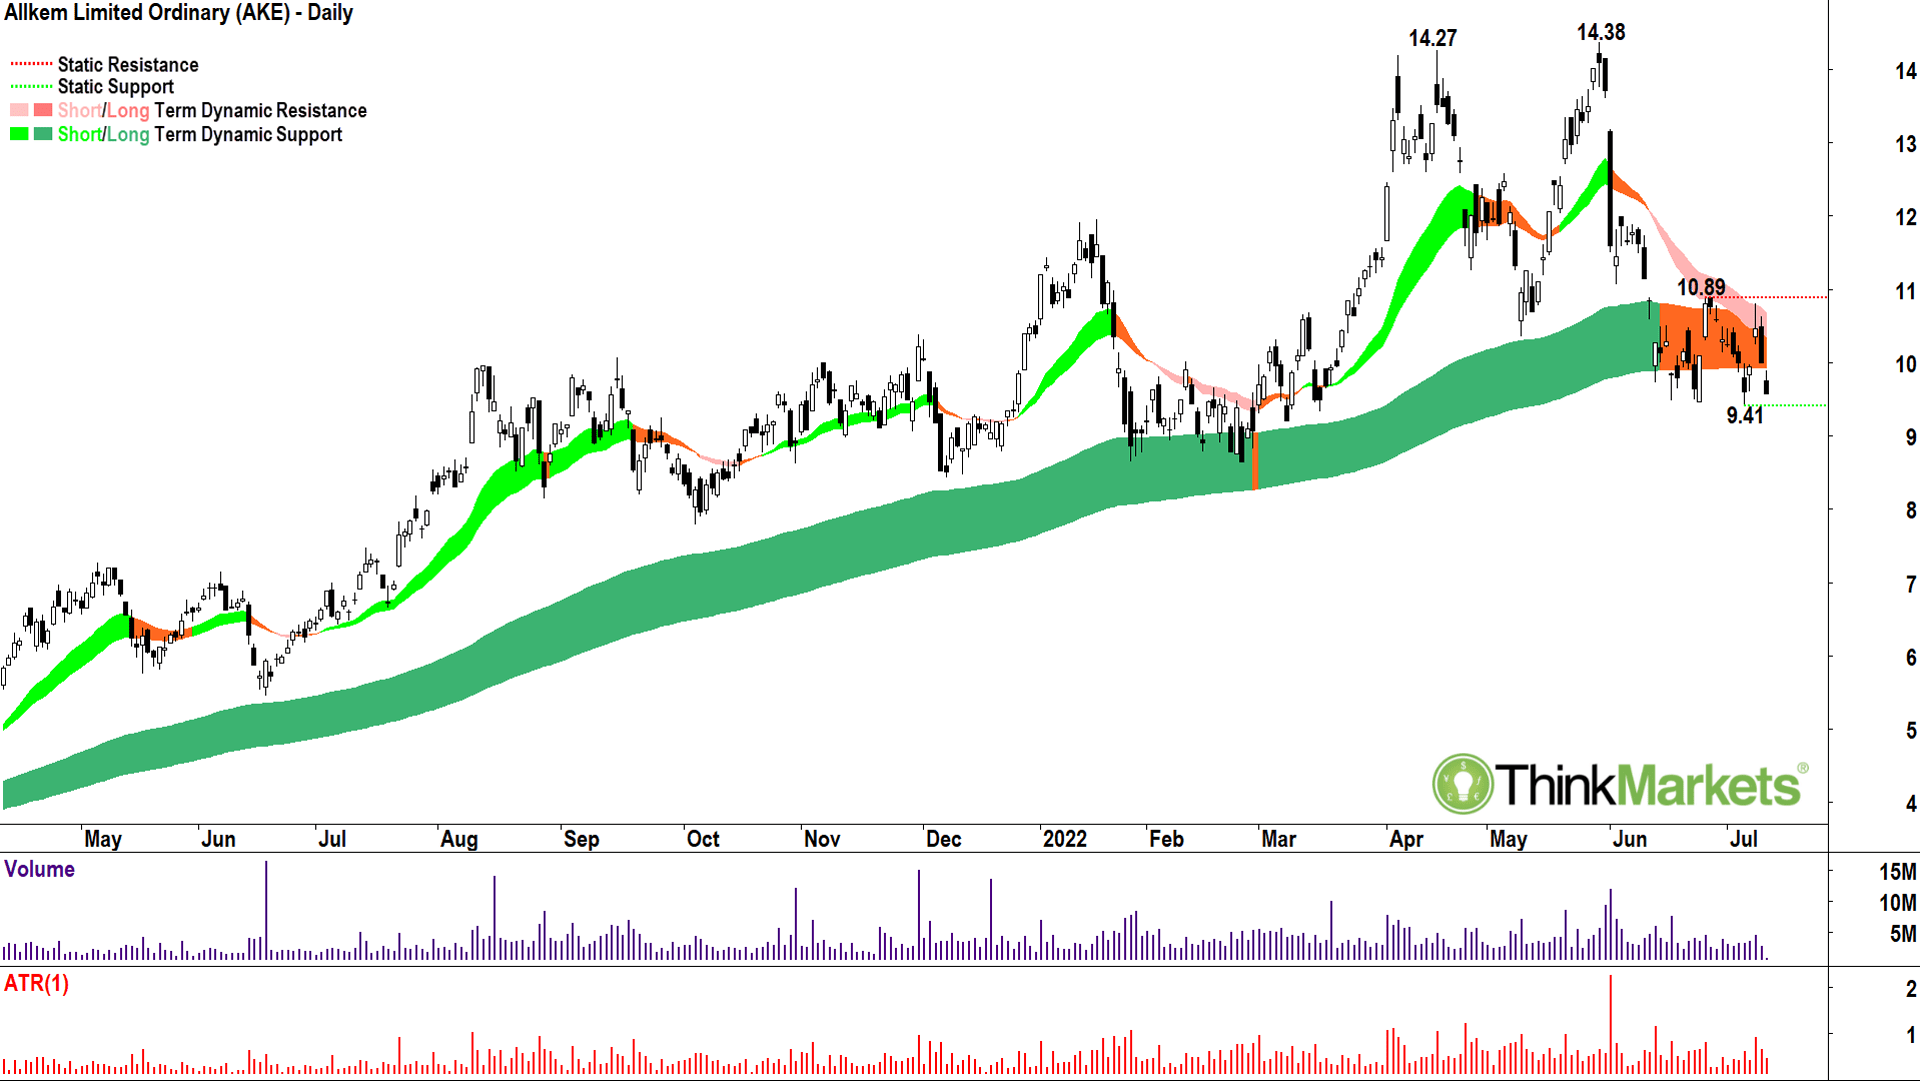
I’ve been warning investors in the resources sector for a couple of months now the trends have been changing.
Allkem (ASX:AKE) has held up better than many, but the chart above clearly shows the tell-tale signs of trend change.
The bull market in AKE is clearly over as the short-term downtrend ribbon is now well-established, the long-term trend ribbon (orange zone) has flattened, and the price action has failed to quickly close back above the long-term trend ribbon.
Indeed, it looks like the long-term trend ribbon has made that decisive switch from offering dynamic support (as it did during the bull phase), to now offering dynamic resistance (a characteristic of a bear phase). The candles are now skewed to the supply-side, and a break of static support at the 6 July low of 9.41 is all that’s required to seal the deal on a new bear market in AKE.
View: Bearish, sell rallies until a close above the 26 June high of 10.89.
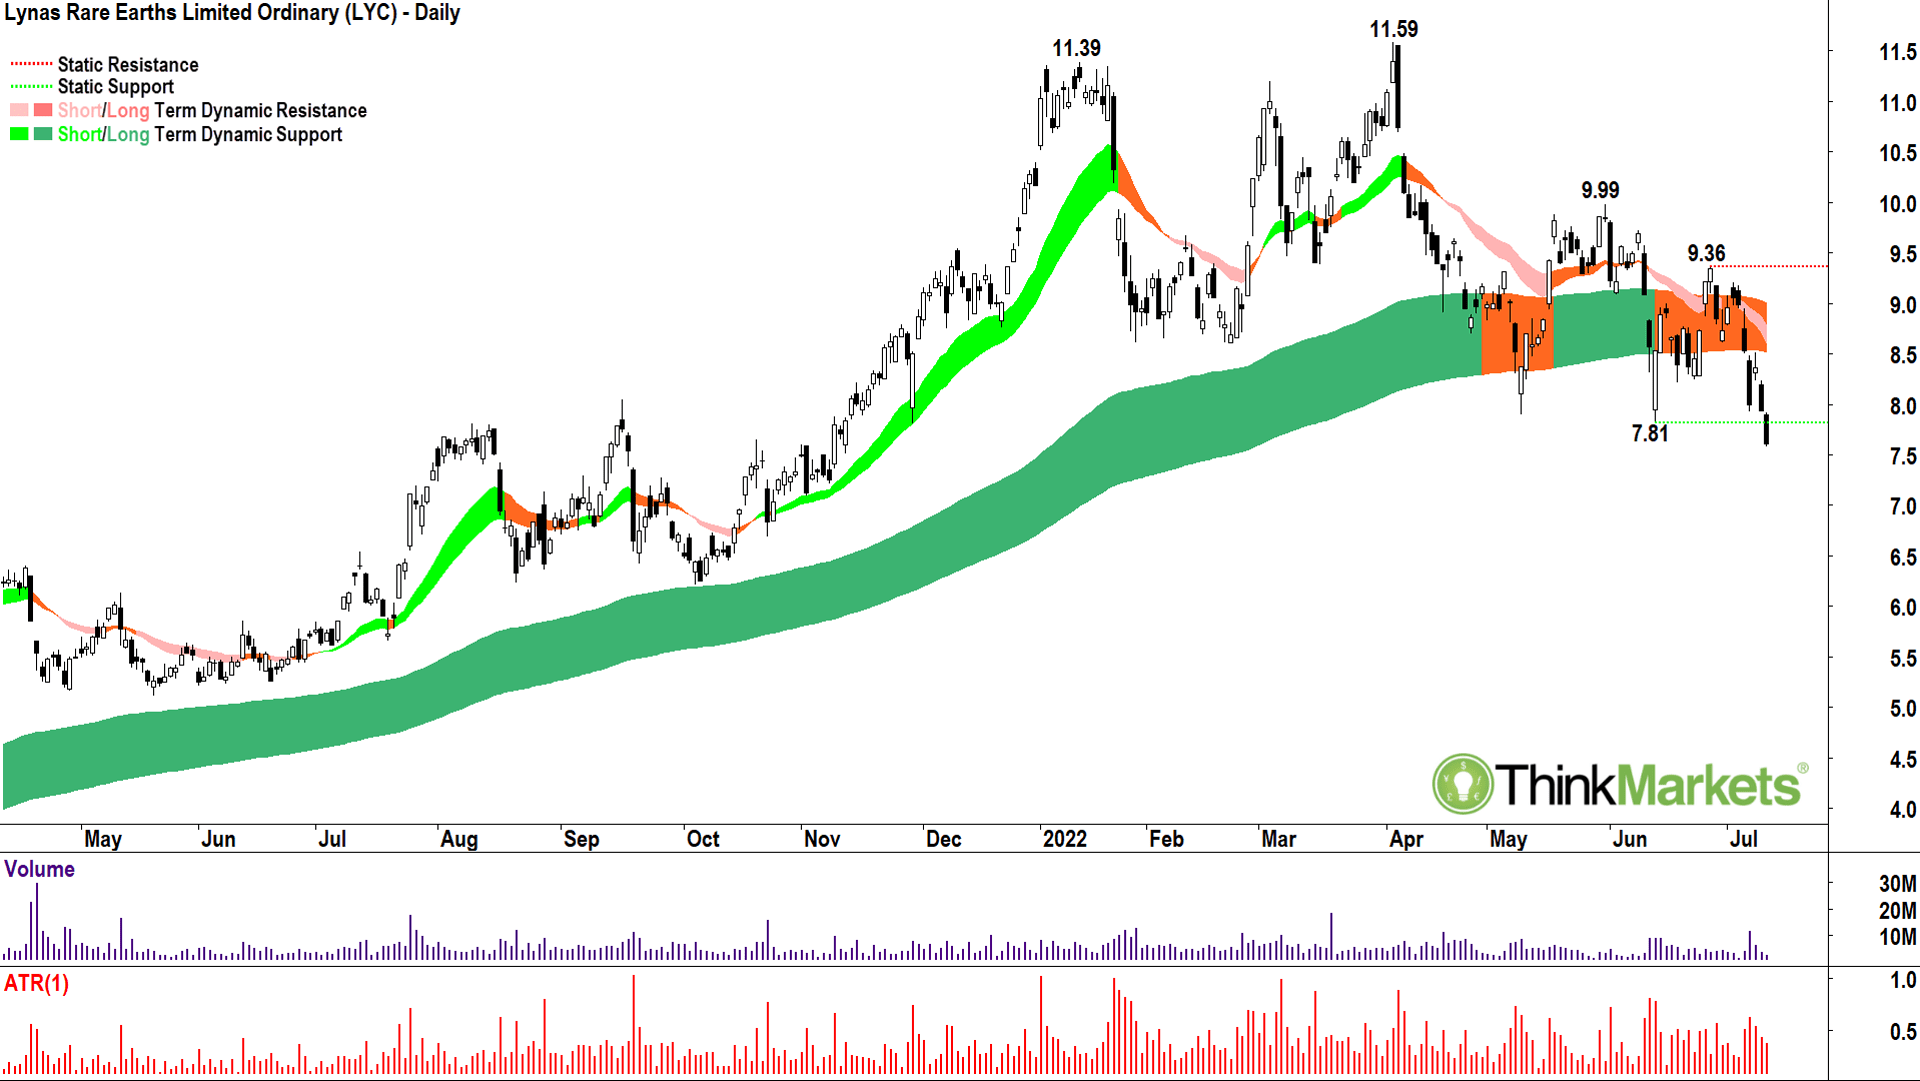
Ditto on Lynas Rare Earths’ (ASX:LYC) technicals.
The above chart has trend change written all over it! It’s another I’ve been warning investors about for some time now, the tide has turned. Come to think of it, that’s actually a good analogy. Tides go in, tides go out, uptrends turn into downtrends, bulls turn into bears… you get the picture. Just like there’s no point fighting the tide, there’s no point fighting the downtrend.
Tuesday’s crack of 7.81, if it holds, is the death-knell here.
Sure, the narrative is good for stocks like LYC and AKE, an no doubt you’ll be able to tell me all about how they’re going to be at the forefront of the EV revolution. Maybe, maybe it doesn’t matter. Anyways, you keep telling yourself whatever makes you feel better, my tip is the chart says the price is heading south.
View: Bearish, sell rallies until a close above the 28 June high of 9.36.
It’s the end. Until next week,
Candle-out.
The views, information, or opinions expressed in the interviews in this article are solely those of the interviewees and do not represent the views of Stockhead. Stockhead does not provide, endorse or otherwise assume responsibility for any financial product advice contained in this article.
Mining
Mining
Mining


Get the latest Stockhead news delivered free to your inbox.


