
Pic: Stevica Mrdja / EyeEm / EyeEm via Getty Images
Guy on Rocks: Stagflation, show-stealing Bitcoin ETFs and something to Marvel at
Experts
Pic: Stevica Mrdja / EyeEm / EyeEm via Getty Images
Experts
‘Guy on Rocks’ is a Stockhead series looking at the significant happenings of the resources market each week. Former geologist and experienced stockbroker Guy Le Page, director, and responsible executive at Perth-based financial services provider RM Corporate Finance, shares his high conviction views on the market and his “hot stocks to watch”.
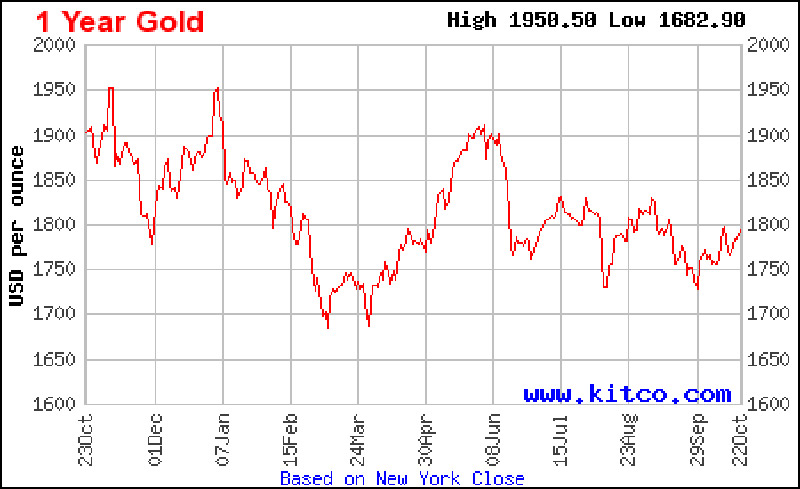
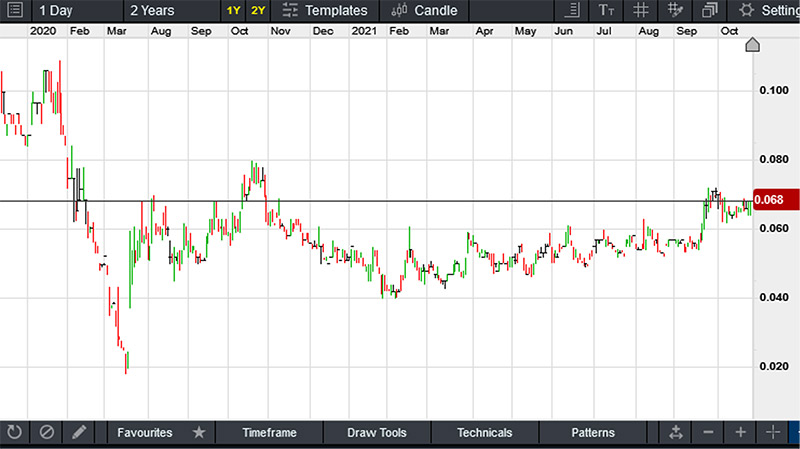
Friday saw gold prices reach six-week highs of US$1,814/ounce before closing at US$1,793/oz (figure 1), up 1.5% for the week as rising inflation pressures pushed five-year US treasuries higher.
The rapid fall in the gold price came shortly after Federal Reserve Chair Jerome Powell tried to talk down the rising inflation threat.
Powell continued to reinforce that the Fed was on track to reduce its monthly bond purchase before the end of the year and ending in mid-2022.
I consider that the rise in yields is more likely a reflection of rising inflationary expectations while the economic outlook, hampered by rising input costs, looks subdued.
Sounds like stagflation to me but what would I know?
Some important economic news due out this week with October US consumer confidence data and new home sales numbers for September.
On Wednesday, the durable goods report will provide an indication as to the status of US manufacturing.
This will be followed by third-quarter US GDP. Analysts have said that any miss in this report could be good for gold as it would raise further fears of stagflation.
This week will end with the release of October inflation data and personal consumption and income numbers.
While the macro theme looks favourable for gold, the big question is will Bitcoin (now at US$61,000 after hitting a new record US$65,000) steal the limelight, with the new Bitcoin exchange-traded product (ETF) providing a more accessible avenue for investment.
One of the big drivers of inflation is clearly oil which is sitting at US$83/bb (WTI) so if it tops US$100/bbl, as many commentators are projecting, this will have an immediate flow-on effect to base metal and steel prices as production, refinery and smelting costs rise.
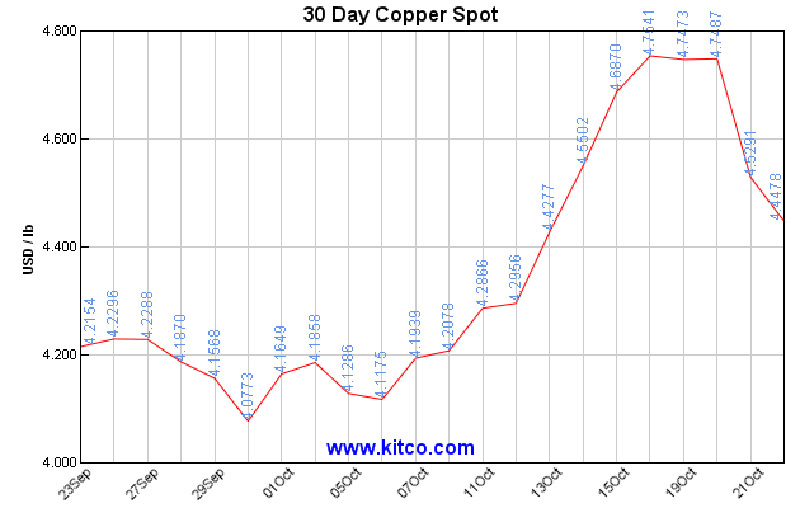
A wild two weeks for copper which hit US$4.75/lb at the LME on Wednesday (figure 2).
After a 12% rally last week the red metal corrected down 6% closing at US$4.43/lb with the three-month forward into backwardation.
Inventories are currently at 23-year lows with almost no copper under warrant, suggesting a classic short squeeze with traders hoarding copper (despite claiming they are moving warehoused copper to end-users!).
On Thursday the LME announced what appears to be a temporary amendment to the lending rules for copper, implementing a backwardation limit and giving participants the option of deferring physical deliveries against short positions.
The spread is now limited to a backwardation of 0.5% of the previous day’s cash price and those unable to fulfil their delivery obligations or borrow metal at a lesser backwardation will have their delivery deferred by the exchange.
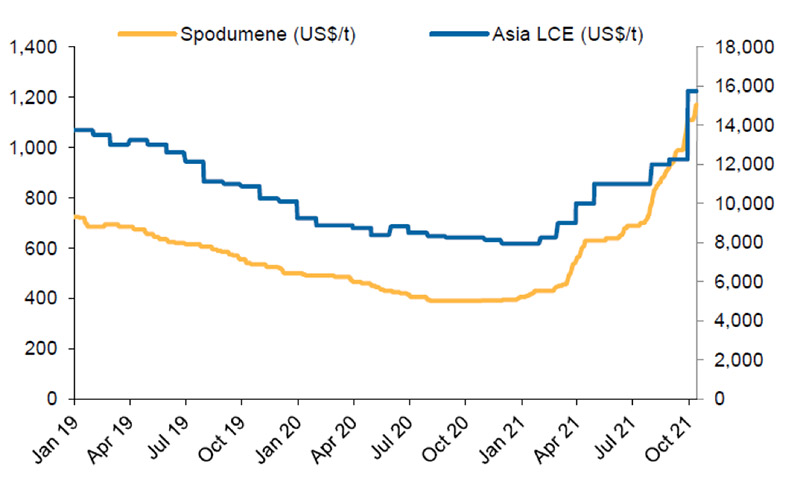
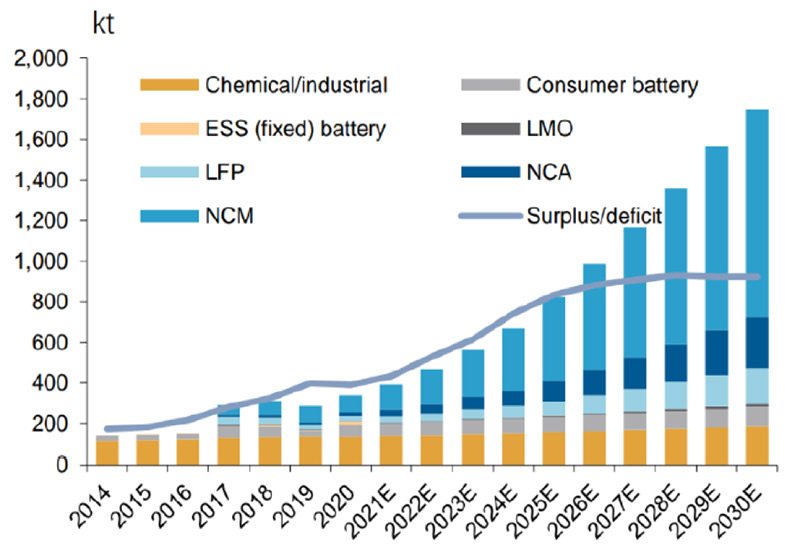
Finally, everyone is talking about the strong performance of spodumene v carbonate lithium which has had a stellar 2021 (figure 3) with lithium supply likely to move into deficit by 2025 based on current development plans.
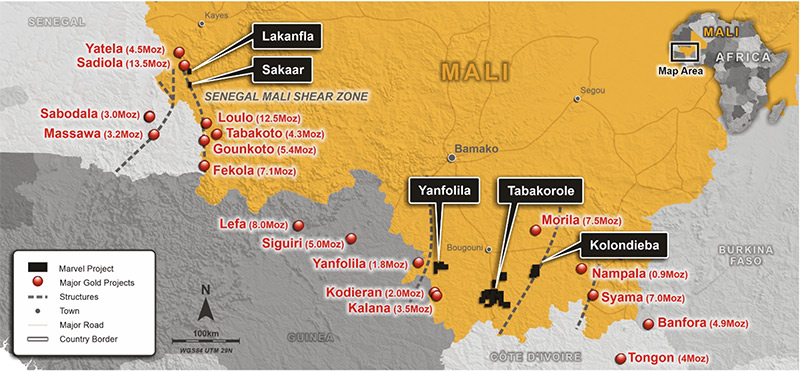
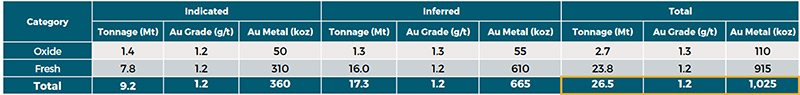
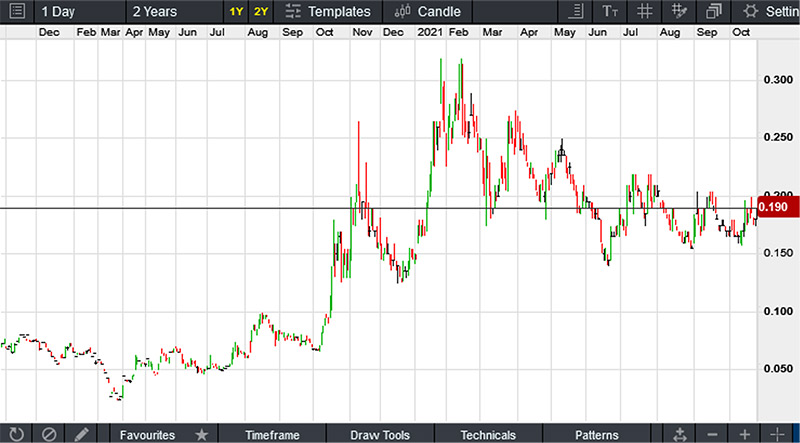
Gold explorer Marvel Gold (ASX:MVL) (figure 5) has a suite of gold exploration projects in Mali (figure 6) with total JORC Resources of 26.5Mt @ 1.2g/t gold for just over 1Moz (table 1).
Around 70% of the mineralisation is in the top 150 metres with the project having a potentially low strip ratio.
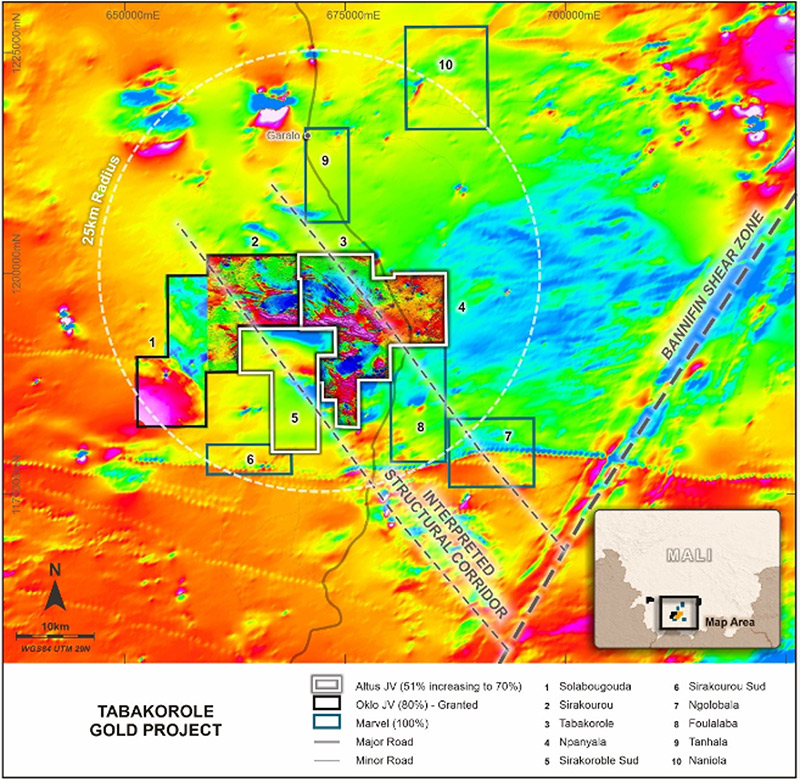
A major drilling program is scheduled for Q4 2021 with plenty of targets giving rise to a high probability of exploration success and further increases to the resource inventory (figure 7).
The project will need a substantial JORC Reserve (+1Moz) with hopefully a high-grade core >1.4g/t to get over the line given the location and jurisdictional risk, so there is some way to go.
This explains why the company is trading at around $30/oz JORC Resource.
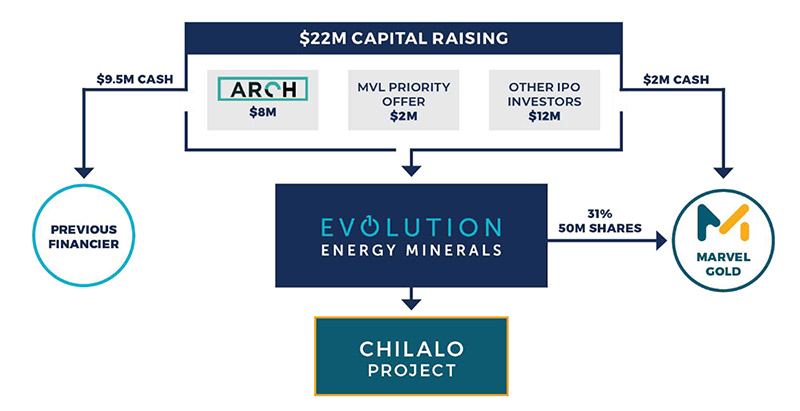
The company is also in the process of spinning out Evolution Energy Minerals (ASX:EV1) (figure 8) which owns the Chilalo Graphite project (JORC Reserve 9.2Mt @ 9.9% TGC for 878 tonnes of contained graphite) in Tanzania.
The deal is worth around 2 cents per share to MVL shareholders ($2.0 million in cash and $10.0m in EV1 shares), with the EV1 shares to be distributed to MVL shareholders post-listing.
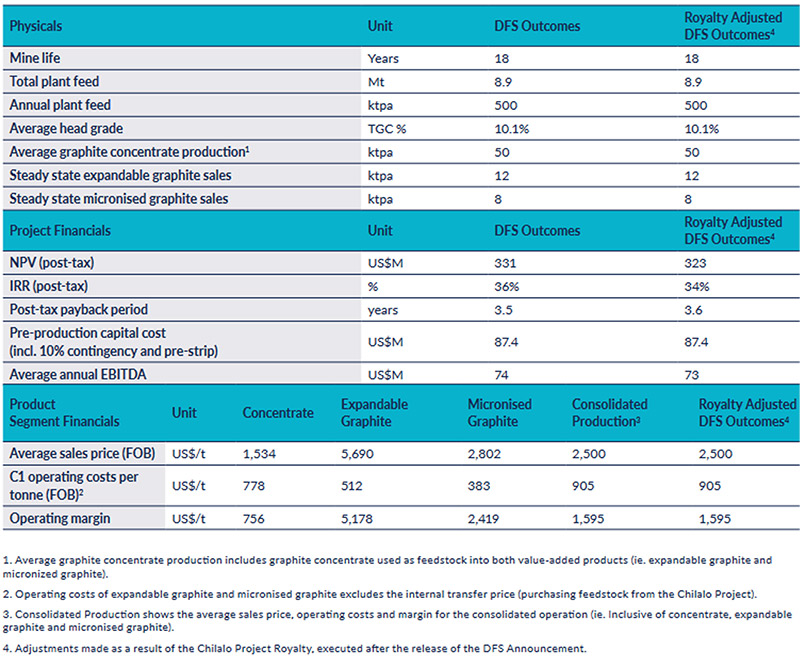
The revised financial metrics (table 2) look reasonably solid with a headline capital cost of just under US$90 million and a post-tax NPV8 of US$323 million based on an 18-year mine life producing 12,000 tonnes of expandable graphite and 8,000 tonnes of micronised graphite, and assuming a Free on Board (“FOB”) concentrate price of US$1,534/tonne.
It would have made more sense to raise equity and debt sufficient to see the company into production as they will be cum raise at listing — unless they have a funding party lined up.
I first covered Auroch Minerals (ASX:AOU) (figure 9) late last year when it was trading around 7 cents based on some nickel exploration success it was having at the Horn Project near Leinster, including 14.66 metres @ 2.19% Ni and 0.48% Cu from 132.6 metres downhole.
More recently, it has been aggressively exploring the Nepean Project completing detailed geophysical surveys together with around 6,000m of RC and diamond drilling within and adjacent to existing resources.
Aside from some impressive intersections, AOU have demonstrated the prospectivity along 10km of strike.
Diamond drilling is currently ongoing and is currently testing down-plunge extensions to what is interpreted to be high-grade nickel sulphide mineralisation beneath the Nepean mine. Additional diamond drilling is also testing 700m of potentially lithium-bearing pegmatite that has been recently identified at the project.
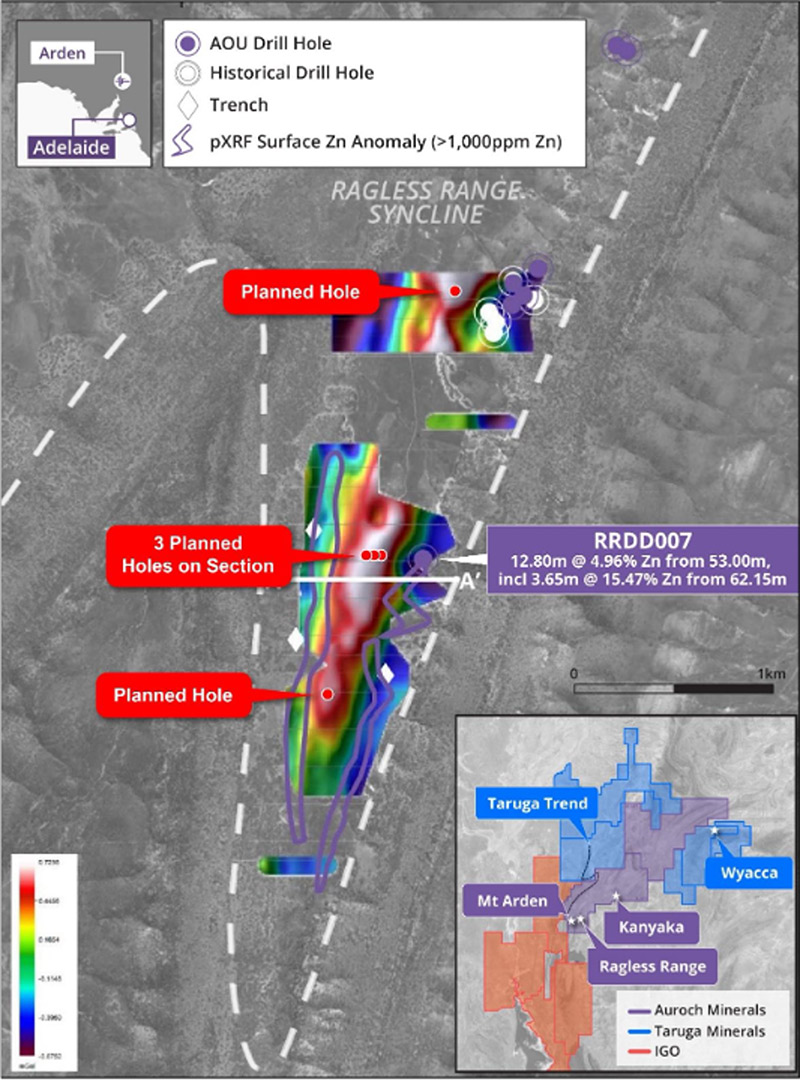
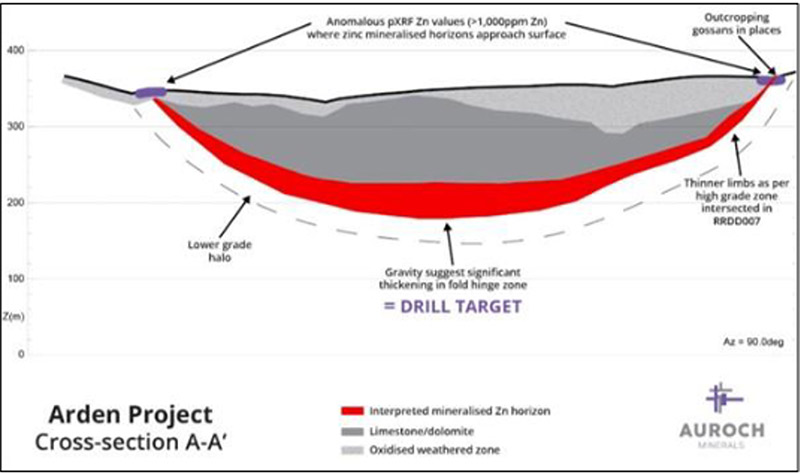
With zinc having a strong run, investor interest is now focussed on the upcoming diamond drilling program at its 90% owned Ragless Range Zinc Target (part of the Arden Project) situated 315km north of Adelaide in South Australia (figure 10 and 11).
South Australia is the state in the middle of the country that derives its revenue from agriculture, wine, Olympic Dam and making movies about mass murders so a new zinc mine would be very welcome indeed.
The company is planning a three-to-five-hole diamond program to test for Sedimentary Exhalative (SEDEX) zinc mineralisation that was intersected in 2018 including RRDD007 which returned 12.8m @ 4.96% Zn from 53m downhole.
Mineralisation was found to be associated with smithsonite (ZnCO3), an oxide mineral often found around SEDEX deposits and this program will test a 2-kilometre-long gravity anomaly (figure 11) which could be indicative of higher density zinc mineralisation.
Shareholders have been well rewarded in the last 12 months, and at an enterprise value of just over $50 million there could be more to come.
At RM Corporate Finance, Guy Le Page is involved in a range of corporate initiatives from mergers and acquisitions, initial public offerings to valuations, consulting, and corporate advisory roles.
He was head of research at Morgan Stockbroking Limited (Perth) prior to joining Tolhurst Noall as a Corporate Advisor in July 1998. Prior to entering the stockbroking industry, he spent 10 years as an exploration and mining geologist in Australia, Canada, and the United States. The views, information, or opinions expressed in the interview in this article are solely those of the interviewee and do not represent the views of Stockhead.


Get the latest Stockhead news delivered free to your inbox.