Pic: Schroptschop / E+ via Getty Images
High Voltage: We need to build 20 large lithium mines by 2030 to hit Paris targets
Mining
Pic: Schroptschop / E+ via Getty Images
Mining
Our High Voltage column wraps all the news driving ASX stocks with exposure to lithium, cobalt, graphite, nickel, rare earths, and vanadium.
These are latest forecasts for metals demand in two scenarios: WoodMac’s base case forecast, in blue, and a Paris-aligned scenario on track to limit global warming to less than 2 degrees, in green:
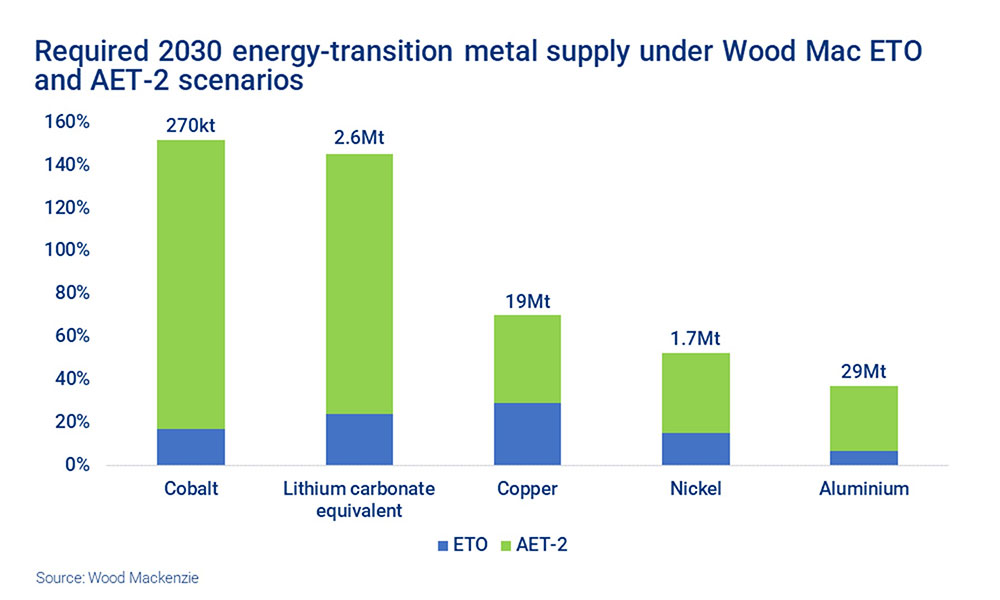
The difference is enormous, WoodMac’s Ed Crooks says.
“To meet that demand for lithium, for example, in the Paris-aligned scenario, by 2030 we would need 20 more mines the size of Greenbushes in Western Australia, currently the world’s largest,” he says.
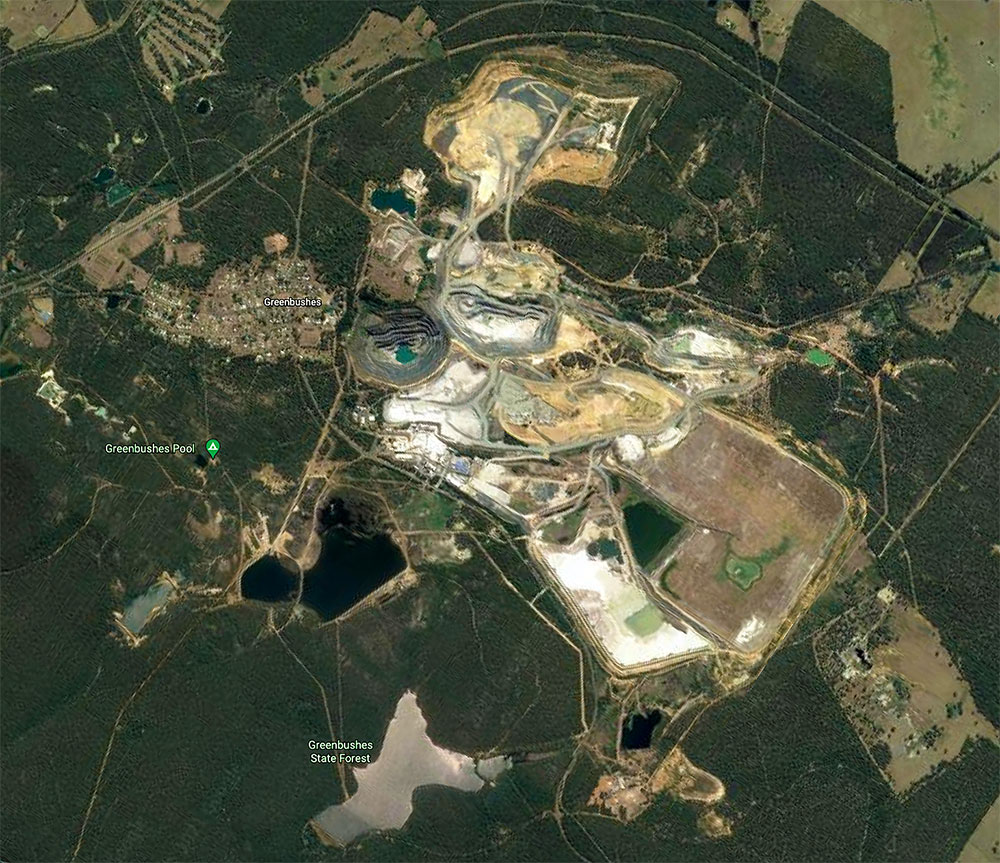
Twenty additional world class mines in less than a decade. The process from exploration, through to resource definition and mining studies, financing and construction takes five years at the very least.
WoodMac is sceptical it can be achieved.
As Julian put it: “Absent a sea change in policy, capital allocation, and attitude to risk, delivering the 2030 metal requirements to stay on course for net zero by 2050 would be truly incredible.” (6/6)
— Ed Crooks (@Ed_Crooks) November 22, 2021
They aren’t the only ones. Last week, Benchmark Mineral Intelligence noted that a Glasgow climate conference declaration to phase out sales of petrol and diesel vehicles by 2040 would mean a +3000% increase in annual electric vehicle battery demand.
That’s 7 million tonnes of lithium (LCE) annually, which is 17 times more than lithium chemical production in 2021, and ~5 million tonnes of nickel sulphate, 19 times more than nickel sulphate production in 2021.
‘Solid state’ technology promises a battery that is higher capacity, higher density, higher performance, non-flammable, and quicker to charge – almost comparable to filling a car with fuel. It also doesn’t require cobalt.
However, most electric vehicles (EV) are unlikely to use more powerful solid-state and lithium metal batteries this decade as the tech will struggle to compete on costs, according to Benchmark.
“Lithium metal battery production capacity is set to reach 260 GWh by 2030, based on the current pipeline, as startups commercialise next generation technologies,” it says.
“But that won’t be enough to push costs below conventional lithium-ion batteries used in EVs.
“Unless solid-state can achieve cost parity, the promised benefits may not be sufficient for a technology shift in the mass-market electric vehicle segment.”
Here’s how a basket of ASX stocks with exposure to lithium, cobalt, graphite, nickel, rare earths and vanadium are performing>>>
| CODE | COMPANY | 1 WEEK RETURN % | 1 MONTH RETURN % | 6 MONTH RETURN % | 1 YEAR RETURN % | PRICE | MARKET CAP |
|---|---|---|---|---|---|---|---|
| PSC | Prospect Resources | 28 | 53 | 331 | 452 | 0.69 | $ 289,253,386.13 |
| AVZ | AVZ Minerals | 25 | 114 | 363 | 708 | 0.695 | $ 2,140,084,832.20 |
| MLS | Metals Australia | 25 | 25 | 25 | 25 | 0.0025 | $ 13,096,393.40 |
| NIC | Nickel Mines | 21 | 26 | 39 | 34 | 1.33 | $ 3,231,812,330.54 |
| CNJ | Conico | 16 | -3 | 28 | -8 | 0.037 | $ 38,008,165.21 |
| GAL | Galileo Mining | 15 | -6 | -20 | 7 | 0.235 | $ 41,260,255.23 |
| DEV | Devex Resources | 13 | 97 | 125 | 121 | 0.63 | $ 213,625,265.36 |
| STK | Strickland Metals | 12 | -16 | 208 | -28 | 0.074 | $ 92,615,269.28 |
| GSR | Greenstone Resources | 12 | 12 | 38 | -19 | 0.029 | $ 21,710,124.60 |
| ARL | Ardea Resources | 11 | 13 | 20 | 28 | 0.55 | $ 69,017,109.50 |
| BOA | Boadicea Resources | 11 | 5 | -33 | -8 | 0.21 | $ 17,093,976.90 |
| SBR | Sabre Resources | 10 | 10 | 10 | -50 | 0.0055 | $ 9,291,225.07 |
| IXR | Ionic Rare Earths | 9 | 23 | 85 | 243 | 0.048 | $ 162,835,176.67 |
| POS | Poseidon Nick | 8 | -2 | 58 | 37 | 0.1025 | $ 337,035,547.86 |
| LYC | Lynas Rare Earths | 8 | 26 | 65 | 155 | 8.63 | $ 7,724,642,902.24 |
| VRC | Volt Resources | 8 | -13 | -30 | 180 | 0.028 | $ 71,489,983.19 |
| REE | Rarex | 8 | 10 | 24 | -14 | 0.1075 | $ 51,933,218.46 |
| LEL | Lithium Energy | 7 | 57 | 123 | 1.05 | $ 43,875,000.00 | |
| GL1 | Globallith | 7 | 62 | 178 | 0.68 | $ 65,248,287.60 | |
| MIN | Mineral Resources. | 7 | 12 | 2 | 47 | 44.02 | $ 7,937,374,368.33 |
| LTR | Liontown Resources | 7 | 4 | 355 | 691 | 1.755 | $ 3,278,528,425.13 |
| AQD | Ausquest | 7 | -6 | -24 | -11 | 0.016 | $ 13,171,037.30 |
| AR3 | Austrare | 6 | 14 | 0.92 | $ 41,648,494.11 | ||
| MRD | Mount Ridley Mines | 6 | 21 | 42 | 240 | 0.0085 | $ 45,132,273.50 |
| NVA | Nova Minerals | 5 | -2 | 9 | -32 | 0.1525 | $ 297,336,196.91 |
| GME | GME Resources | 5 | -12 | 12 | 55 | 0.065 | $ 38,015,408.77 |
| NTU | Northern Min | 5 | 39 | 94 | 106 | 0.068 | $ 339,850,557.62 |
| BEM | Blackearth Minerals | 4 | 4 | 4 | 191 | 0.125 | $ 26,630,920.21 |
| CLA | Celsius Resource | 4 | -3 | -35 | -26 | 0.028 | $ 30,369,614.35 |
| OZL | OZ Minerals | 3 | 6 | 3 | 78 | 26.355 | $ 8,648,336,900.16 |
| PLS | Pilbara Min | 3 | 21 | 134 | 342 | 2.53 | $ 7,377,970,864.96 |
| CXO | Core Lithium | 3 | -7 | 143 | 1089 | 0.5825 | $ 950,646,724.47 |
| RBX | Resource B | 3 | -5 | 444 | 444 | 0.185 | $ 7,190,565.30 |
| IGO | IGO | 3 | 8 | 42 | 116 | 10.31 | $ 7,837,721,864.55 |
| VMC | Venus Metals Cor | 3 | 15 | 15 | -19 | 0.195 | $ 29,460,343.19 |
| MLX | Metals X | 3 | 5 | 63 | 364 | 0.39 | $ 358,370,096.47 |
| CWX | Carawine Resources | 2 | -2 | -18 | -28 | 0.21 | $ 26,541,863.99 |
| EMH | European Metals Hldg | 2 | 11 | 16 | 83 | 1.46 | $ 182,128,751.00 |
| HAS | Hastings Tech Met | 2 | -6 | 55 | 96 | 0.255 | $ 443,306,261.64 |
| ORE | Orocobre | 2 | 6 | 59 | 179 | 9.74 | $ 6,081,994,090.44 |
| MOH | Moho Resources | 2 | -5 | -27 | -45 | 0.06 | $ 7,546,524.12 |
| BHP | BHP Group | 2 | 1 | -20 | 5 | 38.07 | $ 107,920,195,992.52 |
| SRL | Sunrise | 1 | -4 | -7 | -29 | 1.895 | $ 170,659,680.71 |
| PAN | Panoramic Resources | 0 | 0 | 52 | 81 | 0.235 | $ 471,710,220.92 |
| FFX | Firefinch | 1 | 7 | 51 | 379 | 0.695 | $ 661,517,327.96 |
| LPI | Lithium Pwr Int | 1 | 13 | 143 | 95 | 0.4975 | $ 169,153,376.28 |
| CTM | Centaurus Metals | 0 | -1 | 49 | 101 | 1.105 | $ 367,790,085.64 |
| AJM | Altura Mining | 0 | 0 | 0 | 0 | 0.063161 | $ 214,798,472.24 |
| LML | Lincoln Minerals | 0 | 0 | 0 | 0 | 0.008 | $ 4,599,869.49 |
| RMX | Red Mount Min | 0 | 33 | 33 | -14 | 0.012 | $ 17,573,499.62 |
| ALY | Alchemy Resource | 0 | -8 | -28 | -35 | 0.012 | $ 11,428,138.68 |
| ATM | Aneka Tambang | 0 | -6 | 3 | 3 | 1.03 | $ 1,342,758.47 |
| BRB | Breaker Res NL | 0 | 25 | 125 | 113 | 0.405 | $ 135,223,985.54 |
| SRI | Sipa Resources | 0 | -2 | -2 | -25 | 0.054 | $ 10,821,399.39 |
| NMT | Neometals | 0 | 31 | 146 | 420 | 1.135 | $ 625,149,091.44 |
| GBR | Greatbould Resources | 0 | -26 | 45 | 149 | 0.145 | $ 50,013,013.26 |
| VIA | Viagold Rare Earth | 0 | 0 | 2339 | 10426 | 2 | $ 166,624,808.00 |
| PAM | Pan Asia Metals | -1 | -12 | 308 | 229 | 0.51 | $ 36,829,322.00 |
| PLL | Piedmont Lithium Inc | -1 | 7 | 9 | 127 | 0.85 | $ 455,349,345.00 |
| SGQ | St George Min | -2 | -14 | -25 | -52 | 0.062 | $ 35,940,647.16 |
| G88 | Golden Mile Res | -2 | -6 | -18 | -9 | 0.049 | $ 8,208,879.74 |
| AUZ | Australian Mines | -2 | -10 | 25 | 35 | 0.0225 | $ 94,678,300.51 |
| S2R | S2 Resources | -2 | 147 | 33 | -17 | 0.22 | $ 71,274,971.00 |
| AXE | Archer Materials | -2 | -4 | 115 | 180 | 1.485 | $ 374,912,818.61 |
| NWC | New World Resources | -3 | -4 | -23 | 40 | 0.077 | $ 122,194,664.59 |
| WKT | Walkabout Resources | -3 | -3 | 3 | 52 | 0.19 | $ 81,417,340.23 |
| RXL | Rox Resources | -3 | -1 | -23 | -51 | 0.38 | $ 59,890,893.32 |
| CHN | Chalice Mining | -3 | 41 | 25 | 163 | 9.69 | $ 3,510,500,363.80 |
| ARR | American Rare Earths | -3 | -10 | 127 | 59 | 0.175 | $ 61,156,568.20 |
| LPD | Lepidico | -3 | 83 | 265 | 428 | 0.0475 | $ 292,300,460.17 |
| MCR | Mincor Resources NL | -3 | -7 | 30 | 26 | 1.255 | $ 605,434,200.00 |
| VUL | Vulcan Energy | -3 | -24 | 54 | 376 | 10.24 | $ 1,349,797,281.70 |
| PVW | PVW Res | -3 | 0 | 214 | 193 | 0.44 | $ 31,518,703.13 |
| AOU | Auroch Minerals | -3 | -19 | -29 | -15 | 0.145 | $ 52,818,086.40 |
| AAJ | Aruma Resources | -4 | -7 | 20 | -25 | 0.079 | $ 9,950,958.74 |
| LIT | Lithium Australia NL | -4 | 4 | 13 | 150 | 0.13 | $ 127,888,665.38 |
| INR | Ioneer | -4 | 0 | 104 | 177 | 0.6925 | $ 1,445,636,621.30 |
| MRC | Mineral Commodities | -4 | -17 | -42 | -65 | 0.12 | $ 64,198,876.08 |
| RNU | Renascor Res | -4 | -8 | 64 | 991 | 0.12 | $ 226,635,139.20 |
| PGM | Platina Resources | -4 | -9 | 12 | 52 | 0.067 | $ 28,669,234.57 |
| ESR | Estrella Res | -4 | -7 | -33 | -71 | 0.0335 | $ 38,842,443.42 |
| MMC | Mitremining | -5 | -5 | 0.21 | $ 5,958,722.00 | ||
| TON | Triton Min | -5 | 25 | -2 | -5 | 0.04 | $ 45,378,722.68 |
| FGR | First Graphene | -5 | -9 | -20 | 11 | 0.2 | $ 115,525,407.06 |
| GLN | Galan Lithium | -5 | 35 | 125 | 520 | 1.52 | $ 448,652,876.95 |
| MAN | Mandrake Res | -5 | -15 | -67 | -33 | 0.056 | $ 27,867,583.06 |
| VR8 | Vanadium Resources | -5 | -10 | 47 | 177 | 0.072 | $ 36,902,765.17 |
| LEG | Legend Mining | -5 | -31 | -53 | -48 | 0.052 | $ 140,511,921.77 |
| CHR | Charger Metals | -5 | 5 | 0.43 | $ 13,773,345.05 | ||
| AML | Aeon Metals . | -6 | -16 | -39 | -68 | 0.046 | $ 40,514,847.93 |
| BUX | Buxton Resources | -6 | 30 | -5 | 29 | 0.09 | $ 13,605,543.20 |
| PEK | Peak Resources | -6 | -15 | -28 | 45 | 0.0665 | $ 137,162,854.81 |
| IPT | Impact Minerals | -7 | 0 | -13 | -36 | 0.014 | $ 26,309,333.95 |
| ILU | Iluka Resources | -7 | -10 | 13 | 63 | 8.515 | $ 3,576,059,789.90 |
| COB | Cobalt Blue | -7 | -5 | 22 | 290 | 0.39 | $ 119,398,738.80 |
| SYR | Syrah Resources | -7 | 7 | 15 | 75 | 1.2 | $ 600,975,341.22 |
| EGR | Ecograf | -7 | -1 | 11 | 282 | 0.63 | $ 303,975,084.83 |
| SYA | Sayona Mining | -8 | -5 | 393 | 2147 | 0.1525 | $ 1,056,720,846.60 |
| JRV | Jervois Global | -8 | -10 | 13 | 110 | 0.535 | $ 849,115,070.16 |
| PUR | Pursuit Minerals | -8 | 3 | -53 | 169 | 0.035 | $ 34,669,514.89 |
| CZN | Corazon | -8 | -13 | -5 | -42 | 0.035 | $ 10,547,499.98 |
| NKL | Nickelx | -8 | -18 | -18 | 0.115 | $ 6,918,750.00 | |
| AZL | Arizona Lithium | -8 | 38 | 267 | 900 | 0.11 | $ 213,780,195.97 |
| JRL | Jindalee Resources | -8 | -1 | -9 | 194 | 2.355 | $ 135,259,915.00 |
| SLZ | Sultan Resources | -9 | -11 | -43 | -32 | 0.16 | $ 10,951,666.27 |
| MNS | Magnis Energy Tech | -9 | 60 | 112 | 242 | 0.615 | $ 475,585,652.84 |
| VML | Vital Metals | -9 | 2 | 15 | 107 | 0.06 | $ 249,928,985.04 |
| ASN | Anson Resources | -9 | 63 | 154 | 353 | 0.145 | $ 148,102,895.60 |
| EUR | European Lithium | -10 | 33 | 150 | 233 | 0.14 | $ 155,943,245.99 |
| ARN | Aldoro Resources | -10 | 13 | 43 | 191 | 0.465 | $ 40,011,115.05 |
| LOT | Lotus Resources | -10 | -3 | 64 | 233 | 0.32 | $ 305,711,940.24 |
| ESS | Essential Metals | -10 | 19 | 142 | 150 | 0.22 | $ 51,088,294.41 |
| PNN | PepinNini Minerals | -10 | 33 | 139 | 307 | 0.61 | $ 28,095,333.00 |
| TMT | Technology Metals | -11 | -13 | -1 | -21 | 0.335 | $ 64,354,599.50 |
| BKT | Black Rock Mining | -11 | -5 | 28 | 141 | 0.205 | $ 166,781,540.84 |
| HYM | Hyperion Metals | -11 | -12 | -12 | 252 | 0.88 | $ 131,816,624.00 |
| BMM | Balkanminingandmin | -12 | -31 | 0.49 | $ 15,392,500.00 | ||
| BSX | Blackstone | -12 | -12 | 51 | 57 | 0.565 | $ 213,957,517.20 |
| LKE | Lake Resources | -12 | -3 | 219 | 1409 | 0.86 | $ 1,105,887,900.39 |
| AVL | Aust Vanadium | -12 | 6 | 28 | 113 | 0.0255 | $ 85,316,636.76 |
| QEM | QEM | -12 | 19 | 13 | 169 | 0.215 | $ 23,251,783.27 |
| AGY | Argosy Minerals | -13 | 12 | 218 | 383 | 0.28 | $ 353,194,666.72 |
| PRL | Province Resources | -13 | 6 | -3 | 1337 | 0.165 | $ 186,393,868.82 |
| ADD | Adavale Resource | -13 | -22 | -53 | -2 | 0.046 | $ 16,146,881.31 |
| TKL | Traka Resources | -13 | -13 | -19 | -38 | 0.013 | $ 8,087,402.62 |
| INF | Infinity Lithium | -13 | 11 | 191 | 56 | 0.195 | $ 86,707,414.29 |
| QXR | Qx Resources | -14 | -17 | 67 | 39 | 0.025 | $ 16,959,058.03 |
| RLC | Reedy Lagoon Corp. | -14 | 59 | 153 | 291 | 0.043 | $ 23,761,151.30 |
| RFR | Rafaella Resources | -14 | -6 | -27 | -14 | 0.073 | $ 13,733,454.10 |
| ADV | Ardiden | -14 | 9 | 20 | -48 | 0.012 | $ 25,840,024.27 |
| GED | Golden Deeps | -14 | 0 | 9 | -25 | 0.012 | $ 10,086,068.72 |
| AZS | Azure Minerals | -14 | -1 | 33 | -56 | 0.36 | $ 109,956,180.96 |
| A8G | Australasian Gold | -15 | -20 | 226 | 0.555 | $ 22,718,886.52 | |
| TNG | TNG | -15 | -27 | -7 | -18 | 0.077 | $ 105,518,989.76 |
| FRS | Forrestaniaresources | -16 | -3 | 0.36 | $ 9,256,500.00 | ||
| QPM | Queensland Pacific | -17 | -17 | 82 | 456 | 0.2 | $ 257,566,494.89 |
| TLG | Talga Group | -17 | 14 | 14 | -9 | 1.73 | $ 537,803,476.04 |
| ARU | Arafura Resource | -17 | 0 | 30 | 124 | 0.215 | $ 341,091,813.04 |
| GW1 | Greenwing Resources | -18 | 53 | 48 | 123 | 0.445 | $ 50,764,288.58 |
| HNR | Hannans | -18 | 18 | 478 | 478 | 0.04 | $ 117,282,216.42 |
| HXG | Hexagon Energy | -25 | 2 | -2 | 39 | 0.086 | $ 40,141,244.43 |
| CAE | Cannindah Resources | -35 | -17 | 205 | 596 | 0.195 | $ 123,074,362.39 |
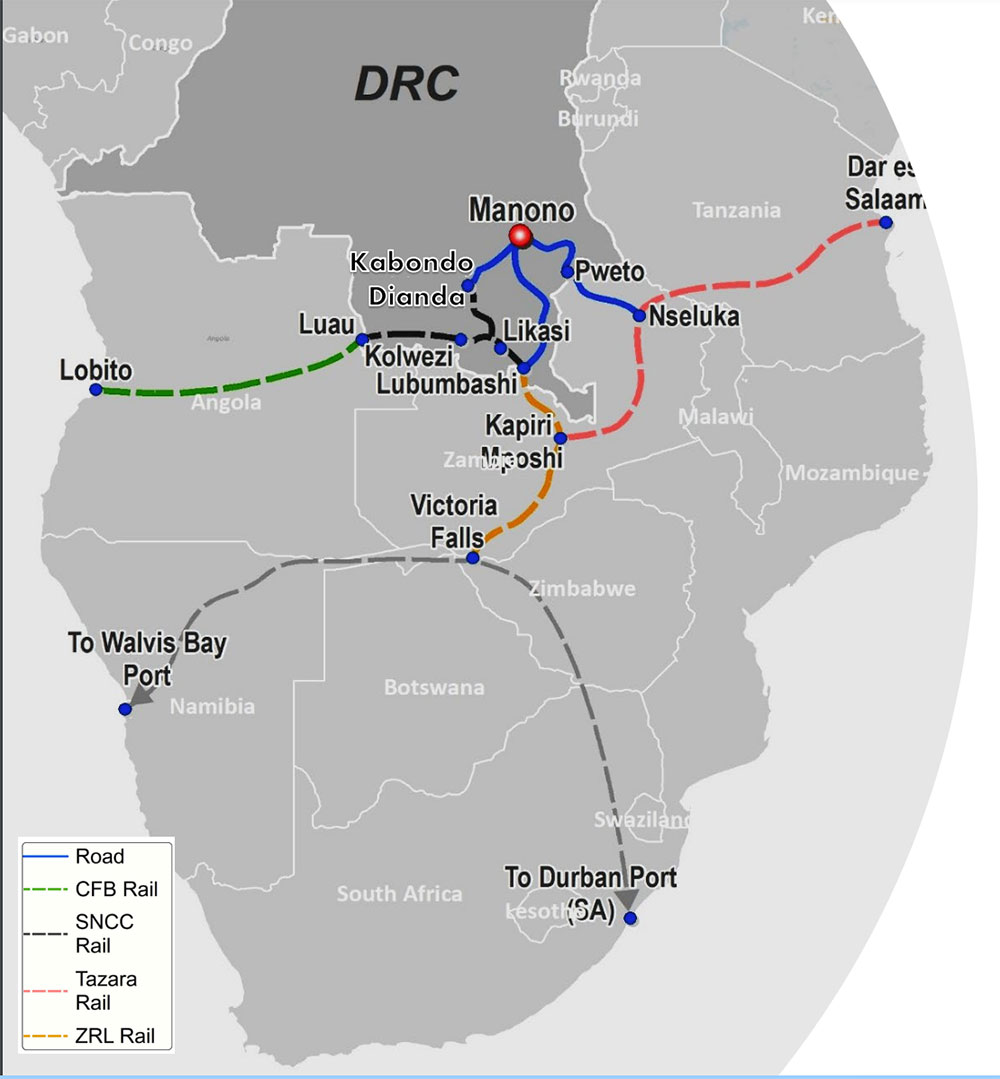
$2.24bn market cap AVZ just hit another all-time high, despite its flagship Manono lithium-tin project being in one of the most volatile mining jurisdictions in the world, the Democratic Republic of Congo.
In the last week alone gunmen allegedly kidnapped five Chinese gold miners workers in the country’s conflict-plagued east; another attack saw 12 killed in the northeastern Ituri province.
AVZ is much further south in the Tanganyika province, which “often witnesses violent clashes between its different communities, driven by social tensions and land disputes”, according to Reuters.
On top of that, there are the proposed routes to get its product from the almost landlocked country all the way to ports in Tanzania and Angola, which involves ferry, road and rail transportation:
For AVZ and its Chinese backers the world class, +30-year Manono project is a high risk, very high reward proposition.
If everything goes according to plan – which it is, so far — Manono could be one of the next globally significant lithium mining operations.
Over the past financial year, the company has locked in long-term, binding sales agreements with three major Chinese lithium converters for 80% of its spodumene production, as well as a three-year binding offtake agreement with a major participant in the tin market.
In September it secured a cornerstone investor, Suzhou CATH Energy Technologies, to underpin project development. CATH will pay US$240 million cash for a 24% equity interest in the project, with further amounts to be paid as its pro rata portion of funding to develop the mines.
From a licensing and permitting perspective, AVZ says it is confident “that our excellent relationship with the DRC Government will soon deliver our all-important Mining Licence and the other agreements”.
“The granting of our Mining Licence will facilitate the release of the updated Manono Bankable Feasibility Study (BFS) and shortly thereafter, we are expecting to announce the appointment of a Mandated Lead Arranger (MLA) to lead a syndicated debt funding facility for the Project,” AVZ chairman John Clarke says.
“Importantly, the debt component of funding will be less than 50% on the basis of the CATH transaction.
“Once the deal with CATH is finalised, the Board will be able to make a Final Investment Decision (FID) which will kick-start project construction.”


Get the latest Stockhead news delivered free to your inbox.