

Mining
Monsters of Rock: BHP's $60 billion Anglo American gambit far from a done deal

Mining
Monsters of Rock: MinRes has 'seen the bottom' in lithium prices, Lynas tightens the screws on rare earths supply

Mining

Pic: Via Getty
Mining
Our Gold Digger column wraps all the news driving ASX stocks with exposure to precious metals.
Gold prices are surging after a cool US inflation report reassured markets that the Fed could soon downshift to half-point rate hiking pace.
“It looks like the dollar died today and chaos in crypto has made good ol’ gold very attractive again,” OANDA senior markets analyst Ed Moya says.
“Gold is breaking out here and it could have a steady path towards the $1,800 level if dollar weakness remains.”
Gold miners have mirrored the uptrend. The Betashares (ASX:MNRS) and VanEck (ASX:GDX) Gold Miners ETFs are up 11.79% and 10.6% respectively over the past 5 days.
Individual miners leading the nascent recovery include Evolution Mining (ASX:EVN) +30%, Capricorn Metals (ASX:CMM) +27% and Regis Resources (ASX:RRL) +27%.
Behemoths Newcrest (ASX:NCM) and Northern Star (ASX:NST) are up 16% and 22% respectively.
All up, 149 ASX gold stocks on our list made gains over the past week. 64 were in the red and 58 were unchanged.
Earlier this week columnist Guy le Page said some of the smart money was starting to reposition in gold equities.
“… it was no surprise that we are seeing the launch of a gold fund by Perth Stockbroker Argonaut Securities which in late October announced it was seeking $50 million as a “unique counter cyclical opportunity’,” he says.
“The fund will be weighted 50% towards Australian gold stocks.”
Morgan Stanley was also seeing huge value in gold stocks prior to the current resurgence.
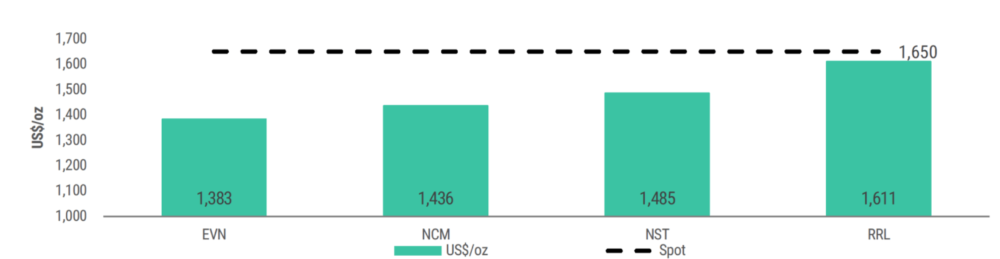
“Morgan Stanley has … demonstrated that the implied valuations of a number of the larger Australian gold producers are factoring in very low US$ gold prices (figure below) which would imply they are, in the most part, significantly undervalued or the gold price is likely to drop,” le Page says.
“Morgan Stanley clearly think the space is undervalued with valuations well below current share prices.”
Here’s how ASX-listed precious metals stocks are performing:
Scroll or swipe to reveal table. Click headings to sort. Best viewed on a laptop.
Stocks missing from this list? Email [email protected]
| CODE | COMPANY | 1 WEEK RETURN % | 1 MONTH RETURN % | 6 MONTH RETURN % | 1 YEAR RETURN % | PRICE | MARKET CAP |
|---|---|---|---|---|---|---|---|
| FML | Focus Minerals Ltd | 70% | 84% | 18% | -18% | 0.23 | $65,908,488 |
| G50 | Gold50Limited | 65% | 38% | -18% | -39% | 0.165 | $9,395,595 |
| ALY | Alchemy Resource Ltd | 55% | 55% | 143% | 292% | 0.051 | $57,480,737 |
| AQI | Alicanto Min Ltd | 47% | 29% | -40% | -63% | 0.053 | $21,868,522 |
| NMR | Native Mineral Res | 40% | 75% | 27% | -2% | 0.21 | $12,736,468 |
| MDI | Middle Island Res | 35% | 9% | -48% | -24% | 0.07 | $8,569,276 |
| AGG | AngloGold Ashanti | 34% | 19% | 0% | 4% | 5.29 | $454,959,602 |
| MZZ | Matador Mining Ltd | 33% | 14% | -45% | -68% | 0.12 | $33,097,912 |
| CTO | Citigold Corp Ltd | 33% | 33% | 33% | -16% | 0.008 | $22,669,273 |
| SBM | St Barbara Limited | 31% | -13% | -46% | -61% | 0.6225 | $456,983,321 |
| EVN | Evolution Mining Ltd | 30% | 33% | -27% | -34% | 2.6 | $4,458,841,348 |
| SFR | Sandfire Resources | 29% | 20% | -9% | -18% | 4.61 | $1,726,864,570 |
| GMN | Gold Mountain Ltd | 29% | 29% | 50% | -53% | 0.009 | $14,831,492 |
| BGD | Bartongoldholdings | 29% | 20% | -14% | -8% | 0.18 | $14,183,272 |
| CMM | Capricorn Metals | 27% | 32% | 22% | 52% | 4.34 | $1,533,093,259 |
| LCL | Los Cerros Limited | 27% | 17% | -58% | -80% | 0.028 | $16,916,870 |
| RRL | Regis Resources | 27% | 16% | 2% | -5% | 1.9 | $1,351,496,406 |
| PGO | Pacgold | 26% | -2% | -25% | 32% | 0.46 | $25,282,435 |
| DEG | De Grey Mining | 26% | 31% | 28% | 14% | 1.32 | $1,918,290,914 |
| KZR | Kalamazoo Resources | 26% | 23% | -21% | -33% | 0.245 | $30,507,972 |
| FAL | Falconmetalsltd | 25% | 15% | -24% | 0% | 0.225 | $37,170,000 |
| QML | Qmines Limited | 25% | 45% | -10% | -41% | 0.225 | $20,297,032 |
| SIH | Sihayo Gold Limited | 25% | -17% | -17% | -72% | 0.0025 | $15,255,320 |
| MTH | Mithril Resources | 25% | 11% | -29% | -71% | 0.005 | $14,701,165 |
| WGX | Westgold Resources. | 23% | 4% | -34% | -58% | 0.895 | $404,947,434 |
| GOR | Gold Road Res Ltd | 23% | 24% | 23% | 11% | 1.625 | $1,651,556,077 |
| CEL | Challenger Exp Ltd | 23% | 6% | -30% | -41% | 0.19 | $182,859,469 |
| TCG | Turaco Gold Limited | 23% | 14% | -44% | -69% | 0.049 | $19,247,250 |
| NST | Northern Star | 22% | 28% | 21% | 4% | 10.57 | $11,477,041,963 |
| TIE | Tietto Minerals | 22% | 36% | 93% | 102% | 0.83 | $863,621,992 |
| RDT | Red Dirt Metals Ltd | 21% | 9% | 60% | -20% | 0.65 | $209,619,368 |
| ADV | Ardiden Ltd | 21% | 21% | -23% | -35% | 0.0085 | $22,680,851 |
| NXM | Nexus Minerals Ltd | 21% | 5% | -30% | -60% | 0.2 | $58,581,596 |
| BGL | Bellevue Gold Ltd | 20% | 17% | 8% | -5% | 0.8975 | $890,398,251 |
| PRU | Perseus Mining Ltd | 20% | 35% | 20% | 31% | 2.15 | $2,802,159,600 |
| ARN | Aldoro Resources | 20% | 67% | 53% | -29% | 0.36 | $37,046,751 |
| EMU | EMU NL | 20% | -14% | -60% | -77% | 0.006 | $4,123,609 |
| IVR | Investigator Res Ltd | 20% | 17% | 6% | -28% | 0.055 | $69,384,310 |
| ADN | Andromeda Metals Ltd | 19% | 13% | -52% | -72% | 0.0465 | $136,840,371 |
| AM7 | Arcadia Minerals | 19% | -3% | 55% | 22% | 0.31 | $13,542,389 |
| WCN | White Cliff Min Ltd | 19% | -24% | -17% | 58% | 0.019 | $13,456,861 |
| SLR | Silver Lake Resource | 19% | 11% | -14% | -26% | 1.31 | $1,134,288,086 |
| MKR | Manuka Resources. | 19% | 10% | -27% | -58% | 0.16 | $41,472,955 |
| CHN | Chalice Mining Ltd | 18% | 27% | -18% | -44% | 4.87 | $1,700,863,317 |
| WAF | West African Res Ltd | 18% | 19% | 1% | -14% | 1.205 | $1,154,162,275 |
| KCN | Kingsgate Consolid. | 18% | 24% | 43% | 43% | 1.925 | $405,016,429 |
| CYL | Catalyst Metals | 18% | 4% | -16% | -36% | 1.3 | $127,992,992 |
| BTR | Brightstar Resources | 18% | 18% | 0% | -66% | 0.02 | $13,689,454 |
| TAR | Taruga Minerals | 17% | 13% | 89% | -31% | 0.034 | $23,033,705 |
| HRZ | Horizon | 17% | 5% | -34% | -49% | 0.069 | $39,239,312 |
| ADT | Adriatic Metals | 17% | 34% | 25% | 8% | 2.87 | $623,725,120 |
| MGV | Musgrave Minerals | 17% | 4% | -16% | -36% | 0.245 | $129,749,508 |
| AUC | Ausgold Limited | 17% | 9% | -14% | 11% | 0.049 | $97,414,778 |
| ARL | Ardea Resources Ltd | 16% | 2% | -11% | 108% | 0.965 | $164,645,639 |
| IGO | IGO Limited | 16% | 11% | 50% | 83% | 16.98 | $12,305,601,961 |
| NCM | Newcrest Mining | 16% | 15% | -20% | -20% | 20.07 | $17,123,461,030 |
| ERM | Emmerson Resources | 15% | 7% | -13% | 11% | 0.083 | $45,210,912 |
| MM8 | Medallion Metals. | 15% | 23% | -19% | 2% | 0.19 | $24,492,135 |
| NWM | Norwest Minerals | 15% | 32% | 13% | -25% | 0.054 | $11,327,477 |
| LYN | Lycaonresources | 15% | 13% | -23% | 0% | 0.31 | $10,204,813 |
| PDI | Predictive Disc Ltd | 15% | 8% | 3% | -17% | 0.195 | $309,902,678 |
| SVL | Silver Mines Limited | 14% | 11% | 0% | -11% | 0.2 | $251,907,268 |
| BC8 | Black Cat Syndicate | 14% | -3% | -27% | -41% | 0.32 | $67,408,165 |
| ARV | Artemis Resources | 14% | -40% | -20% | -64% | 0.032 | $43,133,970 |
| HXG | Hexagon Energy | 14% | -3% | -41% | -85% | 0.016 | $8,206,654 |
| NML | Navarre Minerals Ltd | 14% | 9% | -40% | -45% | 0.049 | $69,018,199 |
| RMS | Ramelius Resources | 14% | 38% | -30% | -45% | 0.91 | $745,813,328 |
| CAI | Calidus Resources | 14% | -13% | -51% | -29% | 0.415 | $172,923,773 |
| CLZ | Classic Min Ltd | 14% | -26% | -91% | -91% | 0.0125 | $8,836,600 |
| EM2 | Eagle Mountain | 14% | 8% | -30% | -69% | 0.21 | $49,629,037 |
| AWV | Anova Metals Ltd | 13% | 21% | 42% | -15% | 0.017 | $25,569,507 |
| LM8 | Lunnonmetalslimited | 13% | 10% | -1% | 131% | 0.9 | $88,999,663 |
| CY5 | Cygnus Gold Limited | 13% | 32% | 314% | 241% | 0.58 | $85,151,050 |
| LCY | Legacy Iron Ore | 13% | -5% | -25% | 29% | 0.018 | $115,322,872 |
| BCN | Beacon Minerals | 13% | 8% | -13% | -16% | 0.027 | $97,675,972 |
| TSO | Tesoro Gold Ltd | 13% | -14% | -44% | -56% | 0.036 | $30,519,327 |
| THR | Thor Mining PLC | 13% | 0% | -31% | -44% | 0.009 | $9,925,951 |
| MTC | Metalstech Ltd | 12% | -5% | 14% | 33% | 0.42 | $71,034,428 |
| SVG | Savannah Goldfields | 12% | -2% | 18% | 11% | 0.235 | $40,560,633 |
| RED | Red 5 Limited | 12% | 12% | -44% | -28% | 0.19 | $485,124,736 |
| LRL | Labyrinth Resources | 12% | -21% | -34% | -47% | 0.019 | $16,593,968 |
| TTM | Titan Minerals | 12% | 13% | 9% | -13% | 0.087 | $119,958,221 |
| AAJ | Aruma Resources Ltd | 11% | 20% | -6% | -8% | 0.078 | $12,086,036 |
| ALK | Alkane Resources Ltd | 11% | -3% | -28% | -27% | 0.685 | $392,209,148 |
| MI6 | Minerals260Limited | 11% | -3% | -4% | -28% | 0.345 | $79,200,000 |
| HMX | Hammer Metals Ltd | 11% | 30% | -15% | 46% | 0.07 | $56,584,089 |
| TMZ | Thomson Res Ltd | 11% | 0% | -26% | -72% | 0.02 | $15,320,971 |
| FAU | First Au Ltd | 11% | 0% | -62% | -55% | 0.005 | $4,759,966 |
| GMD | Genesis Minerals | 11% | 27% | 0% | -11% | 1.27 | $491,766,525 |
| TUL | Tulla Resources | 11% | -3% | -16% | -21% | 0.42 | $79,234,130 |
| KAI | Kairos Minerals Ltd | 10% | 7% | 19% | 7% | 0.032 | $58,922,805 |
| NSM | Northstaw | 10% | -26% | -60% | -68% | 0.1 | $12,012,700 |
| ENR | Encounter Resources | 10% | 48% | 31% | -6% | 0.17 | $57,935,754 |
| BYH | Bryah Resources Ltd | 10% | -4% | -52% | -62% | 0.023 | $6,468,830 |
| KAU | Kaiser Reef | 9% | 16% | 0% | -16% | 0.18 | $22,109,717 |
| PUR | Pursuit Minerals | 9% | -8% | -40% | -65% | 0.012 | $11,978,150 |
| MEK | Meeka Metals Limited | 8% | 7% | 52% | 3% | 0.064 | $67,259,363 |
| SSR | SSR Mining Inc. | 8% | 2% | -24% | -7% | 22.27 | $390,698,208 |
| BNR | Bulletin Res Ltd | 8% | 8% | 0% | 84% | 0.14 | $39,499,799 |
| MEI | Meteoric Resources | 8% | 0% | 27% | -30% | 0.014 | $21,368,163 |
| IPT | Impact Minerals | 8% | -7% | -30% | -48% | 0.007 | $17,369,594 |
| FEG | Far East Gold | 8% | -9% | 82% | 0% | 0.645 | $78,714,000 |
| MKG | Mako Gold | 8% | -12% | -45% | -59% | 0.043 | $20,176,130 |
| GSM | Golden State Mining | 8% | 8% | -30% | -63% | 0.043 | $5,031,611 |
| ASO | Aston Minerals Ltd | 7% | -12% | -40% | -37% | 0.072 | $80,174,227 |
| RGL | Riversgold | 7% | -10% | -8% | 131% | 0.044 | $34,157,246 |
| KRM | Kingsrose Mining Ltd | 7% | 5% | -16% | -14% | 0.059 | $44,399,065 |
| MRR | Minrex Resources Ltd | 7% | -21% | -13% | 105% | 0.045 | $45,508,751 |
| CHZ | Chesser Resources | 7% | 0% | -25% | -52% | 0.075 | $44,109,233 |
| XAM | Xanadu Mines Ltd | 7% | 7% | 15% | 7% | 0.03 | $42,367,806 |
| AUT | Auteco Minerals | 7% | 31% | -25% | -39% | 0.046 | $93,052,634 |
| VMC | Venus Metals Cor Ltd | 7% | 7% | 0% | -14% | 0.16 | $26,711,802 |
| A8G | Australasian Metals | 7% | -14% | -36% | -64% | 0.245 | $10,292,624 |
| RDN | Raiden Resources Ltd | 6% | 6% | -23% | -60% | 0.0085 | $13,875,758 |
| SMI | Santana Minerals Ltd | 6% | -11% | -13% | 156% | 0.615 | $89,266,559 |
| WWI | West Wits Mining Ltd | 6% | 6% | -25% | -53% | 0.018 | $36,810,678 |
| WRM | White Rock Min Ltd | 6% | -10% | -41% | -74% | 0.074 | $13,890,445 |
| HMG | Hamelingoldlimited | 6% | 19% | 31% | 6% | 0.19 | $20,900,000 |
| TBR | Tribune Res Ltd | 5% | -9% | -24% | -35% | 3.1 | $160,552,316 |
| AAR | Astral Resources NL | 5% | -22% | -29% | -30% | 0.059 | $39,259,189 |
| IDA | Indiana Resources | 5% | 3% | 2% | 0% | 0.06 | $28,350,680 |
| MRZ | Mont Royal Resources | 5% | -15% | -32% | -56% | 0.2 | $13,407,190 |
| RSG | Resolute Mining | 5% | -7% | -34% | -53% | 0.205 | $226,364,971 |
| FG1 | Flynngold | 5% | 0% | -27% | -37% | 0.11 | $7,046,716 |
| SKY | SKY Metals Ltd | 5% | -10% | -49% | -48% | 0.045 | $16,955,256 |
| GBR | Greatbould Resources | 4% | -2% | 2% | -32% | 0.095 | $40,172,856 |
| DTR | Dateline Resources | 4% | -11% | -26% | -22% | 0.073 | $39,345,622 |
| BNZ | Benzmining | 4% | 0% | -13% | -20% | 0.52 | $35,562,423 |
| E2M | E2 Metals | 4% | 0% | -18% | -45% | 0.135 | $26,882,864 |
| TLM | Talisman Mining | 4% | -4% | -7% | -4% | 0.135 | $25,344,832 |
| BRB | Breaker Res NL | 4% | 12% | 33% | -29% | 0.285 | $92,864,665 |
| AZS | Azure Minerals | 4% | 24% | 6% | -27% | 0.285 | $79,237,609 |
| ZNC | Zenith Minerals Ltd | 4% | -6% | -15% | 23% | 0.29 | $99,119,155 |
| KSN | Kingston Resources | 3% | 0% | -31% | -61% | 0.09 | $37,619,093 |
| PGD | Peregrine Gold | 3% | -23% | 10% | 11% | 0.45 | $17,438,350 |
| HAV | Havilah Resources | 3% | 0% | 72% | 51% | 0.31 | $98,158,155 |
| M2R | Miramar | 3% | -2% | -25% | -50% | 0.098 | $6,926,811 |
| RND | Rand Mining Ltd | 3% | 7% | -1% | 7% | 1.495 | $85,029,562 |
| KWR | Kingwest Resources | 3% | 0% | -74% | -74% | 0.035 | $9,015,258 |
| X64 | Ten Sixty Four Ltd | 3% | -7% | -14% | -24% | 0.575 | $129,042,215 |
| MLS | Metals Australia | 3% | -9% | -57% | -22% | 0.039 | $22,460,339 |
| TAM | Tanami Gold NL | 3% | -13% | -27% | -45% | 0.04 | $44,653,688 |
| PNT | Panthermetalsltd | 3% | -2% | 0% | 0% | 0.2 | $6,100,000 |
| POL | Polymetals Resources | 3% | 21% | 95% | 46% | 0.205 | $8,442,452 |
| OKR | Okapi Resources | 2% | -16% | -13% | -61% | 0.21 | $29,467,699 |
| HAW | Hawthorn Resources | 2% | -4% | -31% | 54% | 0.086 | $28,682,343 |
| MXR | Maximus Resources | 2% | -2% | -35% | -39% | 0.045 | $14,350,760 |
| OBM | Ora Banda Mining Ltd | 1% | -1% | 132% | 12% | 0.079 | $107,293,082 |
| EMR | Emerald Res NL | 0% | -6% | 2% | 9% | 1.1 | $646,916,071 |
| FFX | Firefinch Ltd | 0% | 0% | -35% | -11% | 0.2 | $236,248,644 |
| PNR | Pantoro Limited | 0% | -24% | -42% | -35% | 0.14 | $228,795,403 |
| NVA | Nova Minerals Ltd | 0% | 19% | 40% | -40% | 0.81 | $145,092,407 |
| AMI | Aurelia Metals Ltd | 0% | -31% | -73% | -74% | 0.1 | $123,743,722 |
| SPQ | Superior Resources | 0% | 25% | 76% | 233% | 0.06 | $102,073,225 |
| WMC | Wiluna Mining Corp | 0% | 0% | -58% | -76% | 0.205 | $74,238,031 |
| TRY | Troy Resources Ltd | 0% | 0% | 0% | 0% | 0.0295 | $62,920,961 |
| XTC | Xantippe Res Ltd | 0% | -6% | -32% | 50% | 0.0075 | $57,016,609 |
| S2R | S2 Resources | 0% | 0% | -3% | -19% | 0.145 | $51,717,854 |
| VAN | Vango Mining Ltd | 0% | 3% | -7% | -40% | 0.039 | $49,137,568 |
| SVY | Stavely Minerals Ltd | 0% | -6% | -57% | -71% | 0.145 | $45,213,652 |
| LEX | Lefroy Exploration | 0% | 0% | -2% | -32% | 0.28 | $40,844,907 |
| RVR | Red River Resources | 0% | -11% | -59% | -64% | 0.073 | $37,847,908 |
| ASR | Asra Minerals Ltd | 0% | -4% | -37% | -8% | 0.022 | $33,678,015 |
| GSN | Great Southern | 0% | 16% | 19% | -28% | 0.05 | $29,016,421 |
| PF1 | Pathfinder Resources | 0% | 0% | 0% | 79% | 0.5 | $28,984,082 |
| GSR | Greenstone Resources | 0% | -19% | -7% | 8% | 0.026 | $26,864,474 |
| ANL | Amani Gold Ltd | 0% | 0% | -33% | -50% | 0.001 | $23,693,441 |
| CGN | Crater Gold Min Ltd | 0% | 0% | 0% | 0% | 0.017 | $21,063,474 |
| KTA | Krakatoa Resources | 0% | -14% | -23% | -2% | 0.06 | $20,682,595 |
| PRX | Prodigy Gold NL | 0% | 0% | -31% | -64% | 0.011 | $19,226,711 |
| SRN | Surefire Rescs NL | 0% | 0% | -59% | 18% | 0.013 | $18,976,362 |
| PNX | PNX Metals Limited | 0% | -11% | -20% | -41% | 0.004 | $17,776,231 |
| CLA | Celsius Resource Ltd | 0% | -29% | -44% | -62% | 0.01 | $13,525,461 |
| BAT | Battery Minerals Ltd | 0% | 0% | -44% | -68% | 0.0045 | $13,163,591 |
| GED | Golden Deeps | 0% | -27% | -21% | -8% | 0.011 | $12,707,494 |
| MCT | Metalicity Limited | 0% | 0% | -33% | -48% | 0.004 | $12,222,138 |
| CWX | Carawine Resources | 0% | -9% | -39% | -59% | 0.086 | $11,853,754 |
| SBR | Sabre Resources | 0% | -38% | -20% | -20% | 0.004 | $11,659,424 |
| NAE | New Age Exploration | 0% | 14% | -27% | -27% | 0.008 | $11,487,191 |
| CAZ | Cazaly Resources | 0% | -19% | -19% | -32% | 0.03 | $11,124,654 |
| TSC | Twenty Seven Co. Ltd | 0% | 0% | -18% | -43% | 0.002 | $10,643,256 |
| DTM | Dart Mining NL | 0% | -14% | 10% | -36% | 0.067 | $10,247,171 |
| GRL | Godolphin Resources | 0% | 2% | -28% | -38% | 0.09 | $9,943,034 |
| DCX | Discovex Res Ltd | 0% | -25% | -61% | -37% | 0.003 | $9,907,704 |
| MHC | Manhattan Corp Ltd | 0% | 0% | -36% | -36% | 0.007 | $9,157,672 |
| NPM | Newpeak Metals | 0% | 0% | 0% | 0% | 0.001 | $9,040,417 |
| SI6 | SI6 Metals Limited | 0% | 0% | -33% | -50% | 0.006 | $8,972,368 |
| RMX | Red Mount Min Ltd | 0% | -17% | -38% | -55% | 0.005 | $8,211,819 |
| VKA | Viking Mines Ltd | 0% | 14% | -11% | -60% | 0.008 | $8,202,067 |
| MBK | Metal Bank Ltd | 0% | -25% | -45% | -63% | 0.003 | $7,845,743 |
| KAL | Kalgoorliegoldmining | 0% | -20% | -20% | 0% | 0.1 | $7,743,460 |
| AYM | Australia United Min | 0% | 0% | -50% | -56% | 0.004 | $7,370,310 |
| GNM | Great Northern | 0% | 0% | -20% | -43% | 0.004 | $6,836,204 |
| MOM | Moab Minerals Ltd | 0% | -8% | -60% | -78% | 0.011 | $6,819,635 |
| AVW | Avira Resources Ltd | 0% | -25% | -40% | -57% | 0.003 | $6,401,370 |
| SFM | Santa Fe Minerals | 0% | 2% | -17% | -2% | 0.087 | $6,335,235 |
| TRM | Truscott Mining Corp | 0% | -6% | -31% | 13% | 0.034 | $5,367,598 |
| PKO | Peako Limited | 0% | -17% | -21% | -35% | 0.015 | $5,308,547 |
| AVM | Advance Metals Ltd | 0% | 0% | -12% | -45% | 0.011 | $5,256,651 |
| M24 | Mamba Exploration | 0% | -17% | 4% | -40% | 0.12 | $5,061,000 |
| DEX | Duke Exploration | 0% | 6% | -59% | -72% | 0.053 | $4,781,191 |
| G88 | Golden Mile Res Ltd | 0% | -21% | -56% | -57% | 0.022 | $4,500,975 |
| AQX | Alice Queen Ltd | 0% | -20% | -60% | -85% | 0.002 | $4,400,500 |
| ADG | Adelong Gold Limited | 0% | -47% | -73% | -82% | 0.008 | $3,545,495 |
| CDR | Codrus Minerals Ltd | 0% | -1% | -17% | -58% | 0.068 | $2,720,000 |
| GAL | Galileo Mining Ltd | 0% | -18% | 460% | 446% | 1.12 | $218,136,127 |
| AWJ | Auric Mining | -1% | 1% | -16% | -41% | 0.071 | $5,659,784 |
| AME | Alto Metals Limited | -1% | -3% | -20% | -34% | 0.066 | $35,279,476 |
| HRN | Horizon Gold Ltd | -2% | -7% | -7% | -18% | 0.325 | $40,684,033 |
| GUL | Gullewa Limited | -2% | -10% | -16% | -20% | 0.061 | $11,645,089 |
| ANX | Anax Metals Ltd | -2% | -11% | -35% | -47% | 0.056 | $22,758,110 |
| SLZ | Sultan Resources Ltd | -2% | 8% | -31% | -41% | 0.097 | $8,078,586 |
| A1G | African Gold Ltd. | -2% | 56% | -8% | -49% | 0.095 | $11,343,981 |
| MEU | Marmota Limited | -2% | -4% | -10% | 2% | 0.045 | $47,646,026 |
| HCH | Hot Chili Ltd | -3% | 2% | -24% | -57% | 0.95 | $108,695,137 |
| MAT | Matsa Resources | -3% | -5% | -37% | -36% | 0.038 | $16,062,330 |
| PNM | Pacific Nickel Mines | -3% | -18% | -22% | -30% | 0.07 | $25,083,060 |
| SNG | Siren Gold | -3% | -6% | -53% | -51% | 0.17 | $19,877,331 |
| KCC | Kincora Copper | -3% | 21% | -32% | -50% | 0.068 | $5,066,869 |
| GML | Gateway Mining | -3% | -31% | -39% | -63% | 0.061 | $13,560,658 |
| DCN | Dacian Gold Ltd | -3% | 45% | -22% | -37% | 0.145 | $176,436,136 |
| GWR | GWR Group Ltd | -3% | -15% | -59% | -45% | 0.058 | $18,630,566 |
| KIN | KIN Min NL | -4% | 11% | 0% | -32% | 0.078 | $80,736,157 |
| GBZ | GBM Rsources Ltd | -4% | 37% | -46% | -60% | 0.052 | $29,157,122 |
| GIB | Gibb River Diamonds | -4% | -14% | -7% | -40% | 0.05 | $10,575,472 |
| MVL | Marvel Gold Limited | -4% | -4% | -38% | -65% | 0.024 | $16,907,865 |
| CST | Castile Resources | -4% | 10% | -36% | -49% | 0.115 | $27,818,779 |
| MOH | Moho Resources | -4% | -15% | -43% | -62% | 0.023 | $4,776,231 |
| STK | Strickland Metals | -4% | 13% | -42% | -43% | 0.043 | $60,349,884 |
| ZAG | Zuleika Gold Ltd | -5% | 11% | -22% | -5% | 0.021 | $10,952,563 |
| MAU | Magnetic Resources | -5% | -16% | -44% | -53% | 0.77 | $176,016,869 |
| RML | Resolution Minerals | -5% | -5% | -27% | -47% | 0.0095 | $10,067,589 |
| RXL | Rox Resources | -5% | -23% | -44% | -49% | 0.185 | $30,409,370 |
| GMR | Golden Rim Resources | -5% | -16% | -47% | -64% | 0.036 | $11,300,882 |
| REZ | Resourc & En Grp Ltd | -5% | -10% | -62% | -72% | 0.018 | $8,996,504 |
| BBX | BBX Minerals Ltd | -6% | 18% | -32% | -62% | 0.065 | $31,636,896 |
| BMR | Ballymore Resources | -6% | -26% | -29% | -26% | 0.16 | $14,570,293 |
| ICG | Inca Minerals Ltd | -6% | -23% | -66% | -76% | 0.03 | $14,461,885 |
| BMO | Bastion Minerals | -6% | -24% | -60% | -78% | 0.06 | $5,694,996 |
| KNB | Koonenberrygold | -6% | -3% | -18% | -54% | 0.074 | $5,605,977 |
| PRS | Prospech Limited | -6% | -12% | -42% | -67% | 0.029 | $1,890,249 |
| AXE | Archer Materials | -7% | -23% | -12% | -59% | 0.63 | $151,869,996 |
| NAG | Nagambie Resources | -7% | -7% | 52% | -13% | 0.07 | $37,007,001 |
| GTR | Gti Energy Ltd | -7% | -7% | -13% | -52% | 0.014 | $21,076,770 |
| OZM | Ozaurum Resources | -7% | -7% | -53% | -53% | 0.07 | $4,880,120 |
| GCY | Gascoyne Res Ltd | -7% | -24% | -22% | -45% | 0.195 | $83,082,880 |
| AGC | AGC Ltd | -7% | -2% | -30% | -39% | 0.064 | $4,334,546 |
| BEZ | Besragoldinc | -8% | -26% | -12% | -74% | 0.037 | $9,328,208 |
| PUA | Peak Minerals Ltd | -8% | -25% | -50% | -63% | 0.006 | $6,248,225 |
| TGM | Theta Gold Mines Ltd | -9% | 14% | -38% | -59% | 0.074 | $45,201,987 |
| CDT | Castle Minerals | -9% | -13% | -45% | -32% | 0.021 | $20,989,353 |
| DRE | Dreadnought Resources Ltd | -9% | 9% | 170% | 127% | 0.1 | $302,218,444 |
| CXU | Cauldron Energy Ltd | -9% | -17% | -23% | -60% | 0.01 | $5,354,113 |
| ICL | Iceni Gold | -9% | -36% | -57% | -76% | 0.058 | $7,435,393 |
| VRC | Volt Resources Ltd | -10% | -32% | 12% | -32% | 0.019 | $64,293,498 |
| SAU | Southern Gold | -10% | -7% | -44% | -58% | 0.027 | $5,759,876 |
| CPM | Coopermetalslimited | -12% | -11% | -6% | 0% | 0.29 | $10,880,800 |
| OAU | Ora Gold Limited | -13% | -13% | -42% | -46% | 0.007 | $6,889,619 |
| AL8 | Alderan Resource Ltd | -13% | -22% | -67% | -82% | 0.007 | $4,047,863 |
| TG1 | Techgen Metals Ltd | -13% | -38% | -23% | -59% | 0.1 | $5,474,896 |
| TBA | Tombola Gold Ltd | -13% | -13% | -56% | -21% | 0.026 | $29,481,644 |
| CBY | Canterbury Resources | -14% | -16% | -39% | -65% | 0.038 | $5,360,941 |
| TMX | Terrain Minerals | -14% | -14% | -40% | -25% | 0.006 | $4,564,566 |
| RDS | Redstone Resources | -14% | -20% | -29% | -57% | 0.006 | $4,420,994 |
| NES | Nelson Resources. | -14% | -52% | -55% | -80% | 0.006 | $1,765,783 |
| YRL | Yandal Resources | -15% | -24% | -46% | -73% | 0.11 | $14,878,404 |
| AAU | Antilles Gold Ltd | -16% | -25% | -36% | -52% | 0.038 | $16,215,586 |
| STN | Saturn Metals | -16% | -24% | -42% | -61% | 0.21 | $27,278,827 |
| MEG | Megado Minerals Ltd | -18% | -30% | -53% | -39% | 0.056 | $7,700,000 |
| SMS | Starmineralslimited | -19% | -27% | -69% | -62% | 0.069 | $2,041,020 |
FML shut its Coolgardie, Laverton and The Mount operations in 2013 amid nosediving gold prices and high operating costs.
Now the WA goldie is about to restart mining operations at Coolgardie, where it wants to produce 402,000oz over an initial seven-year life.
The numbers are pretty good. It would cost $51m to build/refurbish, a process which is already underway.
Once in production, it would have an all-in sustaining cost of $1,618/oz – giving FML pre-tax cashflow of $354m and NPV of $242m at a gold price of $2,500/oz.
Commissioning is scheduled for mid 2023.
Meanwhile, toll treating (using third party plants) of low-grade stockpiles has produced 2,200oz to date, and a small 3,400oz mining project at the Big Blow deposit kicked off in October with ore to be milled via a toll treating campaign later in the year.
US-based Gold 50 has picked up the high-grade historic White Caps Mine in Nevada, which produced more than 125,000 ounces at around 30g/t gold.
5g/t and above is generally considered high grade.
Mined ore grades ranged from 33g/t to 79g/t gold over 6m to 9m widths and grades increased with depth, with the cross-cut on the lowest mine level (400m) assaying 10m at 94g/t.
The company is confident there’s potential for thicker zones of mineralisation around the historic workings as zones containing <10g/t gold were often ignored and not mined.
Mining
Mining
Mining


Get the latest Stockhead news delivered free to your inbox.


