Pic: Via Getty
Gold Digger: Metals Focus says PGM demand will fall away from 2025. Others disagree
Mining
Pic: Via Getty
Mining
Our Gold Digger column wraps all the news driving ASX stocks with exposure to precious metals.
PGM demand will remain strong until about 2025, when it will start to fall off a cliff, Metals Focus says.
Why 2025? Because that’s when electrification of transport really kicks up a gear, at the expense of traditional internal combustion engines (ICE), it says.
The largest single driver of the PGM markets remains auto catalyst demand.
Three to seven grams of platinum group metals (PGMs) — mostly platinum, palladium and rhodium – go in every catalytic converter, which sit in your car exhaust to reduce polluting emissions.
Catalytic convertors account for as much as 80% of annual platinum and palladium production, respectively.
In 2022, Metals Focus expects total PGM demand to grow 11%, breaching 12.8Moz. That’s a record high.
“For this year, autocatalyst demand will make up 82% of total palladium demand, eclipsed by 90% for rhodium,” Metals Focus says.
“Platinum, having a more diverse range of end-uses, will only see 41% of its demand used in autocatalysis, with jewellery, chemicals, then glass making up the bulk of the remainder.”
Car production numbers have been severely dented by a well-publicised short of chips; a problem which is hopefully coming to an end.
Metals Focus’ most recent Five-Year PGM forecast reveals that the PGM markets are expected to remain robust over the short to medium term as vehicle production recovery, stringent emissions legislation and growing primary supply constraints keep things tight, despite looming economic challenges.
“In addition to this, stricter global emissions legislation standards will also benefit PGM autocatalyst demand – namely Euro 7, China 6b, and EPA 27/CARB 24 for the key markets, but also numerous improving standards in emerging markets e.g. PROCONVE L-8 in Brazil,” it says.
For the time being ICE vehicle production is expected to grow, it says.
But EVs, accounting for roughly one-in-twelve car sales this year, are set to climb sharply in the coming years.
“This increasing market share eats into gasoline’s (and diesel’s) monopoly, limiting their production and, over the longer-term, reducing the total amount of PGMs required by the industry,” Metals Focus says.
However, Bridge Street Capital analyst Chris Baker believes this isn’t likely to be the immediate problem Metals Focus says it is. The electrification of transport will be a long-term, 50-year structural change.
“I would argue that the change is going to be a lot slower than most would like – we won’t be able to electrify the automotive industry as quickly as we hope… it’s just not possible,” he says.
“We can’t make enough batteries because we haven’t got enough raw materials which means in the shorter term – at least for the next 20 to 30 years – we will continue to see more intense scrutiny regarding internal combustion engines.
“Demand for ICEs will be around for decades, particularly in heavy vehicles and those that need to travel long distances – batteries are not yet up to that task.”
This means a lot more of palladium, platinum, and rhodium, for longer.
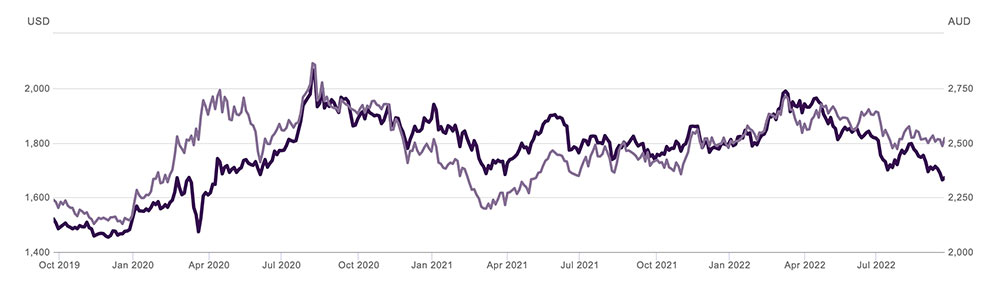
I KNOW. We keep saying this, but gold prices appear to be steadying as foreign exchange (forex, or FX) volatility sends the US dollar all over the shop.
Usually, when the USD dollar moves up, gold falls – like it has been doing in recent times — and vice-versa.
“Gold is clearly going to become a safe-haven as the global outlook deteriorates and as Wall Street grows confident that we are nearing the peak with Treasury yields,” OANDA analyst Edward Moya says.
“Gold has massive support at the $US1660 level and if it can stabilize above there, prices could eventually make a move back above the $US1700 level.”
Here’s how ASX-listed precious metals stocks are performing:
Scroll or swipe to reveal table. Click headings to sort. Best viewed on a laptop.
Stocks missing from this list? Email [email protected]
| CODE | COMPANY | 1 WEEK RETURN % | 1 MONTH RETURN % | 6 MONTH RETURN % | 1 YEAR RETURN % | PRICE | MARKET CAP |
|---|---|---|---|---|---|---|---|
| NAE | New Age Exploration | 38% | 50% | -25% | -25% | 0.009 | $12,923,090.19 |
| GMN | Gold Mountain Ltd | 33% | 14% | -27% | -60% | 0.008 | $9,785,193.36 |
| CXU | Cauldron Energy Ltd | 27% | 56% | -13% | -60% | 0.014 | $8,031,169.16 |
| ARV | Artemis Resources | 26% | 37% | -27% | -38% | 0.048 | $66,639,887.23 |
| MTC | Metalstech Ltd | 26% | 30% | 63% | 28% | 0.415 | $66,665,836.00 |
| TSC | Twenty Seven Co. Ltd | 25% | 19% | -11% | -29% | 0.0025 | $5,321,627.81 |
| GNM | Great Northern | 25% | 0% | 0% | -38% | 0.005 | $8,545,254.88 |
| FG1 | Flynngold | 24% | 18% | -7% | -7% | 0.13 | $7,687,326.00 |
| AQX | Alice Queen Ltd | 20% | 0% | -63% | -70% | 0.003 | $6,461,083.37 |
| FEG | Far East Gold | 20% | 62% | 0% | 0% | 0.73 | $87,866,791.20 |
| AVM | Advance Metals Ltd | 17% | 40% | -7% | -13% | 0.014 | $5,734,528.82 |
| LNY | Laneway Res Ltd | 17% | 40% | 27% | 46% | 0.007 | $45,766,114.87 |
| M24 | Mamba Exploration | 16% | 45% | -9% | -22% | 0.145 | $6,115,375.44 |
| TMX | Terrain Minerals | 14% | 0% | 14% | 0% | 0.008 | $6,086,088.07 |
| IPT | Impact Minerals | 14% | -11% | -25% | -51% | 0.008 | $19,850,964.45 |
| VAN | Vango Mining Ltd | 14% | 0% | 18% | -37% | 0.04 | $47,877,630.02 |
| LEX | Lefroy Exploration | 14% | 12% | 0% | -19% | 0.325 | $48,138,640.44 |
| LRL | Labyrinth Resources | 14% | 9% | -39% | -38% | 0.025 | $21,834,168.88 |
| PRS | Prospech Limited | 13% | 21% | -29% | -60% | 0.034 | $2,216,154.17 |
| BMR | Ballymore Resources | 11% | 3% | 5% | -22% | 0.195 | $16,165,177.82 |
| KNB | Koonenberrygold | 11% | 3% | -8% | 0% | 0.09 | $6,818,079.96 |
| TTM | Titan Minerals | 11% | 11% | -34% | -45% | 0.063 | $90,254,114.11 |
| PRX | Prodigy Gold NL | 10% | -12% | -52% | -67% | 0.011 | $6,408,903.67 |
| GRL | Godolphin Resources | 10% | 3% | -41% | -43% | 0.089 | $10,061,403.00 |
| AAR | Astral Resources NL | 10% | 15% | -14% | 6% | 0.09 | $52,463,773.03 |
| SVY | Stavely Minerals Ltd | 10% | 3% | -60% | -59% | 0.17 | $53,287,518.24 |
| TBA | Tombola Gold Ltd | 9% | 9% | -3% | -10% | 0.036 | $39,308,858.68 |
| KAU | Kaiser Reef | 9% | 9% | -17% | -7% | 0.19 | $22,722,124.95 |
| MXR | Maximus Resources | 8% | -2% | -20% | -44% | 0.052 | $15,945,288.40 |
| MEI | Meteoric Resources | 8% | 17% | -7% | -56% | 0.014 | $22,894,460.57 |
| CHZ | Chesser Resources | 8% | -4% | -26% | -35% | 0.085 | $46,461,725.69 |
| HRN | Horizon Gold Ltd | 8% | -17% | -17% | 3% | 0.355 | $44,439,482.56 |
| AGC | AGC Ltd | 7% | 3% | -18% | -37% | 0.072 | $4,944,091.73 |
| TAM | Tanami Gold NL | 7% | -2% | -21% | -38% | 0.045 | $48,178,978.89 |
| PUR | Pursuit Minerals | 7% | -6% | -25% | -69% | 0.015 | $13,974,508.72 |
| VKA | Viking Mines Ltd | 6% | 6% | -35% | -50% | 0.0085 | $8,714,696.66 |
| RDN | Raiden Resources Ltd | 6% | 13% | -18% | -63% | 0.009 | $11,876,414.96 |
| NAG | Nagambie Resources | 6% | 15% | 36% | -6% | 0.076 | $42,077,984.96 |
| ICL | Iceni Gold | 5% | 1% | -13% | -57% | 0.1 | $12,178,660.66 |
| BEZ | Besragoldinc | 5% | 25% | -44% | 0% | 0.04 | $6,873,998.40 |
| PNT | Panthermetalsltd | 5% | -13% | -11% | 0% | 0.205 | $6,100,000.00 |
| DEX | Duke Exploration | 4% | -32% | -73% | -79% | 0.05 | $4,510,557.60 |
| NSM | Northstaw | 3% | 3% | -47% | -51% | 0.155 | $6,219,685.00 |
| YRL | Yandal Resources | 3% | -3% | -40% | -68% | 0.16 | $18,574,648.48 |
| VMC | Venus Metals Cor Ltd | 3% | -6% | -8% | 3% | 0.165 | $26,412,982.70 |
| G88 | Golden Mile Res Ltd | 3% | 6% | -46% | -28% | 0.034 | $6,546,872.19 |
| GSN | Great Southern | 3% | 0% | -28% | -23% | 0.036 | $18,921,994.40 |
| RND | Rand Mining Ltd | 3% | 3% | -5% | -1% | 1.5 | $85,029,561.70 |
| RGL | Riversgold | 3% | 11% | 3% | 74% | 0.041 | $31,007,597.44 |
| SSR | SSR Mining Inc. | 2% | 3% | -27% | 0% | 21.1 | $363,721,756.14 |
| IVR | Investigator Res Ltd | 2% | 20% | -29% | -21% | 0.049 | $66,615,682.85 |
| AAU | Antilles Gold Ltd | 2% | 2% | -35% | -42% | 0.049 | $20,197,345.33 |
| ZNC | Zenith Minerals Ltd | 2% | -3% | -10% | 46% | 0.3 | $103,428,683.70 |
| HRZ | Horizon | 1% | -5% | -42% | -35% | 0.072 | $44,741,887.49 |
| NPM | Newpeak Metals | 0% | 0% | 0% | -50% | 0.001 | $8,853,750.03 |
| FFX | Firefinch Ltd | 0% | 0% | -32% | -9% | 0.2 | $236,248,644.20 |
| SLZ | Sultan Resources Ltd | 0% | -26% | -35% | -41% | 0.1 | $8,328,438.90 |
| PNX | PNX Metals Limited | 0% | 25% | 0% | -20% | 0.005 | $22,220,289.04 |
| ARL | Ardea Resources Ltd | 0% | -3% | -26% | 113% | 0.9 | $152,763,994.80 |
| BBX | BBX Minerals Ltd | 0% | -13% | -55% | -67% | 0.07 | $33,583,781.78 |
| DRE | Dreadnought Resources Ltd | 0% | 9% | 200% | 224% | 0.12 | $349,891,358.37 |
| AM7 | Arcadia Minerals | 0% | 56% | 30% | 17% | 0.305 | $14,476,346.52 |
| SIH | Sihayo Gold Limited | 0% | 0% | -50% | -72% | 0.0025 | $15,255,320.23 |
| MCT | Metalicity Limited | 0% | 25% | -13% | -48% | 0.005 | $17,293,530.03 |
| TRY | Troy Resources Ltd | 0% | 0% | 0% | 0% | 0.0295 | $62,920,961.44 |
| CGN | Crater Gold Min Ltd | 0% | 0% | 0% | 0% | 0.017 | $21,063,473.65 |
| G50 | Gold50Limited | 0% | -24% | -44% | -38% | 0.14 | $7,842,520.14 |
| DDD | 3D Resources Limited | 0% | -50% | -67% | -75% | 0.001 | $4,431,872.09 |
| XTC | Xantippe Res Ltd | 0% | 0% | 29% | 350% | 0.009 | $73,307,068.65 |
| BYH | Bryah Resources Ltd | 0% | -3% | -42% | -48% | 0.028 | $7,819,097.27 |
| MEU | Marmota Limited | 0% | -4% | 4% | -6% | 0.047 | $49,575,627.03 |
| RML | Resolution Minerals | 0% | 10% | -42% | -42% | 0.011 | $9,567,461.92 |
| AL8 | Alderan Resource Ltd | 0% | 11% | -50% | -79% | 0.01 | $5,782,660.80 |
| PF1 | Pathfinder Resources | 0% | 0% | 27% | 32% | 0.5 | $26,560,505.00 |
| CLA | Celsius Resource Ltd | 0% | 8% | -42% | -46% | 0.014 | $19,536,777.56 |
| SFM | Santa Fe Minerals | 0% | 5% | -47% | 0% | 0.085 | $6,189,597.07 |
| CBY | Canterbury Resources | 0% | -20% | -53% | -63% | 0.035 | $4,311,948.55 |
| WMC | Wiluna Mining Corp | 0% | 0% | -74% | -77% | 0.205 | $74,238,030.68 |
| BMO | Bastion Minerals | 0% | -24% | -43% | -61% | 0.091 | $6,909,562.66 |
| CDR | Codrus Minerals Ltd | 0% | -17% | -25% | -52% | 0.075 | $3,000,000.00 |
| OKU | Oklo Resources Ltd | 0% | 3% | 70% | 25% | 0.15 | $78,226,971.90 |
| AVW | Avira Resources Ltd | 0% | 0% | -33% | -20% | 0.004 | $8,475,160.00 |
| LCY | Legacy Iron Ore | 0% | 0% | 0% | 54% | 0.02 | $128,136,523.98 |
| BRV | Big River Gold Ltd | 0% | 2% | 15% | 23% | 0.3575 | $88,866,903.13 |
| GML | Gateway Mining | 0% | 36% | -18% | -44% | 0.09 | $20,340,986.49 |
| SBR | Sabre Resources | 0% | 0% | 10% | 10% | 0.0055 | $16,738,386.05 |
| SAU | Southern Gold | 0% | 0% | -36% | -48% | 0.034 | $7,466,506.46 |
| CEL | Challenger Exp Ltd | 0% | -5% | -45% | -36% | 0.185 | $188,084,025.00 |
| KTA | Krakatoa Resources | 0% | 5% | 42% | -7% | 0.064 | $22,061,434.69 |
| MBK | Metal Bank Ltd | 0% | -11% | -33% | -53% | 0.004 | $10,431,272.64 |
| KRM | Kingsrose Mining Ltd | 0% | -11% | -31% | 13% | 0.051 | $38,378,852.47 |
| BTR | Brightstar Resources | 0% | -6% | -45% | -41% | 0.016 | $10,349,773.90 |
| SNG | Siren Gold | 0% | 2% | -23% | -14% | 0.215 | $20,840,365.60 |
| AYM | Australia United Min | 0% | 0% | 0% | -40% | 0.006 | $9,212,887.43 |
| ANL | Amani Gold Ltd | 0% | 50% | -25% | -25% | 0.0015 | $35,540,161.69 |
| IGO | IGO Limited | 0% | 20% | 15% | 59% | 14.575 | $11,192,418,276.14 |
| X64 | Ten Sixty Four Ltd | -1% | 3% | -33% | -20% | 0.615 | $140,193,125.12 |
| GSR | Greenstone Resources | -2% | -13% | 76% | 160% | 0.065 | $71,634,850.85 |
| GUL | Gullewa Limited | -2% | 0% | -19% | -35% | 0.06 | $11,454,186.00 |
| STN | Saturn Metals | -2% | -10% | -27% | -39% | 0.27 | $35,072,777.79 |
| MGV | Musgrave Minerals | -2% | -11% | -29% | -14% | 0.24 | $126,235,643.02 |
| NCM | Newcrest Mining | -2% | -9% | -36% | -29% | 16.74 | $14,995,539,317.13 |
| GSM | Golden State Mining | -2% | -26% | -45% | -65% | 0.046 | $5,382,653.38 |
| AMI | Aurelia Metals Ltd | -2% | -15% | -56% | -32% | 0.225 | $272,236,187.52 |
| AGG | AngloGold Ashanti | -2% | -13% | -41% | -10% | 3.8 | $334,529,118.75 |
| A1G | African Gold Ltd. | -2% | -14% | -59% | -68% | 0.082 | $9,791,646.90 |
| AWJ | Auric Mining | -3% | -23% | -13% | -43% | 0.077 | $4,680,548.03 |
| AME | Alto Metals Limited | -3% | -4% | -27% | -11% | 0.07 | $37,417,625.84 |
| BC8 | Black Cat Syndicate | -3% | -16% | -41% | -37% | 0.33 | $70,618,077.75 |
| MEK | Meeka Metals Limited | -3% | -16% | 32% | 40% | 0.066 | $69,857,189.49 |
| TBR | Tribune Res Ltd | -3% | -5% | -24% | -28% | 3.54 | $183,638,269.50 |
| BGD | Bartongoldholdings | -3% | 0% | -38% | -6% | 0.16 | $13,323,679.57 |
| XAM | Xanadu Mines Ltd | -3% | -9% | 19% | 3% | 0.032 | $45,192,326.88 |
| TAR | Taruga Minerals | -3% | 0% | 7% | -40% | 0.031 | $18,497,543.68 |
| MKR | Manuka Resources. | -3% | 3% | -45% | -51% | 0.15 | $41,472,955.25 |
| DTR | Dateline Resources | -3% | -17% | -12% | -2% | 0.087 | $50,201,197.26 |
| TLM | Talisman Mining | -3% | -13% | -24% | 0% | 0.14 | $27,222,227.07 |
| NST | Northern Star | -3% | -1% | -30% | -20% | 7.45 | $8,785,051,713.88 |
| GWR | GWR Group Ltd | -4% | -4% | -45% | -34% | 0.082 | $26,660,982.37 |
| RXL | Rox Resources | -4% | 8% | -33% | -29% | 0.27 | $47,303,465.16 |
| S2R | S2 Resources | -4% | -13% | -25% | 55% | 0.135 | $49,892,479.70 |
| RXL | Rox Resources | -4% | 8% | -33% | -29% | 0.27 | $47,303,465.16 |
| AXE | Archer Materials | -4% | -4% | -15% | -62% | 0.8 | $203,743,109.74 |
| ANX | Anax Metals Ltd | -4% | -18% | -25% | -28% | 0.066 | $28,799,599.36 |
| PRU | Perseus Mining Ltd | -4% | -11% | -26% | -2% | 1.44 | $1,965,873,890.88 |
| ASR | Asra Minerals Ltd | -4% | 32% | -4% | -7% | 0.025 | $39,535,061.42 |
| ADT | Adriatic Metals | -4% | -2% | -9% | -26% | 2.13 | $453,143,088.36 |
| HAW | Hawthorn Resources | -4% | 6% | 29% | 104% | 0.094 | $32,017,498.85 |
| AQI | Alicanto Min Ltd | -4% | -13% | -51% | -61% | 0.047 | $19,709,453.62 |
| CST | Castile Resources | -4% | -4% | -30% | -48% | 0.115 | $27,212,817.77 |
| MZZ | Matador Mining Ltd | -4% | -8% | -61% | -70% | 0.11 | $31,044,745.49 |
| RRL | Regis Resources | -4% | -8% | -30% | -28% | 1.4825 | $1,124,988,628.25 |
| RMS | Ramelius Resources | -4% | -27% | -58% | -54% | 0.655 | $573,974,489.22 |
| SMI | Santana Minerals Ltd | -4% | -18% | 39% | 586% | 0.755 | $102,607,915.16 |
| ASO | Aston Minerals Ltd | -4% | -4% | -45% | -22% | 0.086 | $96,877,191.26 |
| ERM | Emmerson Resources | -5% | -15% | -33% | 23% | 0.08 | $43,576,783.04 |
| AUT | Auteco Minerals | -5% | -11% | -47% | -51% | 0.04 | $84,759,388.89 |
| LYN | Lycaonresources | -5% | 17% | -17% | 0% | 0.35 | $11,251,359.38 |
| CYL | Catalyst Metals | -5% | -3% | -41% | -36% | 1.19 | $117,162,816.12 |
| MDI | Middle Island Res | -5% | -16% | -46% | -28% | 0.0675 | $7,957,184.43 |
| KCN | Kingsgate Consolid. | -5% | -3% | 1% | 85% | 1.52 | $333,087,281.77 |
| GTR | Gti Energy Ltd | -5% | 19% | -41% | -46% | 0.019 | $30,109,671.58 |
| ZAG | Zuleika Gold Ltd | -5% | -5% | -41% | -24% | 0.019 | $9,909,461.88 |
| GAL | Galileo Mining Ltd | -5% | 13% | 447% | 335% | 1.175 | $230,967,664.20 |
| CAZ | Cazaly Resources | -5% | -8% | -16% | -14% | 0.036 | $13,720,406.34 |
| TIE | Tietto Minerals | -5% | -3% | -19% | 43% | 0.4875 | $518,173,195.20 |
| SMS | Starmineralslimited | -5% | -5% | -56% | 0% | 0.088 | $2,603,040.00 |
| LM8 | Lunnonmetalslimited | -5% | -6% | -6% | 79% | 0.875 | $98,888,514.30 |
| TSO | Tesoro Gold Ltd | -5% | -10% | -56% | -64% | 0.035 | $30,725,308.04 |
| BGL | Bellevue Gold Ltd | -5% | -8% | -26% | -11% | 0.7375 | $778,806,054.98 |
| BNZ | Benzmining | -5% | 3% | -15% | -26% | 0.52 | $36,384,339.60 |
| MM8 | Medallion Metals. | -6% | -15% | -31% | -21% | 0.17 | $23,792,360.03 |
| HXG | Hexagon Energy | -6% | 0% | -69% | -76% | 0.017 | $8,719,570.32 |
| PGD | Peregrine Gold | -6% | -29% | 28% | 69% | 0.59 | $23,426,541.38 |
| PNM | Pacific Nickel Mines | -6% | 36% | -14% | 41% | 0.099 | $25,771,206.32 |
| MEG | Megado Minerals Ltd | -6% | -27% | -1% | -16% | 0.08 | $8,723,903.84 |
| OAU | Ora Gold Limited | -6% | -27% | -43% | -50% | 0.008 | $8,858,081.55 |
| NML | Navarre Minerals Ltd | -6% | -10% | -51% | -45% | 0.047 | $67,580,320.00 |
| SFR | Sandfire Resources | -6% | -20% | -30% | -33% | 3.89 | $1,612,013,719.44 |
| CAI | Calidus Resources | -6% | -14% | -42% | -4% | 0.54 | $238,591,029.23 |
| WGX | Westgold Resources. | -6% | -31% | -61% | -53% | 0.8025 | $383,634,411.30 |
| NMR | Native Mineral Res | -6% | 25% | -33% | -37% | 0.15 | $7,652,723.68 |
| A8G | Australasian Metals | -6% | -3% | -42% | -16% | 0.295 | $12,145,295.73 |
| ARN | Aldoro Resources | -6% | -14% | -34% | -49% | 0.22 | $21,909,209.74 |
| LCL | Los Cerros Limited | -6% | -15% | -74% | -78% | 0.029 | $18,868,816.80 |
| E2M | E2 Metals | -6% | -3% | -46% | -48% | 0.145 | $28,874,186.84 |
| KSN | Kingston Resources | -7% | -3% | -45% | -59% | 0.086 | $35,965,506.38 |
| EVN | Evolution Mining Ltd | -7% | -20% | -55% | -47% | 2 | $3,688,177,411.35 |
| SLR | Silver Lake Resource | -7% | -16% | -48% | -17% | 1.125 | $1,048,898,904.75 |
| SVL | Silver Mines Limited | -7% | 1% | -30% | -12% | 0.1725 | $226,070,625.03 |
| PDI | Predictive Disc Ltd | -7% | -16% | -22% | 19% | 0.1725 | $298,836,980.05 |
| ENR | Encounter Resources | -7% | -10% | -13% | -32% | 0.135 | $45,996,439.77 |
| KIN | KIN Min NL | -7% | -11% | -33% | -35% | 0.067 | $76,542,070.67 |
| QML | Qmines Limited | -7% | -7% | -48% | -56% | 0.13 | $10,793,476.13 |
| FML | Focus Minerals Ltd | -7% | -11% | -50% | -50% | 0.125 | $37,252,623.85 |
| GOR | Gold Road Res Ltd | -7% | -3% | -24% | -1% | 1.2675 | $1,364,716,169.47 |
| HMX | Hammer Metals Ltd | -8% | -20% | -54% | -33% | 0.048 | $39,362,844.29 |
| RMX | Red Mount Min Ltd | -8% | -14% | -25% | -40% | 0.006 | $9,854,183.15 |
| AAJ | Aruma Resources Ltd | -8% | -14% | -36% | -32% | 0.06 | $10,045,536.19 |
| KCC | Kincora Copper | -8% | 3% | -55% | -60% | 0.06 | $4,930,135.97 |
| CPM | Coopermetalslimited | -8% | -27% | 1% | 0% | 0.36 | $12,643,467.12 |
| BCN | Beacon Minerals | -8% | -15% | -38% | -28% | 0.023 | $90,162,436.10 |
| KZR | Kalamazoo Resources | -8% | -4% | -25% | -34% | 0.225 | $34,614,177.89 |
| GBZ | GBM Rsources Ltd | -8% | -22% | -64% | -59% | 0.045 | $22,948,269.29 |
| BRB | Breaker Res NL | -8% | -2% | -10% | -17% | 0.22 | $73,314,209.03 |
| DEG | De Grey Mining | -8% | 11% | -18% | -1% | 1.0025 | $1,446,065,812.88 |
| AUC | Ausgold Limited | -9% | -14% | -17% | 10% | 0.043 | $87,267,405.26 |
| RVR | Red River Resources | -9% | -41% | -63% | -48% | 0.086 | $44,587,945.97 |
| ALY | Alchemy Resource Ltd | -9% | 11% | 50% | 53% | 0.021 | $20,014,595.06 |
| IDA | Indiana Resources | -9% | 2% | 3% | 9% | 0.062 | $31,284,813.24 |
| TRM | Truscott Mining Corp | -9% | 17% | 28% | 21% | 0.041 | $6,314,821.76 |
| PGO | Pacgold | -9% | 9% | -29% | 108% | 0.51 | $27,480,907.50 |
| MTH | Mithril Resources | -9% | -23% | -57% | -67% | 0.005 | $14,701,165.21 |
| THR | Thor Mining PLC | -9% | 11% | -29% | -47% | 0.01 | $10,991,633.25 |
| NXM | Nexus Minerals Ltd | -9% | -17% | -58% | -37% | 0.195 | $59,588,483.86 |
| AZS | Azure Minerals | -9% | -9% | -47% | -43% | 0.195 | $62,147,144.20 |
| SRN | Surefire Rescs NL | -9% | -3% | 12% | 12% | 0.0145 | $22,139,088.68 |
| ALK | Alkane Resources Ltd | -9% | 1% | -35% | -13% | 0.72 | $432,157,463.50 |
| GMR | Golden Rim Resources | -10% | -2% | -35% | -48% | 0.047 | $14,126,102.82 |
| EM2 | Eagle Mountain | -10% | 15% | -51% | -68% | 0.235 | $68,407,591.07 |
| WRM | White Rock Min Ltd | -10% | -1% | -59% | -71% | 0.084 | $16,480,268.04 |
| MRZ | Mont Royal Resources | -10% | -18% | -16% | -25% | 0.23 | $15,418,268.73 |
| CY5 | Cygnus Gold Limited | -10% | 2% | 24% | 84% | 0.23 | $36,796,328.75 |
| MAU | Magnetic Resources | -10% | -14% | -38% | -45% | 0.9 | $217,044,122.15 |
| BAT | Battery Minerals Ltd | -10% | -18% | -50% | -68% | 0.0045 | $13,163,590.55 |
| TUL | Tulla Resources | -10% | -14% | -25% | -6% | 0.45 | $74,500,845.48 |
| MI6 | Minerals260Limited | -10% | -18% | -46% | 0% | 0.265 | $59,400,000.00 |
| KWR | Kingwest Resources | -10% | -31% | -73% | -62% | 0.044 | $12,114,253.17 |
| RED | Red 5 Limited | -10% | -15% | -41% | 7% | 0.22 | $531,486,948.15 |
| NVA | Nova Minerals Ltd | -10% | -16% | 3% | -49% | 0.735 | $137,745,956.25 |
| PUA | Peak Minerals Ltd | -11% | -6% | -35% | -40% | 0.0085 | $9,372,336.76 |
| GBR | Greatbould Resources | -11% | -9% | -34% | -36% | 0.096 | $42,287,217.30 |
| VRC | Volt Resources Ltd | -11% | 39% | 108% | -19% | 0.025 | $96,299,249.53 |
| TCG | Turaco Gold Limited | -11% | -32% | -50% | -57% | 0.05 | $22,668,983.46 |
| EMR | Emerald Res NL | -11% | -8% | -4% | 22% | 1.06 | $664,721,100.96 |
| WWI | West Wits Mining Ltd | -11% | -11% | -54% | -65% | 0.016 | $32,160,602.75 |
| EMU | EMU NL | -11% | -38% | -56% | -73% | 0.008 | $4,948,330.36 |
| POL | Polymetals Resources | -11% | 10% | 33% | 28% | 0.16 | $6,589,230.72 |
| RDS | Redstone Resources | -11% | -20% | -20% | -33% | 0.008 | $5,894,659.17 |
| PNR | Pantoro Limited | -11% | -1% | -39% | -17% | 0.1775 | $283,722,994.44 |
| MLS | Metals Australia | -11% | -15% | -47% | 18% | 0.047 | $29,137,737.17 |
| SBM | St Barbara Limited | -12% | -20% | -50% | -44% | 0.7725 | $644,513,082.55 |
| CLZ | Classic Min Ltd | -12% | -20% | -88% | -88% | 0.017 | $7,163,591.30 |
| ADV | Ardiden Ltd | -12% | -12% | -42% | -42% | 0.0075 | $21,346,682.85 |
| WAF | West African Res Ltd | -12% | -18% | -19% | 10% | 1.0575 | $1,102,736,181.60 |
| TMZ | Thomson Res Ltd | -12% | -15% | -58% | -78% | 0.022 | $18,086,438.98 |
| HAV | Havilah Resources | -12% | -4% | 89% | 74% | 0.33 | $101,324,547.20 |
| HMG | Hamelingoldlimited | -12% | -6% | -6% | 0% | 0.145 | $15,950,000.00 |
| DCN | Dacian Gold Ltd | -12% | -21% | -68% | -61% | 0.0825 | $103,972,925.34 |
| AWV | Anova Metals Ltd | -13% | 0% | 0% | -36% | 0.014 | $22,471,413.00 |
| MHC | Manhattan Corp Ltd | -13% | -30% | -50% | -42% | 0.007 | $12,210,229.54 |
| SI6 | SI6 Metals Limited | -13% | -13% | -30% | -39% | 0.007 | $11,905,512.63 |
| CWX | Carawine Resources | -13% | -9% | -55% | -49% | 0.096 | $13,232,097.31 |
| REZ | Resourc & En Grp Ltd | -13% | -5% | -50% | -53% | 0.02 | $10,495,921.57 |
| CHN | Chalice Mining Ltd | -13% | -13% | -48% | -44% | 3.73 | $1,516,477,691.82 |
| GED | Golden Deeps | -13% | -19% | 30% | 18% | 0.013 | $16,173,174.00 |
| SKY | SKY Metals Ltd | -13% | -19% | -40% | -48% | 0.052 | $19,592,740.44 |
| KAL | Kalgoorliegoldmining | -13% | 8% | -19% | 0% | 0.13 | $9,778,671.00 |
| MAT | Matsa Resources | -14% | -14% | -39% | -36% | 0.038 | $16,438,184.80 |
| DTM | Dart Mining NL | -14% | 6% | 1% | -22% | 0.082 | $13,908,597.75 |
| MRR | Minrex Resources Ltd | -14% | -11% | -18% | 233% | 0.05 | $54,148,297.10 |
| CMM | Capricorn Metals | -14% | -26% | -29% | 30% | 2.8 | $1,061,947,525.40 |
| CTO | Citigold Corp Ltd | -14% | -25% | -25% | -40% | 0.006 | $17,001,954.55 |
| CDT | Castle Minerals | -15% | -14% | -55% | 115% | 0.028 | $29,984,789.52 |
| GMD | Genesis Minerals | -15% | -24% | -35% | -46% | 0.95 | $323,498,751.66 |
| SPQ | Superior Resources | -15% | -28% | 9% | 335% | 0.05 | $90,164,682.15 |
| NES | Nelson Resources. | -16% | 7% | -30% | -62% | 0.016 | $4,708,754.62 |
| HCH | Hot Chili Ltd | -16% | 28% | -22% | -46% | 1 | $129,000,822.48 |
| PKO | Peako Limited | -16% | 5% | 24% | -19% | 0.021 | $8,721,184.83 |
| MVL | Marvel Gold Limited | -16% | -13% | -42% | -60% | 0.026 | $19,720,942.36 |
| BNR | Bulletin Res Ltd | -17% | -7% | -19% | 81% | 0.125 | $38,036,843.00 |
| OZM | Ozaurum Resources | -17% | -17% | -9% | -33% | 0.1 | $7,320,180.00 |
| ICG | Inca Minerals Ltd | -17% | -30% | -71% | -75% | 0.035 | $16,866,315.87 |
| GCY | Gascoyne Res Ltd | -17% | -23% | -25% | -11% | 0.275 | $112,899,342.31 |
| NWM | Norwest Minerals | -17% | -4% | -31% | -38% | 0.044 | $9,550,617.64 |
| STK | Strickland Metals | -17% | -12% | -17% | -8% | 0.044 | $60,828,621.39 |
| RDT | Red Dirt Metals Ltd | -17% | 22% | -5% | 131% | 0.6 | $185,778,199.86 |
| OKR | Okapi Resources | -17% | 41% | -10% | -55% | 0.26 | $38,062,877.44 |
| TG1 | Techgen Metals Ltd | -18% | 3% | 43% | -13% | 0.165 | $8,620,641.12 |
| OBM | Ora Banda Mining Ltd | -18% | -3% | 12% | -39% | 0.056 | $78,317,276.27 |
| ADN | Andromeda Metals Ltd | -18% | -52% | -77% | -67% | 0.046 | $146,170,396.30 |
| DCX | Discovex Res Ltd | -18% | -25% | -33% | -6% | 0.0045 | $16,512,840.49 |
| GIB | Gibb River Diamonds | -18% | -11% | -2% | -28% | 0.054 | $11,421,510.03 |
| RSG | Resolute Mining | -19% | -25% | -36% | -49% | 0.215 | $242,928,261.18 |
| KAI | Kairos Minerals Ltd | -19% | 31% | 41% | 27% | 0.038 | $74,635,552.66 |
| WCN | White Cliff Min Ltd | -19% | 75% | -28% | 62% | 0.021 | $15,699,670.60 |
| M2R | Miramar | -20% | -17% | -41% | -47% | 0.1 | $6,418,666.30 |
| MKG | Mako Gold | -20% | -25% | -44% | -45% | 0.051 | $19,876,563.30 |
| MOH | Moho Resources | -22% | 12% | -49% | -52% | 0.029 | $5,066,957.80 |
| FAU | First Au Ltd | -25% | -20% | -33% | -57% | 0.006 | $6,519,876.64 |
| MOM | Moab Minerals Ltd | -42% | -42% | -42% | -54% | 0.016 | $11,593,379.19 |


Get the latest Stockhead news delivered free to your inbox.