Pic: Bloomberg Creative / Bloomberg Creative Photos via Getty Images
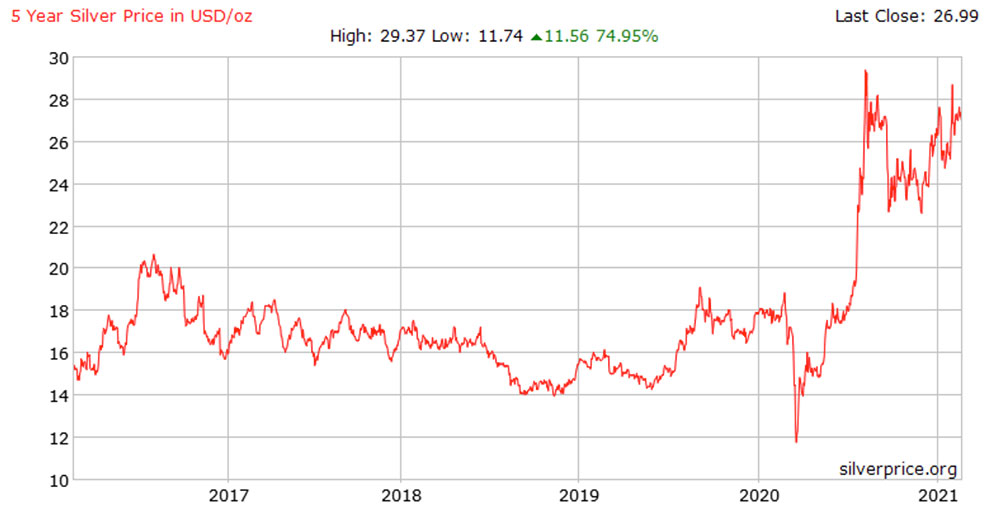
Gold Digger: is it time to get proper bullish on silver?
Mining
Pic: Bloomberg Creative / Bloomberg Creative Photos via Getty Images
Mining
The main argument for an upcoming silver bull run is twofold.
One, people use precious metals — gold and then silver — as a way to store value if they are worried about currency debasement or inflation.
If you believe we are only in the beginning stages of a gold bull run, then silver will invariably come along for the ride.
Two — silver actually has growing industrial uses, particularly in solar panels and electric vehicles/ charging infrastructure.
“About 10 per cent of the physical demand for silver currently is for solar panels,”says Sarah Kiernan of Goldman Sachs’ Global Markets Division.
“Both the US and Chinese administrations have very aggressive growth targets for solar power, which will increase demand [even more].”
Solar power generation is expected to double by 2025 to about 1,100 gigawatts from just over 600GW currently.
The industry – which barely existed until comparatively recently – will consume 888 million ounces of silver over the 2020s, or about 81 million ounces of silver per year, according to metals consultancy CRU.
Precious metals consultancy Metals Focus reckons it will consume 1 billion ounces from 2020 to 2030.
Current global silver production is just under 1 billion ounces per year.
Then there’s electric vehicles. Modern day petrol or diesel-driven vehicles use ~15 to 28 grams of silver, a figure that has been rising over recent years.
EV’s each consume between 25 to 50 grams of silver, with additional amounts needed for charging stations, large stationary batteries, and associated infrastructure.
The number of EVs sold will rise to ~30 million in 2028 – that’s 26.5 million to 53 million ounces of silver per year alone.
The main reasons people are bullish on silver – its use as a ‘hedge’ and in Environmental, Social and Governance (ESG) applications — hasn’t changed over the past year or so, Kiernan says.
Perhaps now these bulls are now even more convicted in their views.
“US investors and asset managers were probably interested as a ‘thought experiment’ on what could happen on either inflation or ESG investment,” she says.
“They are now really focussed on that as a real risk to their portfolios – and potentially something they need to allocate into.”
Here’s how ASX-listed gold & silver stocks are performing:
Scroll or swipe to reveal table. Click headings to sort. Best viewed on a laptop
| CODE | COMPANY | 1 WEEK RETURN % | 1 MONTH RETURN % | 6 MONTH RETURN % | 1 YEAR RETURN % | PRICE | MARKET CAP |
|---|---|---|---|---|---|---|---|
| ANL | Amani Gold | 50 | -25 | 0 | 0 | 0.0015 | $ 18,773,993.49 |
| SI6 | SI6 Metals | 41 | -4 | 200 | 700 | 0.024 | $ 33,384,016.80 |
| HMX | Hammer Metals | 37 | 238 | 98 | 400 | 0.115 | $ 68,257,898.07 |
| MLS | Metals Australia | 25 | 25 | 0 | 150 | 0.0025 | $ 10,477,258.94 |
| SRN | Surefire Resources | 25 | 20 | 275 | 900 | 0.03 | $ 28,308,047.68 |
| TNR | Torian Resources | 24 | 64 | 188 | 432 | 0.046 | $ 33,528,090.72 |
| MSR | Manas Resources | 20 | -14 | 20 | 200 | 0.006 | $ 15,181,504.79 |
| TMZ | Thomson Resources | 18 | 50 | 346 | 772 | 0.165 | $ 51,379,171.69 |
| VKA | Viking Mines | 17 | 17 | 362 | 515 | 0.048 | $ 42,776,924.04 |
| MVL | Marvel Gold | 16 | 6 | -13 | -24 | 0.052 | $ 26,449,491.02 |
| ENR | Encounter Resources | 15 | -9 | 3 | 50 | 0.15 | $ 39,445,462.88 |
| BBX | BBX Minerals | 12 | 0 | 32 | 57 | 0.29 | $ 132,388,562.00 |
| BCN | Beacon Minerals | 11 | 11 | 8 | 21 | 0.04 | $ 114,929,977.72 |
| CDT | Castle Minerals | 11 | 11 | -47 | 0 | 0.01 | $ 7,325,008.18 |
| AAU | Antilles Gold | 11 | 15 | 119 | 248 | 0.094 | $ 18,148,173.36 |
| AVW | Avira Resources | 10 | -31 | -8 | 175 | 0.055 | $ 6,875,200.00 |
| SVY | Stavely Minerals | 10 | -8 | 11 | 5 | 0.72 | $ 189,197,052.70 |
| SFM | Santa Fe Minerals | 10 | 31 | 60 | 64 | 0.115 | $ 8,374,160.74 |
| AYM | Australia United Min | 9 | 50 | 300 | 500 | 0.012 | $ 22,110,929.82 |
| PAK | Pacific American | 9 | -4 | 140 | 14 | 0.024 | $ 7,646,037.60 |
| CGN | Crater Gold Min | 9 | 32 | 127 | 127 | 0.025 | $ 30,687,396.68 |
| TSC | Twenty Seven Co. | 8 | -7 | 30 | -19 | 0.0065 | $ 13,821,085.72 |
| CXU | Cauldron Energy | 8 | -18 | 43 | 233 | 0.04 | $ 17,175,981.46 |
| RDN | Raiden Resources | 8 | -7 | 286 | 350 | 0.027 | $ 20,995,276.34 |
| KCN | Kingsgate | 8 | 2 | 53 | 81 | 0.98 | $ 228,488,199.40 |
| DGO | DGO Gold | 8 | -6 | -11 | 53 | 2.7 | $ 194,912,132.20 |
| AOP | Apollo Consolidated | 7 | 32 | 4 | 56 | 0.375 | $ 106,789,618.30 |
| PUA | Peak Minerals | 7 | 3 | 3 | 152 | 0.03 | $ 17,826,376.91 |
| DRE | Dreadnought Resources | 6 | -26 | 31 | 240 | 0.017 | $ 42,975,101.38 |
| CY5 | Cygnus Gold | 6 | 0 | -3 | 309 | 0.18 | $ 19,452,617.64 |
| MEG | Megado | 6 | 6 | 0.19 | $ 7,501,527.63 | ||
| GBR | Great Boulder Resources | 5 | -20 | -27 | 15 | 0.043 | $ 7,898,510.34 |
| AMG | Ausmex Mining Gp | 5 | 6 | 21 | 36 | 0.068 | $ 36,840,633.80 |
| AQI | Alicanto Min | 5 | -12 | -36 | 37 | 0.115 | $ 37,595,508.02 |
| NSM | Northstaw | 4 | 10 | 0.48 | $ 19,800,000.00 | ||
| EMU | EMU NL | 4 | 20 | 141 | 18 | 0.053 | $ 18,889,488.11 |
| RMX | Red Mount Mining | 4 | -4 | 50 | 238 | 0.0135 | $ 16,267,192.36 |
| YRL | Yandal Resources | 4 | -5 | 53 | 71 | 0.405 | $ 36,441,080.13 |
| ARL | Ardea Resources | 4 | 12 | -1 | 15 | 0.575 | $ 72,772,231.74 |
| NUS | Nusantara Resources | 4 | 2 | -9 | -3 | 0.29 | $ 66,489,172.03 |
| GUL | Gullewa Limited | 3 | 0 | -10 | 125 | 0.09 | $ 16,413,579.00 |
| MRZ | Mont Royal Resources | 3 | 13 | 22 | 22 | 0.3 | $ 9,963,261.00 |
| SMI | Santana Minerals | 3 | -11 | 11 | -51 | 0.155 | $ 17,675,058.58 |
| DEX | Duke Exploration | 3 | 10 | 19 | 19 | 0.32 | $ 24,330,000.00 |
| BRB | Breaker Res NL | 2 | 5 | -14 | -16 | 0.21 | $ 65,168,185.80 |
| TAM | Tanami Gold NL | 2 | -7 | 9 | 62 | 0.084 | $ 99,883,248.91 |
| KAU | Kaiser Reef | 2 | 5 | 26 | 0.43 | $ 36,787,174.52 | |
| RED | Red 5 Limited | 2 | -12 | -25 | -27 | 0.22 | $ 433,599,838.54 |
| G88 | Golden Mile Res | 2 | -10 | -25 | -13 | 0.045 | $ 5,658,843.09 |
| HXG | Hexagon Energy | 2 | -15 | 58 | 75 | 0.093 | $ 27,108,479.43 |
| RVR | Red River Resources | 2 | -11 | 57 | 137 | 0.235 | $ 119,088,104.41 |
| MAU | Magnetic Resources | 2 | 16 | -9 | 92 | 1.45 | $ 313,448,496.65 |
| IVR | Investigator Resources | 2 | 21 | 69 | 343 | 0.089 | $ 117,830,000.00 |
| BC8 | Black Cat Syndicate | 1 | 0 | -10 | 97 | 0.72 | $ 81,668,373.58 |
| AME | Alto Metals Limited | 1 | -22 | -16 | 124 | 0.076 | $ 32,359,999.60 |
| NWM | Norwest Minerals | 1 | -4 | -28 | -49 | 0.086 | $ 9,360,255.39 |
| TLM | Talisman Mining | 1 | -6 | -30 | 15 | 0.094 | $ 17,543,068.19 |
| CDV | Cardinal Reso | 1 | 0 | 49 | 191 | 1.08 | $ 595,926,904.68 |
| AXE | Archer Materials | 1 | 51 | 61 | 330 | 0.795 | $ 188,406,515.91 |
| AL8 | Alderan Resource | 0 | -13 | -40 | 483 | 0.105 | $ 29,794,109.20 |
| BAR | Barra Resources | 0 | -4 | -20 | 26 | 0.024 | $ 16,262,594.42 |
| DTR | Dateline Resources | 0 | 25 | -17 | 25 | 0.0025 | $ 20,525,195.19 |
| GBZ | GBM Rsources | 0 | -4 | -19 | 125 | 0.125 | $ 54,127,257.50 |
| GSM | Golden State Mining | 0 | -15 | -55 | 49 | 0.145 | $ 8,212,249.00 |
| GSN | Great Southern | 0 | 5 | -38 | 33 | 0.08 | $ 35,946,613.18 |
| KGM | Kalnorth Gold | 0 | 0 | 0 | 225 | 0.013 | $ 11,625,120.78 |
| LNY | Laneway Res | 0 | -14 | -33 | 0 | 0.006 | $ 22,650,395.60 |
| LEX | Lefroy Exploration | 0 | 3 | -33 | 3 | 0.205 | $ 24,601,981.74 |
| MAT | Matsa Resources | 0 | 8 | -41 | -33 | 0.1 | $ 26,843,524.19 |
| MTC | Metalstech | 0 | -15 | -21 | 183 | 0.17 | $ 24,916,498.46 |
| M2R | Miramar | 0 | -17 | 0.25 | $ 10,556,880.00 | ||
| OAU | Ora Gold Limited | 0 | 14 | 33 | 26 | 0.024 | $ 20,180,285.33 |
| PNM | Pacific Nickel Mines | 0 | -5 | 30 | -43 | 0.057 | $ 8,537,151.52 |
| PF1 | Pathfinder Resources | 0 | -14 | 0.305 | $ 15,165,877.95 | ||
| PNX | PNX Metals | 0 | 14 | -27 | 33 | 0.008 | $ 29,217,548.09 |
| RND | Rand Mining | 0 | -6 | -26 | -23 | 1.7 | $ 105,259,831.25 |
| REZ | Resourc & En Grp | 0 | -19 | 83 | 147 | 0.042 | $ 18,130,593.14 |
| SAR | Saracen Mineral | 0 | -2 | -16 | 14 | 4.69 | $ 5,265,564,163.30 |
| TAR | Taruga Minerals | 0 | 4 | -26 | 285 | 0.05 | $ 22,402,873.79 |
| XTC | Xantippe Res | 0 | 0 | -33 | 0 | 0.002 | $ 8,149,128.80 |
| ZNC | Zenith Minerals | 0 | 9 | 9 | 131 | 0.12 | $ 35,323,203.60 |
| MOH | Moho Resources | -1 | -11 | -41 | -10 | 0.079 | $ 7,026,237.68 |
| ANX | Anax Metals | -1 | 42 | 178 | 580 | 0.068 | $ 17,653,004.84 |
| NAG | Nagambie Resources | -2 | 30 | 5 | 36 | 0.06 | $ 28,996,076.07 |
| KRM | Kingsrose Mining | -2 | 12 | 41 | 33 | 0.048 | $ 35,040,352.90 |
| GRL | Godolphin Resources | -2 | 7 | 7 | 0 | 0.23 | $ 19,344,021.89 |
| GIB | Gibb River Diamonds | -3 | -7 | 38 | 69 | 0.076 | $ 15,863,208.38 |
| CEL | Challenger Exp | -3 | 42 | 73 | 115 | 0.355 | $ 201,635,920.34 |
| FFX | Firefinch | -3 | 29 | 63 | 194 | 0.25 | $ 211,115,289.87 |
| DTM | Dart Mining NL | -3 | -11 | -25 | 163 | 0.16 | $ 16,491,003.54 |
| PRS | Prospech Limited | -3 | -20 | 0 | 0.16 | $ 10,403,294.24 | |
| GWR | GWR Group | -3 | -26 | 331 | 303 | 0.31 | $ 92,349,865.12 |
| KAI | Kairos Minerals | -3 | -6 | -18 | 269 | 0.031 | $ 51,961,124.83 |
| TRY | Troy Resources | -4 | -7 | -37 | -9 | 0.082 | $ 62,877,792.74 |
| BDC | Bardoc Gold | -4 | -13 | -9 | -9 | 0.077 | $ 137,077,432.70 |
| TIE | Tietto Minerals | -4 | -3 | -36 | 36 | 0.38 | $ 168,326,118.72 |
| CBY | Canterbury Resources | -4 | 14 | 20 | -43 | 0.12 | $ 10,561,799.40 |
| TTM | Titan Minerals | -4 | 9 | -14 | 0 | 0.12 | $ 142,431,554.25 |
| FML | Focus Minerals | -4 | -10 | -20 | 56 | 0.35 | $ 63,961,997.75 |
| KSN | Kingston Resources | -4 | -6 | -19 | 21 | 0.23 | $ 69,472,676.77 |
| MKR | Manuka Resources | -4 | 12 | -18 | 0.46 | $ 43,919,631.45 | |
| MEU | Marmota Limited | -4 | -12 | -14 | 13 | 0.044 | $ 43,584,016.05 |
| EMR | Emerald Res NL | -4 | -12 | 19 | 62 | 0.745 | $ 383,970,919.22 |
| MTH | Mithril Resources | -5 | 0 | -40 | 91 | 0.021 | $ 49,354,893.86 |
| RGL | Riversgold | -5 | -28 | -29 | 320 | 0.042 | $ 16,652,900.92 |
| GMN | Gold Mountain | -5 | -7 | -16 | -32 | 0.041 | $ 30,494,259.38 |
| HWK | Hawkstone Mng | -5 | 64 | 128 | 720 | 0.041 | $ 64,550,875.44 |
| CAZ | Cazaly Resources | -5 | -11 | -7 | 82 | 0.04 | $ 14,427,730.68 |
| FAU | First Au | -5 | 12 | 6 | 58 | 0.019 | $ 9,685,523.45 |
| OKR | Okapi Resources | -5 | -10 | -12 | 138 | 0.19 | $ 8,544,314.25 |
| SAU | Southern Gold | -5 | -14 | -39 | -46 | 0.095 | $ 20,266,231.82 |
| NES | Nelson Resources. | -5 | 8 | 28 | 179 | 0.092 | $ 12,998,952.72 |
| OBM | Ora Banda Mining | -5 | -15 | -26 | 63 | 0.275 | $ 223,188,818.61 |
| KZR | Kalamazoo Resources | -5 | -22 | -41 | -32 | 0.455 | $ 61,542,473.98 |
| DEG | De Grey Mining | -5 | -10 | 1 | 353 | 0.84 | $ 1,070,012,810.63 |
| OKU | Oklo Resources | -5 | -8 | -49 | -20 | 0.175 | $ 88,205,217.10 |
| S2R | S2 Resources | -5 | -15 | -10 | 92 | 0.175 | $ 53,531,500.43 |
| CST | Castile Resources | -6 | -21 | -46 | 10 | 0.17 | $ 32,952,169.97 |
| MDI | Middle Island Res | -6 | -26 | -48 | 117 | 0.25 | $ 30,421,011.50 |
| BAT | Battery Minerals | -6 | 60 | 237 | 357 | 0.032 | $ 67,362,026.85 |
| MEI | Meteoric Resources | -6 | -11 | 23 | 125 | 0.064 | $ 84,127,458.50 |
| ADT | Adriatic Metals | -6 | 9 | -6 | 32 | 2.18 | $ 453,650,000.00 |
| CHN | Chalice Mining | -6 | -2 | 203 | 1347 | 4.27 | $ 1,463,007,143.72 |
| BNR | Bulletin Res | -6 | -12 | -3 | 168 | 0.075 | $ 13,267,687.48 |
| CYL | Catalyst Metals | -6 | -11 | -29 | -33 | 1.9 | $ 187,253,352.32 |
| LCL | Los Cerros Limited | -6 | 21 | 53 | 272 | 0.145 | $ 65,822,684.62 |
| NVA | Nova Minerals | -6 | -17 | 190 | 169 | 0.145 | $ 250,491,997.05 |
| GOR | Gold Road Res | -7 | -4 | -36 | -29 | 1.14 | $ 1,033,911,578.90 |
| CWX | Carawine Resources | -7 | -13 | -15 | -31 | 0.205 | $ 24,500,227.95 |
| WWI | West Wits Mining | -7 | 1 | 183 | 423 | 0.068 | $ 90,424,771.31 |
| MZZ | Matador Mining | -7 | 0 | -27 | 52 | 0.335 | $ 61,495,671.24 |
| MML | Medusa Mining | -7 | 6 | -24 | 14 | 0.8 | $ 171,495,473.33 |
| RDS | Redstone Resources | -7 | -7 | -19 | 63 | 0.013 | $ 6,882,404.49 |
| AGG | AngloGold Ashanti | -7 | -3 | -34 | -5 | 5.65 | $ 507,592,182.85 |
| VAN | Vango Mining | -7 | -5 | -48 | -52 | 0.062 | $ 64,065,083.66 |
| CHZ | Chesser Resources | -8 | -16 | -3 | 85 | 0.185 | $ 81,151,312.50 |
| AWV | Anova Metals | -8 | -17 | -35 | 127 | 0.024 | $ 32,961,166.60 |
| CAI | Calidus Resources | -8 | -2 | -30 | 58 | 0.44 | $ 143,791,348.68 |
| CTO | Citigold Corp | -8 | -8 | -8 | 140 | 0.012 | $ 32,648,078.51 |
| GNM | Great Northern | -8 | -14 | -54 | 71 | 0.012 | $ 10,895,035.25 |
| NAE | New Age Exploration | -8 | 0 | 20 | 300 | 0.012 | $ 14,244,364.92 |
| RXL | Rox Resources | -8 | -8 | -43 | 20 | 0.036 | $ 75,843,653.13 |
| SIH | Sihayo Gold | -8 | -37 | -61 | -27 | 0.012 | $ 47,910,998.37 |
| NCM | Newcrest Mining | -8 | -8 | -30 | -12 | 24.17 | $ 19,695,343,600.08 |
| ZAG | Zuleika Gold | -8 | -4 | 34 | 104 | 0.047 | $ 18,044,108.41 |
| GED | Golden Deeps | -8 | -15 | -45 | -39 | 0.011 | $ 9,298,217.28 |
| SKY | SKY Metals | -8 | -18 | 22 | -34 | 0.165 | $ 41,930,470.76 |
| AQX | Alice Queen | -9 | 10 | -35 | -9 | 0.032 | $ 35,090,034.21 |
| TSO | Tesoro Resources | -9 | -28 | 17 | 689 | 0.21 | $ 102,402,423.08 |
| ADN | Andromeda Metals | -9 | 8 | 487 | 569 | 0.29 | $ 635,054,708.97 |
| AMI | Aurelia Metals | -9 | -13 | -34 | -9 | 0.365 | $ 469,044,079.50 |
| ARV | Artemis Resources | -9 | -41 | -5 | 152 | 0.083 | $ 95,488,202.63 |
| ONX | Orminex | -9 | 18 | -29 | -49 | 0.04 | $ 21,580,313.04 |
| PRX | Prodigy Gold NL | -9 | -11 | -46 | -30 | 0.039 | $ 23,225,104.24 |
| BRVDA | Big River Gold | -9 | 5 | -24 | 65 | 0.37 | $ 69,738,429.17 |
| BYH | Bryah Resources | -9 | -13 | 16 | 23 | 0.058 | $ 9,058,889.97 |
| DDD | 3D Resources Limited | -10 | 13 | -10 | 80 | 0.0045 | $ 18,101,860.46 |
| ALY | Alchemy Resource | -10 | 0 | 0 | 67 | 0.018 | $ 11,428,138.70 |
| CLA | Celsius Resource | -10 | -6 | 137 | 275 | 0.045 | $ 41,370,249.81 |
| WCN | White Cliff Min | -10 | -44 | 80 | 350 | 0.018 | $ 9,826,731.58 |
| WMX | Wiluna Mining Corp | -10 | -13 | -9 | 5 | 1.15 | $ 144,869,697.88 |
| RRL | Regis Resources | -10 | -14 | -46 | -26 | 3.18 | $ 1,664,088,006.75 |
| PNR | Pantoro Limited | -10 | -21 | -23 | 98 | 0.2 | $ 274,637,654.46 |
| SLZ | Sultan Resources | -10 | -1 | 16 | 163 | 0.2 | $ 13,559,205.86 |
| WAF | West African Res | -10 | -15 | -27 | 43 | 0.785 | $ 721,514,771.66 |
| LCY | Legacy Iron Ore | -10 | -28 | 420 | 1633 | 0.026 | $ 162,428,201.44 |
| WGX | Westgold Resources. | -10 | -17 | -14 | -10 | 1.94 | $ 843,471,987.30 |
| KTA | Krakatoa Resources | -10 | -20 | -30 | 94 | 0.06 | $ 17,573,850.00 |
| CMM | Capricorn Metals | -11 | -7 | -22 | 25 | 1.54 | $ 550,359,691.20 |
| PRU | Perseus Mining | -11 | -5 | -28 | -5 | 1.11 | $ 1,398,160,831.80 |
| TBR | Tribune Res | -11 | -11 | -40 | -3 | 5.16 | $ 267,587,192.70 |
| ARN | Aldoro Resources | -11 | 37 | 143 | 24 | 0.28 | $ 18,894,624.84 |
| HAW | Hawthorn Resources | -11 | -24 | -24 | 37 | 0.08 | $ 26,014,217.81 |
| KWR | Kingwest Resources | -11 | -11 | 0 | -18 | 0.16 | $ 26,127,955.86 |
| TMX | Terrain Minerals | -11 | -27 | -56 | 100 | 0.008 | $ 5,150,327.06 |
| VMC | Venus Metals Cor | -11 | -2 | -17 | -9 | 0.2 | $ 30,215,736.60 |
| RMS | Ramelius Resources | -11 | -18 | -40 | 6 | 1.27 | $ 1,066,362,618.46 |
| ALK | Alkane Resources | -11 | -10 | -39 | -23 | 0.71 | $ 428,679,936.00 |
| MGV | Musgrave Minerals | -11 | -17 | -50 | 210 | 0.31 | $ 162,632,999.45 |
| RSG | Resolute Mining | -11 | -9 | -54 | -45 | 0.62 | $ 700,971,868.31 |
| SSR | SSR Mining Inc. | -12 | -12 | 19.34 | $ 346,148,315.50 | ||
| AGS | Alliance Resources | -12 | 6 | -4 | 71 | 0.19 | $ 39,523,255.46 |
| SBM | St Barbara Limited | -12 | -9 | -43 | -25 | 2.03 | $ 1,474,198,458.26 |
| RML | Resolution Minerals | -12 | -12 | -59 | -55 | 0.03 | $ 9,651,591.11 |
| GTR | Gti Resources | -12 | -24 | -27 | 267 | 0.022 | $ 14,179,395.96 |
| GML | Gateway Mining | -12 | -3 | 38 | 107 | 0.029 | $ 55,205,432.40 |
| ERM | Emmerson Resources | -12 | -13 | -34 | -17 | 0.065 | $ 32,834,063.43 |
| AUC | Ausgold Limited | -12 | 16 | 22 | 194 | 0.05 | $ 67,618,176.13 |
| EVN | Evolution Mining | -12 | -9 | -34 | -4 | 4.13 | $ 7,227,661,769.55 |
| AUT | Auteco Minerals | -13 | -5 | -49 | 262 | 0.105 | $ 156,717,893.60 |
| SBR | Sabre Resources | -13 | -30 | 100 | 250 | 0.007 | $ 11,781,445.54 |
| MKG | Mako Gold | -13 | -17 | -31 | 41 | 0.096 | $ 25,209,677.00 |
| HRZ | Horizon | -13 | -9 | -33 | -5 | 0.1 | $ 59,637,396.00 |
| NXM | Nexus Minerals | -13 | -21 | 28 | 112 | 0.091 | $ 23,194,408.75 |
| AGC | AGC | -14 | 0.16 | $ 10,497,729.02 | |||
| SLR | Silver Lake Resource | -14 | -17 | -42 | -19 | 1.37 | $ 1,225,389,687.85 |
| HRN | Horizon Gold | -14 | -8 | -6 | 91 | 0.44 | $ 38,631,448.68 |
| PKO | Peako Limited | -14 | 4 | 3 | 91 | 0.025 | $ 4,993,408.60 |
| ADV | Ardiden | -14 | -18 | 0 | 200 | 0.018 | $ 40,718,175.80 |
| NPM | Newpeak Metals | -14 | 0 | 20 | 20 | 0.003 | $ 14,377,412.81 |
| THR | Thor Mining PLC | -14 | -6 | 67 | 150 | 0.015 | $ 7,233,231.68 |
| SVL | Silver Mines | -15 | 7 | -11 | 153 | 0.235 | $ 262,014,904.25 |
| PDI | Predictive Disc | -15 | 2 | -32 | 740 | 0.058 | $ 58,987,269.16 |
| BNZ | Benzmining | -15 | -26 | 1.04 | $ 19,948,133.42 | ||
| FFR | Firefly Resources | -15 | -23 | -8 | 236 | 0.115 | $ 37,473,691.50 |
| TRM | Truscott Mining Corp | -15 | 28 | 15 | 188 | 0.023 | $ 2,942,655.51 |
| VRC | Volt Resources | -15 | 21 | -11 | 31 | 0.017 | $ 41,093,733.92 |
| NST | Northern Star | -15 | -19 | -30 | -25 | 10.42 | $ 12,332,490,701.40 |
| DCX | Discovex Res | -16 | 14 | 0 | 60 | 0.008 | $ 10,167,394.65 |
| AAR | Anglo Australian | -17 | -29 | -39 | -13 | 0.1 | $ 58,311,830.02 |
| E2M | E2 Metals | -17 | -39 | 109 | 135 | 0.365 | $ 56,907,244.28 |
| NML | Navarre Minerals | -18 | -22 | 0 | 22 | 0.14 | $ 76,319,901.14 |
| DCN | Dacian Gold | -18 | -20 | 3 | -55 | 0.385 | $ 217,038,336.06 |
| STN | Saturn Metals | -19 | -39 | -55 | -15 | 0.365 | $ 39,047,223.60 |
| A1G | African Gold . | -19 | -22 | 13 | 40 | 0.19 | $ 15,362,711.91 |
| SPQ | Superior Resources | -20 | -40 | 33 | 156 | 0.012 | $ 17,901,956.25 |
| AAJ | Aruma Resources | -20 | -9 | -29 | 150 | 0.075 | $ 7,735,147.67 |
| SNG | Siren Gold | -21 | -28 | 0.49 | $ 27,245,107.80 | ||
| AZS | Azure Minerals | -21 | -28 | 100 | 169 | 0.35 | $ 109,370,430.96 |
| BGL | Bellevue Gold | -27 | -27 | -31 | 37 | 0.745 | $ 642,654,092.12 |
| STK | Strickland Metals | -29 | -41 | -57 | 20 | 0.024 | $ 10,528,788.03 |
| GMR | Golden Rim Resources | -31 | -25 | -36 | 0 | 0.009 | $ 22,763,647.22 |
| MCT | Metalicity Limited | -32 | -24 | -54 | 275 | 0.013 | $ 22,970,925.32 |
| MHC | Manhattan Corp | -36 | -33 | -42 | 200 | 0.018 | $ 23,873,016.47 |


Get the latest Stockhead news delivered free to your inbox.