Gold Digger: silver will be ‘turbo-charged version of gold’, Goldman Sachs says
Pic: Bloomberg Creative / Bloomberg Creative Photos via Getty Images
Silver’s solid bull case has nothing to do with #silversqueeze, which was a load of nonsense.
Big banks and hedge funds do not have massive, short positions in the silver market to suppress the price of the precious metal.
Which means there is no opportunity to force a ‘short-squeeze’ GameStop-style and generate extraordinary gains.
But such efforts still have an obvious, short-lived impact on precious metals prices, Metals Focus says.
The silver price briefly touched $US30/oz on Thursday – an eight-year high – before falling back to $US27/oz.
Aussie silver stocks flew in response. Briefly.
“As the past few days have illustrated, concentrated investor buying can certainly fuel strong rallies,” the research consultancy says.
“These, however, are likely to be short-lived, in the absence of more structural bullish factors.
“[But] in the current environment, given an already bullish silver outlook, Reddit-type investor campaigns could bring forward the forthcoming rally.”
This imminent rally could be helped along by booming industrial demand. Silver is used in solar cells (PV) as a conductor of heat and electricity.
From 2020 through 2030, the PV sector is expected to consume a cumulative 888 million ounces of silver — equivalent to an average of 81 million ounces per year.
Current annual global silver production is just under 1 billion ounces per year.
That’s why Jeffrey Currie, global head of commodities research at Goldman Sachs, favours silver over gold as an investment in precious metals.
“I like to say that it’s a turbo-charged version of gold,” Currie says.
“That’s what silver has that gold doesn’t have: It goes into solar panels.”
Winners & Losers
Here’s how 187 ASX-listed gold/silver stocks performed over the past week:
Scroll or swipe to reveal table. Click headings to sort. Best viewed on a laptop:
| CODE | COMPANY | 1 WEEK PRICE CHANGE % | 1 MONTH PRICE CHANGE % | 6 MONTH PRICE CHANGE % | 1 YEAR PRICE CHANGE % | PRICE | MARKET CAP |
|---|---|---|---|---|---|---|---|
| ANX | Anax Metals | 92 | 109 | 285 | 840 | 0.094 | $ 13,169,702.02 |
| NES | Nelson Resources | 31 | 15 | 57 | 166 | 0.11 | $ 15,887,608.88 |
| TMZ | Thomson Resources | 23 | 33 | 332 | 548 | 0.16 | $ 46,299,702.78 |
| TNR | Torian Resources | 21 | 38 | 122 | 363 | 0.04 | $ 30,084,198.57 |
| MLS | Metals Australia | 20 | 100 | 50 | 200 | 0.003 | $ 10,477,258.94 |
| GED | Golden Deeps | 18 | 18 | 30 | -48 | 0.013 | $ 9,295,360.14 |
| MCT | Metalicity | 18 | 5 | -9 | 362 | 0.02 | $ 33,140,897.71 |
| CEL | Challenger Exploration | 15 | 64 | 68 | 103 | 0.345 | $ 187,825,240.86 |
| MKR | Manuka Resources | 13 | 0 | -23 | 0 | 0.425 | $ 37,909,576.62 |
| NAG | Nagambie Resources | 13 | 16 | -12 | 6 | 0.052 | $ 25,996,481.99 |
| SVL | Silver Mines | 13 | -5 | 10 | 131 | 0.24 | $ 255,281,718.27 |
| DCX | Discovex Resources | 13 | 0 | 13 | 80 | 0.009 | $ 9,569,312.61 |
| AOP | Apollo Consolidated | 12 | 7 | -6 | 49 | 0.34 | $ 92,837,978.55 |
| FAU | First Au | 12 | -10 | 6 | 90 | 0.019 | $ 10,223,608.08 |
| TMX | Terrain Minerals | 11 | 0 | -23 | 150 | 0.01 | $ 7,357,610.09 |
| SFM | Santa Fe Minerals | 11 | 12 | 48 | 50 | 0.105 | $ 7,645,972.85 |
| DRE | Drednought Resources | 10 | -4 | 144 | 340 | 0.022 | $ 49,760,643.70 |
| AQI | Alicanto Min | 10 | 5 | 38 | 100 | 0.11 | $ 35,960,920.71 |
| TAM | Tanami Gold | 10 | 1 | 16 | 123 | 0.089 | $ 102,233,443.00 |
| RXL | Rox Resources | 12 | -29 | -38 | 42 | 0.037 | $ 73,793,824.67 |
| PAK | Pacific American Hld | 9 | 4 | 100 | 5 | 0.024 | $ 7,646,037.60 |
| SKY | SKY Metals | 9 | -10 | 37 | 85 | 0.185 | $ 46,863,467.32 |
| KWR | Kingwest Resources | 9 | 6 | 19 | 36 | 0.185 | $ 28,433,363.73 |
| AGC | AGC | 9 | 0 | 0 | 0 | 0.19 | $ 12,529,547.54 |
| CLA | Celsius Resource | 9 | -11 | 168 | 325 | 0.051 | $ 38,230,685.97 |
| AAJ | Aruma Resources | 8 | -14 | 0 | 100 | 0.09 | $ 9,748,405.28 |
| GTR | Gti Resources | 8 | 18 | -4 | 225 | 0.026 | $ 16,112,949.95 |
| BRV | Big River Gold | 8 | 2 | 41 | 206 | 0.052 | $ 77,260,755.78 |
| MML | Medusa Mining | 8 | 9 | -5 | 13 | 0.865 | $ 185,007,237.89 |
| SLZ | Sultan Resources | 8 | -15 | 11 | 223 | 0.2 | $ 13,906,877.80 |
| RDS | Redstone Resources | 8 | 0 | -13 | 75 | 0.014 | $ 7,411,820.22 |
| CTO | Citigold Corp | 8 | 0 | 0 | 180 | 0.014 | $ 35,368,751.72 |
| MTH | Mithril Resources | 7 | 0 | -8 | 156 | 0.023 | $ 50,089,803.50 |
| MZZ | Matador Mining | 7 | -17 | -26 | 33 | 0.32 | $ 56,371,031.97 |
| AQX | Alice Queen | 6 | 3 | -15 | 27 | 0.033 | $ 37,113,161.35 |
| GSN | Great Southern | 6 | 1 | -42 | 56 | 0.084 | $ 39,131,756.12 |
| AUC | Ausgold Limited | 6 | 4 | 46 | 209 | 0.051 | $ 65,017,477.05 |
| SPQ | Superior Resources | 6 | 31 | 89 | 202 | 0.017 | $ 23,410,250.49 |
| AAU | Antilles Gold | 6 | 47 | 110 | 151 | 0.088 | $ 16,196,756.87 |
| THR | Thor Mining PLC | 6 | 13 | 125 | 157 | 0.018 | $ 8,137,385.64 |
| TRM | Truscott Mining Corp | 6 | 6 | 6 | 138 | 0.019 | $ 2,430,889.34 |
| BRB | Breaker Res NL | 5 | -5 | -22 | -18 | 0.2 | $ 68,426,595.09 |
| GMR | Golden Rim Resources | 5 | 0 | -25 | 17 | 0.0105 | $ 21,085,456.15 |
| HRZ | Horizon | 5 | 0 | -18 | 5 | 0.115 | $ 68,157,024.00 |
| WWI | West Wits Mining | 4 | -10 | 255 | 446 | 0.071 | $ 86,758,902.20 |
| AXE | Archer Materials | 4 | 58 | 110 | 239 | 0.83 | $ 169,227,409.50 |
| SRN | Surefire Rescs NL | 4 | -8 | 243 | 1100 | 0.024 | $ 23,427,349.80 |
| ARN | Aldoro Resources | 4 | 43 | 100 | 79 | 0.25 | $ 15,520,584.69 |
| CMM | Capricorn Metals | 4 | -8 | -16 | 39 | 1.72 | $ 572,718,053.66 |
| HRN | Horizon Gold | 4 | 6 | -4 | 214 | 0.53 | $ 46,533,335.91 |
| MHC | Manhattan Corp | 4 | 0 | -13 | 440 | 0.027 | $ 35,809,524.71 |
| ADN | Andromeda Metals | 4 | -8 | 496 | 536 | 0.28 | $ 581,236,513.29 |
| BGL | Bellevue Gold | 4 | -11 | -2 | 120 | 1.04 | $ 863,965,435.10 |
| KAI | Kairos Minerals | 3 | -18 | -16 | 453 | 0.031 | $ 50,269,959.51 |
| MEI | Meteoric Resources | 3 | -11 | 60 | 213 | 0.072 | $ 94,643,390.81 |
| FML | Focus Minerals | 3 | -8 | -14 | 46 | 0.365 | $ 67,616,969.05 |
| SSR | SSR Mining Inc. | 3 | -16 | 0 | 0 | 22 | $ 386,465,710.42 |
| MGV | Musgrave Minerals | 3 | -3 | -49 | 307 | 0.37 | $ 197,292,491.13 |
| E2M | E2 Metals | 3 | -1 | 214 | 214 | 0.565 | $ 83,060,415.33 |
| FFX | Firefinch | 3 | 3 | 23 | 121 | 0.19 | $ 148,562,611.39 |
| EVN | Evolution Mining | 3 | -11 | -21 | 23 | 4.67 | $ 7,911,128,603.55 |
| CHZ | Chesser Resources | 3 | -18 | -9 | 95 | 0.205 | $ 96,930,734.38 |
| PDI | Predictive Disc | 2 | 4 | -17 | 627 | 0.0645 | $ 66,106,422.33 |
| GMN | Gold Mountain | 2 | 2 | -12 | -35 | 0.044 | $ 33,469,309.08 |
| HMX | Hammer Metals | 2 | 151 | 105 | 319 | 0.088 | $ 64,507,464.11 |
| CAI | Calidus Resources | 2 | -10 | -21 | 73 | 0.45 | $ 157,485,762.84 |
| RRL | Regis Resources | 2 | -7 | -38 | -18 | 3.61 | $ 1,807,455,588.87 |
| VMC | Venus Metals Cor | 2 | 12 | -6 | 34 | 0.235 | $ 36,258,883.92 |
| MEU | Marmota Limited | 2 | 2 | -8 | 20 | 0.048 | $ 45,521,083.43 |
| GRL | Godolphin Resources | 2 | 0 | 2 | 26 | 0.24 | $ 20,601,119.25 |
| EMU | EMU NL | 2 | 21 | 113 | 28 | 0.051 | $ 18,176,677.24 |
| EMR | Emerald Res NL | 2 | -9 | 33 | 81 | 0.815 | $ 422,625,709.74 |
| SBM | St Barbara Limited | 2 | -10 | -36 | -19 | 2.22 | $ 1,544,734,269.66 |
| CDV | Cardinal Reso | 1 | 0 | 50 | 179 | 1.08 | $ 595,926,904.68 |
| RSG | Resolute Mining | 1 | -17 | -49 | -37 | 0.695 | $ 767,205,430.67 |
| GOR | Gold Road Res | 1 | -16 | -36 | -20 | 1.19 | $ 1,029,511,955.16 |
| SBR | Sabre Resources | 0 | -20 | 129 | 300 | 0.008 | $ 13,464,509.19 |
| RED | Red 5 Limited | 0 | -20 | -17 | -27 | 0.215 | $ 423,745,296.76 |
| AWV | Anova Metals | 0 | -14 | -33 | 203 | 0.024 | $ 34,394,260.80 |
| GSM | Golden State Mining | 0 | -28 | -58 | 88 | 0.145 | $ 8,778,611.00 |
| TSO | Tesoro Resources | 0 | -17 | 39 | 515 | 0.25 | $ 127,378,623.83 |
| RML | Resolution Minerals | 0 | -13 | -54 | -43 | 0.033 | $ 9,651,591.11 |
| MSR | Manas Res | 0 | -14 | 20 | 200 | 0.006 | $ 16,561,641.59 |
| LEX | Lefroy Exploration | 0 | -13 | -32 | 8 | 0.2 | $ 24,001,933.40 |
| TTM | Titan Minerals | 0 | 0 | -21 | -12 | 0.115 | $ 131,037,029.91 |
| NUS | Nusantara Resources | 0 | -7 | -19 | -16 | 0.27 | $ 61,903,711.89 |
| MEG | Megado | 0 | -7 | 0 | 0 | 0.19 | $ 7,704,271.62 |
| G88 | Golden Mile Res | 0 | -18 | -22 | -10 | 0.045 | $ 5,412,806.43 |
| KSN | Kingston Resources | 0 | -6 | 9 | 39 | 0.23 | $ 70,890,486.50 |
| XTC | Xantippe Res | 0 | 0 | -20 | 0 | 0.002 | $ 8,149,128.80 |
| KGM | Kalnorth Gold | 0 | 0 | 30 | 225 | 0.013 | $ 11,625,120.78 |
| ALY | Alchemy Resource | 0 | 0 | 8 | 67 | 0.018 | $ 12,100,382.15 |
| CY5 | Cygnus Gold Limited | 0 | 0 | 13 | 260 | 0.18 | $ 19,452,617.64 |
| CAZ | Cazaly Resources | 0 | -10 | 23 | 87 | 0.043 | $ 15,149,117.21 |
| NPM | Newpeak Metals | 0 | 17 | 75 | 40 | 0.0035 | $ 14,004,487.53 |
| NML | Navarre Minerals | 0 | -21 | 32 | 72 | 0.165 | $ 87,222,744.16 |
| GML | Gateway Mining | 0 | -14 | 55 | 107 | 0.031 | $ 59,093,472.12 |
| BAR | Barra Resources | 0 | -8 | 4 | 14 | 0.024 | $ 16,262,594.42 |
| TAR | Taruga Minerals | 0 | -9 | 0 | 243 | 0.048 | $ 21,945,672.29 |
| OAU | Ora Gold Limited | 0 | -4 | 28 | 10 | 0.023 | $ 18,498,594.88 |
| GBZ | GBM Rsources | 0 | -11 | 14 | 90 | 0.125 | $ 56,292,347.80 |
| TSC | Twenty Seven Co. | 0 | 9 | 20 | -25 | 0.006 | $ 12,757,925.28 |
| SAU | Southern Gold | 0 | -9 | -35 | -38 | 0.1 | $ 20,692,889.33 |
| MAU | Magnetic Resources | 0 | 20 | -1 | 141 | 1.4 | $ 291,831,358.95 |
| FFR | Firefly Resources | 0 | -22 | 107 | 249 | 0.145 | $ 41,970,534.48 |
| PUA | Peak Minerals | 0 | -17 | 19 | 162 | 0.025 | $ 15,982,268.95 |
| DDD | 3D Resources Limited | 0 | 25 | 25 | 67 | 0.005 | $ 18,076,860.46 |
| CHN | Chalice Mining | 0 | -6 | 280 | 1290 | 4.03 | $ 1,343,368,709.07 |
| WAF | West African Res | -1 | -18 | -17 | 95 | 0.895 | $ 796,305,937.02 |
| WGX | Westgold Resources. | -1 | -15 | -2 | 8 | 2.29 | $ 962,151,462.90 |
| STN | Saturn Metals | -1 | -30 | -49 | -2 | 0.445 | $ 46,639,739.30 |
| KRM | Kingsrose Mining | -1 | 20 | 20 | 44 | 0.0445 | $ 32,850,330.84 |
| NWM | Norwest Minerals | -1 | -3 | -19 | -19 | 0.089 | $ 9,686,775.93 |
| RMS | Ramelius Resources | -1 | -18 | -31 | 8 | 1.46 | $ 1,180,325,035.70 |
| AMI | Aurelia Metals | -1 | -8 | -26 | -3 | 0.4 | $ 493,730,610.00 |
| PRU | Perseus Mining | -1 | -13 | -23 | 1 | 1.16 | $ 1,447,219,106.60 |
| ERM | Emmerson Resources | -1 | -13 | -30 | -13 | 0.07 | $ 34,765,478.93 |
| KTA | Krakatoa Resources | -1 | -12 | -21 | 106 | 0.066 | $ 19,526,500.00 |
| NCM | Newcrest Mining | -2 | -8 | -30 | -15 | 24.93 | $ 20,291,429,869.90 |
| SLR | Silver Lake Resource | -2 | -19 | -38 | -6 | 1.54 | $ 1,353,218,108.53 |
| SVY | Stavely Minerals | -2 | -11 | 21 | 3 | 0.71 | $ 190,501,859.96 |
| A1G | African Gold . | -2 | -11 | 48 | 57 | 0.235 | $ 12,081,452.88 |
| DCN | Dacian Gold | -2 | 1 | 33 | -45 | 0.465 | $ 258,776,477.61 |
| NSM | Northstaw | -2 | 0 | 0 | 0 | 0.46 | $ 17,400,000.00 |
| TBR | Tribune Res | -2 | -3 | -21 | 24 | 6 | $ 317,431,865.85 |
| SAR | Saracen Mineral | -2 | -7 | -23 | 18 | 4.69 | $ 5,265,564,163.30 |
| ALK | Alkane Resources | -2 | -18 | -30 | -2 | 0.8 | $ 482,264,928.00 |
| MTC | Metalstech | -3 | -7 | -25 | 258 | 0.19 | $ 27,847,851.22 |
| S2R | S2 Resources | -3 | -16 | 42 | 85 | 0.185 | $ 58,254,868.12 |
| GIB | Gibb River Diamonds | -3 | -15 | 29 | 71 | 0.072 | $ 15,440,189.49 |
| BCN | Beacon Minerals | -3 | -3 | -3 | 3 | 0.036 | $ 106,309,612.75 |
| AGG | AngloGold Ashanti | -3 | -2 | -36 | 0 | 5.91 | $ 543,275,288.85 |
| LCY | Legacy Iron Ore | -3 | -33 | 500 | 1900 | 0.03 | $ 181,169,916.99 |
| OBM | Ora Banda Mining | -3 | -6 | -15 | 68 | 0.3 | $ 261,088,806.67 |
| TRY | Troy Resources | -3 | -14 | -7 | -10 | 0.084 | $ 62,877,792.74 |
| BDC | Bardoc Gold | -3 | -12 | 5 | 4 | 0.083 | $ 144,018,062.21 |
| MDI | Middle Island Res | -4 | -33 | -51 | 193 | 0.27 | $ 33,463,112.65 |
| KZR | Kalamazoo Resources | -4 | -12 | -18 | -17 | 0.535 | $ 70,708,374.36 |
| DEG | De Grey Mining | -4 | -18 | 14 | 1867 | 0.905 | $ 1,192,484,156.43 |
| BNZ | Benzmining | -4 | 10 | 0 | 0 | 1.22 | $ 19,904,446.80 |
| CYL | Catalyst Metals | -4 | 0 | -18 | -24 | 2.13 | $ 209,068,847.22 |
| DAU | Dampier Gold | -4 | -11 | 38 | 114 | 0.047 | $ 16,075,986.46 |
| RGL | Riversgold | -4 | -13 | -16 | 411 | 0.046 | $ 18,204,391.49 |
| ARV | Artemis Resources | -4 | -4 | 29 | 311 | 0.115 | $ 125,044,074.87 |
| WMX | Wiluna Mining Corp | -5 | -6 | 2 | 21 | 1.34 | $ 155,556,806.74 |
| AL8 | Alderan Resource | -5 | -17 | -38 | 456 | 0.1 | $ 28,900,285.92 |
| HAW | Hawthorn Resources | -5 | -20 | -9 | 71 | 0.1 | $ 33,351,561.30 |
| VKA | Viking Mines | -5 | 22 | 309 | 350 | 0.039 | $ 41,866,776.72 |
| OKR | Okapi Resources | -5 | -5 | -5 | 153 | 0.19 | $ 8,994,015.00 |
| RND | Rand Mining | -5 | 1 | -24 | -11 | 1.8 | $ 108,267,255.00 |
| GUL | Gullewa Limited | -5 | -33 | -8 | 181 | 0.087 | $ 16,413,579.00 |
| M2R | Miramar | -6 | -15 | 0 | 0 | 0.255 | $ 10,768,017.60 |
| SMI | Santana Minerals | -6 | 3 | -21 | -21 | 0.165 | $ 18,815,384.94 |
| YRL | Yandal Resources | -6 | -16 | 34 | 84 | 0.39 | $ 36,441,080.13 |
| NST | Northern Star | -6 | -10 | -24 | -9 | 11.96 | $ 8,987,871,158.49 |
| SNG | Siren Gold | -6 | -15 | 0 | 0 | 0.6 | $ 37,010,704.70 |
| RMX | Red Mount Min | -6 | 36 | 114 | 200 | 0.015 | $ 17,518,514.85 |
| PNR | Pantoro Limited | -6 | -2 | -14 | 122 | 0.22 | $ 316,889,601.30 |
| BC8 | Black Cat Syndicate | -6 | 1 | -13 | 97 | 0.72 | $ 81,668,373.58 |
| KCN | Kingsgate Consolid. | -7 | -8 | 67 | 64 | 0.9 | $ 204,734,475.70 |
| PRX | Prodigy Gold NL | -7 | -16 | -42 | -39 | 0.041 | $ 23,805,731.85 |
| AMG | Ausmex Mining Gp | -7 | 35 | 100 | 10 | 0.066 | $ 36,840,633.80 |
| BNR | Bulletin Res | -7 | 0 | 5 | 243 | 0.079 | $ 14,164,152.85 |
| NAE | New Age Exploration | -7 | 8 | 30 | 333 | 0.013 | $ 15,431,395.33 |
| GNM | Great Northern | -7 | 8 | -46 | 63 | 0.013 | $ 10,895,035.25 |
| NVA | Nova Minerals | -7 | -10 | 215 | 314 | 0.16 | $ 258,841,730.29 |
| DGO | DGO Gold Limited | -7 | -8 | -12 | 193 | 2.64 | $ 198,589,719.60 |
| RDN | Raiden Resources | -7 | -26 | 213 | 317 | 0.025 | $ 20,734,924.34 |
| AAR | Anglo Australian | -7 | -14 | -32 | 14 | 0.125 | $ 73,626,048.00 |
| OKU | Oklo Resources | -8 | -18 | -39 | -20 | 0.18 | $ 90,725,366.16 |
| BBX | BBX Minerals | -8 | 0 | 61 | 132 | 0.29 | $ 128,047,953.41 |
| GWR | GWR Group | -8 | -23 | 386 | 331 | 0.345 | $ 99,565,115.76 |
| TLM | Talisman Mining | -8 | -5 | -37 | 8 | 0.092 | $ 17,729,696.58 |
| RVR | Red River Resources | -8 | -28 | 92 | 130 | 0.23 | $ 119,088,104.41 |
| PNM | Pacific Nickel Mines | -8 | 14 | -5 | -43 | 0.057 | $ 8,537,151.52 |
| PRS | Prospech Limited | -8 | -15 | 0 | 0 | 0.17 | $ 11,053,500.13 |
| MOH | Moho Resources | -8 | -15 | -51 | 84 | 0.079 | $ 7,494,653.52 |
| VAN | Vango Mining | -8 | -8 | -46 | -52 | 0.067 | $ 71,298,238.27 |
| AVW | Avira Resources | -8 | -31 | 10 | 175 | 0.055 | $ 8,250,240.00 |
| DTM | Dart Mining NL | -8 | -13 | -33 | 127 | 0.165 | $ 16,491,003.54 |
| CXU | Cauldron Energy | -8 | 2 | 57 | 214 | 0.044 | $ 19,887,978.53 |
| AZS | Azure Minerals | -8 | -17 | 219 | 281 | 0.495 | $ 152,502,431.90 |
| REZ | Resourc & En Grp | -9 | -17 | 105 | 187 | 0.043 | $ 18,130,593.14 |
| CWX | Carawine Resources | -9 | -12 | 13 | 10 | 0.215 | $ 23,411,328.93 |
| CBY | Canterbury Resources | -9 | -9 | -29 | -47 | 0.096 | $ 8,449,439.52 |
| NXM | Nexus Minerals | -9 | -22 | 46 | 150 | 0.105 | $ 28,077,442.17 |
| MKG | Mako Gold | -9 | -5 | -13 | 38 | 0.105 | $ 27,010,368.21 |
| AGS | Alliance Resources | -9 | -14 | -13 | 52 | 0.155 | $ 34,322,827.11 |
| MAT | Matsa Resources | -9 | -5 | -33 | -23 | 0.1 | $ 26,843,524.19 |
| LCL | Los Cerros Limited | -9 | 20 | 105 | 213 | 0.15 | $ 70,316,928.30 |
| KAU | Kaiser Reef | -9 | 7 | 28 | 0 | 0.44 | $ 42,595,675.76 |
| PKO | Peako Limited | -9 | 21 | 83 | 83 | 0.029 | $ 5,569,571.13 |
| CST | Castile Resources | -10 | -38 | -27 | 0 | 0.18 | $ 34,949,271.18 |
| GBR | Greatbould Resources | -11 | -18 | -13 | 25 | 0.042 | $ 7,898,510.34 |
| TIE | Tietto Minerals | -11 | 4 | -35 | 48 | 0.4 | $ 181,974,182.40 |
| MRZ | Mont Royal Resources | -11 | -13 | 4 | 12 | 0.24 | $ 7,638,500.10 |
| HXG | Hexagon Energy | -12 | 105 | 80 | 145 | 0.115 | $ 34,638,612.61 |
| ARL | Ardea Resources | -12 | 2 | -20 | -3 | 0.45 | $ 56,175,056.08 |
| CGN | Crater Gold Min | -12 | 47 | 120 | 100 | 0.022 | $ 29,459,900.81 |
| ADV | Ardiden | -12 | 22 | 83 | 529 | 0.022 | $ 47,147,361.45 |
| STK | Strickland Metals | -12 | -12 | -5 | 80 | 0.036 | $ 15,582,606.28 |
| LNY | Laneway Res | -13 | 0 | -22 | 40 | 0.007 | $ 26,425,461.53 |
| WCN | White Cliff Min | -13 | -22 | 133 | 425 | 0.021 | $ 11,376,966.68 |
| ONX | Orminex | -13 | 44 | -15 | -45 | 0.039 | $ 21,040,805.21 |
| SI6 | SI6 Metals Limited | -14 | -47 | 171 | 533 | 0.019 | $ 26,429,013.30 |
| ZNC | Zenith Minerals | -14 | -4 | 9 | 131 | 0.125 | $ 36,795,003.75 |
| PUR | Pursuit Minerals | -14 | 48 | 66 | 566 | 0.031 | $ 21,331,635.07 |
| MVL | Marvel Gold Limited | -15 | -23 | -27 | -49 | 0.04 | $ 21,363,050.44 |
| ENR | Encounter Resources | -15 | -20 | -3 | 40 | 0.14 | $ 44,178,918.42 |
| BAT | Battery Minerals | -15 | 40 | 211 | 300 | 0.028 | $ 59,196,932.69 |
| BYH | Bryah Resources | -15 | -14 | 3 | 46 | 0.06 | $ 9,673,052.00 |
| VRC | Volt Resources | -16 | 60 | -6 | 45 | 0.016 | $ 41,093,733.92 |
| SIH | Sihayo Gold Limited | -18 | -18 | -44 | -3 | 0.014 | $ 55,281,921.20 |
| AUT | Auteco Minerals | -19 | 5 | -37 | 400 | 0.11 | $ 180,225,577.64 |
| HWK | Hawkstone Mng | -19 | 340 | 175 | 633 | 0.044 | $ 71,970,345.86 |
| CDT | Castle Minerals | -20 | -20 | -33 | 0 | 0.008 | $ 6,592,507.36 |
| DTR | Dateline Resources | -20 | 0 | 0 | 0 | 0.002 | $ 16,420,156.15 |
| AME | Alto Metals Limited | -21 | -23 | -10 | 133 | 0.077 | $ 33,577,537.60 |
| AYM | Australia United Min | -33 | 25 | 233 | 150 | 0.01 | $ 20,268,352.34 |
| ANL | Amani Gold | -33 | 0 | -33 | -60 | 0.001 | $ 9,386,996.75 |
WEEKLY WINNERS
(Up on no news)
WA explorer Nelson hit the golden motherlode near Kalgoorlie?
A first ever diamond drilling program at the Woodline project’s Redmill, Grindall and Socrates prospects is due for completion this month.
“Work carried out by Nelson at Socrates has returned several significant gold intersections, suggestive of a large gold system,” Nelson said in January.
“The company believes that Grindall, Redmill, and Harvey each have the potential to host a Tropicana scale gold deposit.”
Thomson is close to wrapping up its acquisition of the previously producing Webbs and Conrad silver projects in NSW.
The high-grade Webbs deposit produced ~55,000t of ore grading at least 23oz (about 710 grams per tonne) silver between 1884 to 1901.
Conrad was historically one of the largest silver mines in the New England region, producing about 3.5moz of silver along with lead and tin.
The explorer’s shares rose after it announced new high-grade copper-silver targets had been identified at its Khusib Springs mine in the southern African country of Namibia.
The project was a copper-silver mine from which 300,000 tonnes of ore grading 10 per cent copper, 1.8 per cent lead and 584 g/t silver was mined up until 2003.
A study identified remnant zones of copper-silver mineralisation on the margins of mined slopes as well as at depth, it said.
The first hole at the high-priority Cosmopolitan prospect has intersected visible gold:
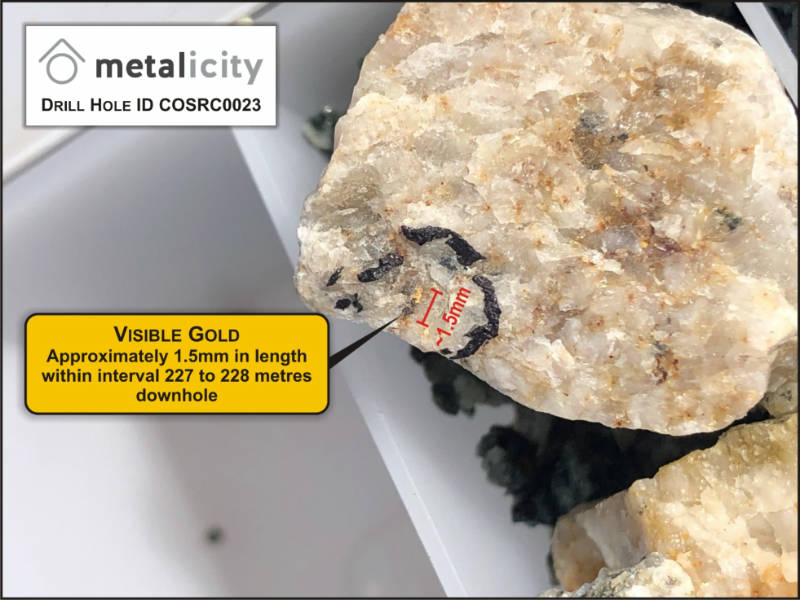
Cosmopolitan had produced about 360,000oz of gold at an average grade of nearly 15g/t – well above the 5g/t that is generally considered to be high-grade – between 1896 and 1922.
Managing director Jason Livingstone says visible gold is always exciting when drilling and is a “phenomenal” way to start the year’s exploration, though he cautioned that assays would be needed to really quantify the actual gold content.
Related Topics

Related Stories


UNLOCK INSIGHTS
Discover the untold stories of emerging ASX stocks.
Daily news and expert analysis, it's free to subscribe.
By proceeding, you confirm you understand that we handle personal information in accordance with our Privacy Policy.


