- Europe is poised to increase its coal purchases by 12% in 2022 as it turns its back on Russian energy
- Analysts at WoodMac say international coal trade to Europe could stall by 2030, but miners reckon they will be shipping the black stuff far longer than you expect
- Iron ore prices muted as China restocks ahead of national holiday
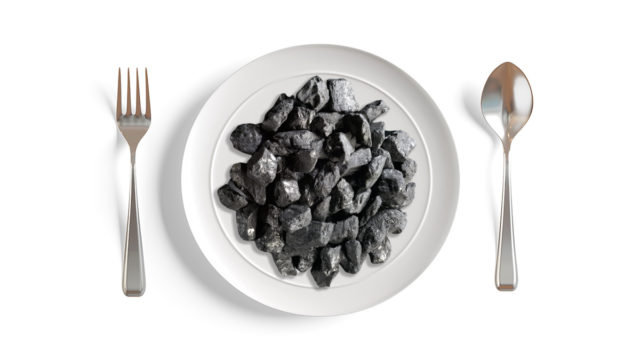
Thermal coal is enjoying a rare purple patch, driven to record levels by a combination of shortages, the war in Ukraine, substitution due to surging gas and oil prices and rising demand as economies and businesses open up post-Covid.
Prices for Newcastle thermal coal, the Asian benchmark, sit around US$438/t right now, depending on which spot price you accept.
Regardless, it’s an extraordinarily high watermark.
There are some groups and analysts who see the seaborne thermal coal trade becoming more challenged in the coming years though, as accelerating renewable energy targets and high prices prompt a faster shift to renewables.
Wood Mackenzie is one such body.
While Australian companies have been redirecting coal sales to Europe after EU nations established boycotts against their main supplier Russia, WoodMac says the short term influx in traded coal will subside over the course of the decade, receding to virtually nothing.
It sounds strange given coal trade into Europe is expected to rise 12% or 14Mt to 98Mt in 2022.
But in a note last week, WoodMac senior research analyst Adam Woods said this will be a short term phenomenon.
“With many European nations increasing thermal coal use, an additional nine gigawatts (GW) of coal-fired capacity has been made available to meet energy demands and make up for the decline in Russian energy imports,” he said.
“Coal prices are surging, but they are still more affordable than record-high gas prices.
“While this scenario has made for a slight resurgence, we believe that this will be a relatively short-term event and we do not see companies making major investments to increase infrastructure or long-term production.”
While 9GW of capacity has been added, just 4.4GW is in use, with the rest reserved as back-up.
Met-thermal switch
Some analysts see millions of tonnes of met coal transitioning to thermal coal markets this year due to an unusual ~US$150-plus premium for thermal, something rarely seen given met coal’s status as a higher quality product in an industry (steelmaking) with fewer alternatives to its use.
US-Australian coal miner Coronado (ASX:CRN) has already begun shifting sales of its intermediate semi-soft product to the thermal market to take advantage of the arbitrage, with its boss Gerry Spindler saying the market was applying no premium for miners who took the high road by only supplying the less controversial coking market.
But WoodMac’s Anthony Knutson says that will be limited given harder grades of coal aren’t suited to energy production.
Woods meanwhile says as coal demands decrease this decade, European countries will be able to rely on lower grade domestic lignite mines to supply a smaller number of active plants.
“We expect higher European coal-fired generation to last until the middle of this decade. However, imported higher-quality coal generation will still be phased out completely by the end of the decade, although lower-quality domestic lignite generation could extend much further,” he said.
“The higher energy price outlook and supply security concerns make renewables more attractive.
“We think we will see an additional 35 GW of solar and 15 GW of wind by 2030 in Europe, driven by policy changes such as Germany’s doubling of its 2030 solar target to 205 GW from 100 GW.”
Coal miners aren’t in that camp
Predictably coal miners don’t agree with that glum assessment of their future.
Futures continue to command over US$250/t for contracts out to 2027.
Despite the big ESG discounts and troubles obtaining finance they face, companies operating in the space are trading at multi-year and in some cases all time highs.
Pure play miners like Whitehaven Coal (ASX:WHC), New Hope Corp (ASX:NHC), Stanmore (ASX:SMR) and Yancoal (ASX:YAL) are all up close to or more than 100% year to date, and over 200% in the case of sector bellwether Whitehaven.
Over 1200 industry reps and onlookers hit up Bali for the Coaltrans forum, the first since the pandemic and one which Reuters reported mirrored the boom years of over a decade ago, with attendees up 30% on 2019 levels.
“For the short term, everybody seems to agree that based on recent developments, there is a lot of optimism that coal will remain a mainstay in power source. Not only in Asia, but even Europeans are buying,” Indonesian Coal Miners Association Hendra Sinadra said on the sidelines of the forum, according to Reuters.
| CODE | COMPANY | PRICE | 1 WEEK RETURN % | 1 MONTH RETURN % | 6 MONTH RETURN % | 1 YEAR RETURN % | MARKET CAP |
|---|
| NAE | New Age Exploration | 0.009 | -18% | 29% | -31% | -36% | $ 11,487,191.28 |
| CKA | Cokal Ltd | 0.22 | -2% | 0% | 22% | 42% | $ 197,704,285.80 |
| NCZ | New Century Resource | 1.165 | -22% | -36% | -39% | -50% | $ 156,533,902.04 |
| BCB | Bowen Coal Limited | 0.355 | 4% | -11% | 31% | 129% | $ 510,682,758.96 |
| LNY | Laneway Res Ltd | 0.006 | -8% | 20% | 0% | 25% | $ 39,228,098.46 |
| GRX | Greenx Metals Ltd | 0.245 | 0% | 2% | 26% | -15% | $ 62,137,013.68 |
| AKM | Aspire Mining Ltd | 0.1 | -9% | 11% | 5% | 23% | $ 50,763,698.50 |
| AVM | Advance Metals Ltd | 0.011 | -21% | 10% | -35% | -31% | $ 5,256,651.42 |
| AHQ | Allegiance Coal Ltd | 0.089 | -23% | -29% | -83% | -85% | $ 39,463,093.16 |
| YAL | Yancoal Aust Ltd | 5.49 | -10% | -6% | 16% | 116% | $ 7,130,372,959.80 |
| NHC | New Hope Corporation | 5.73 | 5% | 12% | 67% | 141% | $ 4,497,610,390.20 |
| TIG | Tigers Realm Coal | 0.0185 | -8% | -12% | 32% | 16% | $ 248,267,344.99 |
| SMR | Stanmore Resources | 2.04 | -7% | -16% | 15% | 145% | $ 1,784,735,762.04 |
| WHC | Whitehaven Coal | 8.45 | 2% | 6% | 89% | 168% | $ 7,564,108,767.32 |
| BRL | Bathurst Res Ltd. | 0.84 | -9% | -14% | -21% | -6% | $ 172,223,802.00 |
| CRN | Coronado Global Res | 1.52 | -11% | -17% | -23% | 18% | $ 2,497,916,057.70 |
| JAL | Jameson Resources | 0.07 | 0% | -13% | -13% | -13% | $ 24,374,231.84 |
| TER | Terracom Ltd | 1.02 | -1% | -10% | 108% | 518% | $ 751,547,171.92 |
| ATU | Atrum Coal Ltd | 0.007 | -13% | -7% | -40% | -81% | $ 6,277,251.58 |
| MCM | Mc Mining Ltd | 0.345 | -49% | 19% | 214% | 176% | $ 73,132,301.90 |
Iron ore in limbo as Chinese Covid-zero decision looms
The iron ore market is little changed from a week ago, trading at a touch below US$100/t.
China, the world’s biggest purchaser of iron ore and largest steel maker with almost 60% of the global crude steel market, will see its political leaders meet on October 16 for the Communist Party’s national congress.
It will be the first opportunity to reverse its austere Covid management policy, which has seen wave after wave of lockdowns.
The World Bank yesterday cut its growth forecast for China to just 2.8% for 2022, well below its official 5.5% GDP growth target.
That would see the rest of Asia grow at a faster pace than the economic powerhouse for the first time since 1990.
According to MySteel, Australian and Brazilian iron ore shipments, weak through the first part of the year, hit a three-month high last week, with 28.3Mt arriving at ports in China.
Prices have held steady despite the influx of available supply, though it’s worth noting demand is high from mills restocking ahead of the Chinese National Day Holiday, a major week-long break observed around the country.
In company news GWR Group (ASX:GWR) banked a further $5 million from the sale of the mining rights at its C4 iron ore deposit to private company Gold Valley Iron Ore Pty Ltd.
It previously traded the rights to mine the high grade JWD deposit to fellow ASX-listed junior CuFe (ASX:CUF).
GWR announced the sale of the mining rights in a staged $30 million deal in July.
“We are pleased to have received a total of $15,000,000 to date in agreed consideration following the execution of the Binding Term Sheet and we look forward to finalising a formal mining rights agreement with Gold Valley Iron Ore Pty Ltd,” GWR chairman Gary Lyons said.
“The grant of mining rights, to 2 of the 13 high grade iron ore deposits within the Wiluna West Iron Ore Project, accounts for approximately 24% of the available JORC mineral resource.
“Importantly GWR retains both legal and beneficial ownership to all tenements and all other deposits that comprise the Wiluna West Iron Ore Project. GWR is re-evaluating development models and assessing the status of mining approvals over the remaining deposits.”
| CODE | COMPANY | PRICE | 1 WEEK RETURN % | 1 MONTH RETURN % | 6 MONTH RETURN % | 1 YEAR RETURN % | MARKET CAP |
|---|
| ACS | Accent Resources NL | 0.027 | -10% | -36% | -50% | -51% | $ 12,582,736.64 |
| ADY | Admiralty Resources. | 0.009 | 0% | -10% | -47% | -44% | $ 11,732,212.38 |
| AKO | Akora Resources | 0.2 | -5% | 21% | -47% | -5% | $ 12,699,388.80 |
| BCK | Brockman Mining Ltd | 0.025 | -7% | -17% | -46% | -49% | $ 232,005,803.28 |
| BHP | BHP Group Limited | 37.2 | -2% | -13% | -16% | 11% | $ 183,382,704,127.20 |
| CIA | Champion Iron Ltd | 4.75 | -8% | -14% | -34% | -5% | $ 2,353,228,723.30 |
| CZR | CZR Resources Ltd | 0.015 | -12% | 7% | 88% | 88% | $ 55,781,172.43 |
| DRE | Dreadnought Resources Ltd | 0.105 | -9% | -5% | 163% | 176% | $ 334,678,690.61 |
| EFE | Eastern Resources | 0.03 | -3% | -3% | -42% | -32% | $ 29,195,190.30 |
| CUF | Cufe Ltd | 0.018 | -5% | -14% | -49% | -68% | $ 14,491,685.48 |
| FEX | Fenix Resources Ltd | 0.25 | -4% | -26% | -2% | 11% | $ 133,822,410.40 |
| FMG | Fortescue Metals Grp | 16.82 | -4% | -15% | -13% | 10% | $ 49,078,700,792.92 |
| FMS | Flinders Mines Ltd | 0.62 | 3% | 25% | 19% | -27% | $ 103,841,874.86 |
| GEN | Genmin | 0.22 | -2% | -12% | 13% | 16% | $ 69,405,523.25 |
| GRR | Grange Resources. | 0.725 | -3% | -46% | -33% | 64% | $ 810,137,088.60 |
| GWR | GWR Group Ltd | 0.083 | 0% | -2% | -46% | -36% | $ 27,303,415.68 |
| HAV | Havilah Resources | 0.29 | -15% | -24% | 66% | 49% | $ 91,825,370.90 |
| HAW | Hawthorn Resources | 0.09 | -6% | 6% | 22% | 76% | $ 30,016,405.17 |
| HIO | Hawsons Iron Ltd | 0.415 | -6% | 20% | 108% | 446% | $ 289,010,650.50 |
| IRD | Iron Road Ltd | 0.14 | 0% | 0% | -26% | -24% | $ 111,980,582.56 |
| JNO | Juno | 0.105 | -13% | -13% | 9% | -32% | $ 13,565,800.10 |
| LCY | Legacy Iron Ore | 0.019 | 0% | -5% | 0% | 36% | $ 121,729,697.78 |
| MAG | Magmatic Resrce Ltd | 0.096 | -31% | -52% | 13% | 2% | $ 25,198,732.61 |
| MDX | Mindax Limited | 0.059 | 0% | 0% | 0% | 9% | $ 115,533,663.12 |
| MGT | Magnetite Mines | 0.027 | 0% | 4% | -17% | 4% | $ 98,586,138.61 |
| MGU | Magnum Mining & Exp | 0.034 | -6% | -13% | -56% | -48% | $ 18,121,689.44 |
| MGX | Mount Gibson Iron | 0.415 | 0% | -3% | -33% | -13% | $ 473,623,539.87 |
| MIN | Mineral Resources. | 65.89 | -3% | 1% | 35% | 42% | $ 11,792,103,831.86 |
| MIO | Macarthur Minerals | 0.13 | -19% | -28% | -78% | -72% | $ 24,188,023.20 |
| PFE | Panteraminerals | 0.1 | -9% | -17% | -41% | -69% | $ 5,150,112.00 |
| PLG | Pearlgullironlimited | 0.028 | 0% | -15% | -62% | -84% | $ 1,537,264.62 |
| RHI | Red Hill Iron | 3.67 | -1% | 5% | 10% | 31% | $ 232,334,462.36 |
| RIO | Rio Tinto Limited | 90.39 | -2% | -8% | -23% | -9% | $ 32,585,359,264.92 |
| RLC | Reedy Lagoon Corp. | 0.014 | -7% | -7% | -55% | -56% | $ 7,246,549.86 |
| SHH | Shree Minerals Ltd | 0.009 | 0% | 0% | -50% | -10% | $ 11,146,382.03 |
| SRK | Strike Resources | 0.093 | -15% | -11% | -31% | -28% | $ 24,840,000.00 |
| SRN | Surefire Rescs NL | 0.0135 | -4% | -10% | 13% | 0% | $ 20,557,725.20 |
| TI1 | Tombador Iron | 0.02 | -9% | -26% | -51% | -44% | $ 23,568,832.10 |
| TLM | Talisman Mining | 0.14 | -3% | -13% | -22% | -3% | $ 25,344,832.10 |
| VMS | Venture Minerals | 0.025 | -4% | -17% | -40% | -53% | $ 41,936,439.80 |
| EQN | Equinoxresources | 0.16 | 0% | 0% | -11% | 0% | $ 7,200,000.16 |
You might be interested in