Pic: John W Banagan / Stone via Getty Images
Bulk Buys: Rio Tinto port issues dampen historic iron ore market
Mining
Pic: John W Banagan / Stone via Getty Images
Mining
In spite of China’s complaints about commodity prices, iron ore was relatively steady in June after a volatile May, with benchmark 62% fines opening the first full week of the new financial year above US$220/t.
Those price levels, up from around US$200/t at the start of the month, underpinned what Westpac head of financial market strategy Robert Rennie estimates will be another record month for Australian iron ore sales after the wash-up.
No thanks to Rio Tinto (ASX: RIO), which played an absolute shocker in June, having serious issues getting its Pilbara red dirt out at promised run rates.
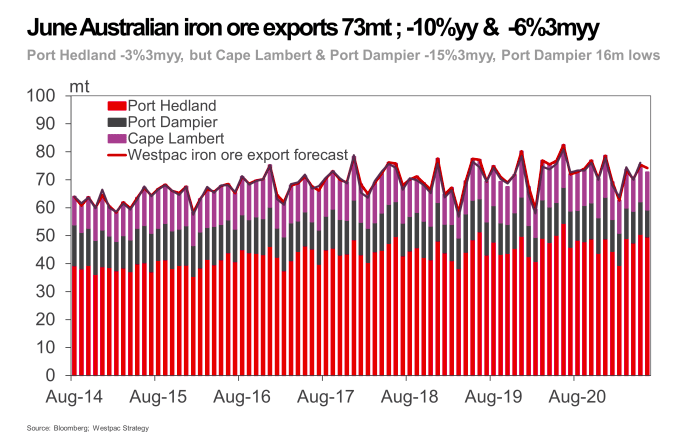
Exports hit a 16 month low from Port Dampier in June, Rennie wrote in a note on Friday, with volumes at Port Dampier and Cape Lambert down 15% year to date. Port Hedland is slightly softer at 3% down year to date.
“If May iron ore export volumes fell short of our expectations, then June exports really disappointed,” Rennie said.
“After just 76Mt in May, exports in June fell to 73.2Mt according to our shipping activity models.
“That’s -10%yy an -6%3myy. Given recent price gains and the weather-based drag on exports in Q1m we had expected to see a stronger rebound in Q2.”
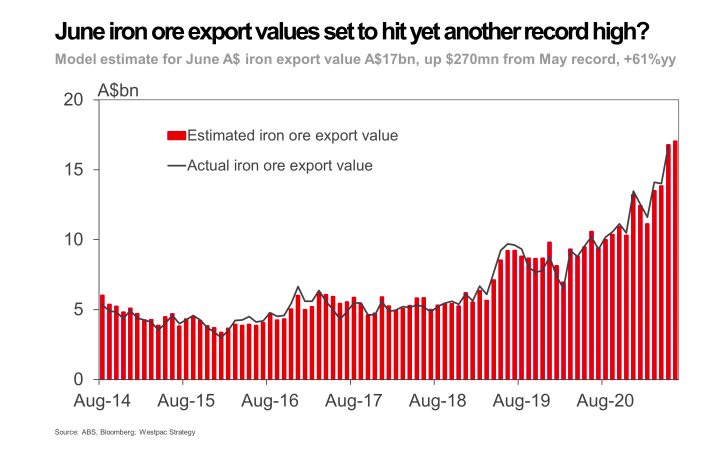
Despite all this Westpac’s analysis of shipping data suggests Australia’s total iron ore exports touched a new record high of $17 billion in June, up from a previous record of $16.59bn in May.
Imagine if they could ship it on time.
Many of the world’s biggest iron ore producer’s shipping issues revolved around its 45Mtpa East Intercourse Island berths in the Pilbara, which has a proclivity to catch on fire.
It closed for maintenance in mid-May and only started exporting again last week.
Analysis from Argus Media showed four ships left, suggesting it was still operating below capacity, with Rio using its rail and port infrastructure to get exports at other berths at Dampier and Cape Lambert.
According to Argus Rio loaded vessels with a 6.76 million deadweight tonne capacity (a metric that over-estimates actual product tonnes by about 5%) up from 6.05m the week before and 2% above its rolling average for this year of 6.62m a week.
BHP however, was able to push shipping 12% higher to prop up the big four of Rio, BHP, FMG and Roy Hill, to 17.97mdwt last week, 5 per cent better than average.
Argus estimates BHP has met the upper end of its 276-286Mt guidance range at 285Mt, though the official number will be revealed in its next quarterly review.
China is still keen on Pilbara ore, with 76% of shipments heading to the Middle Kingdom or 80% once unconfirmed destinations were taken into account.
The Chinese Communist Party celebrated its centenary last week, an affair that quickly became a celebration of Xi Jinping and Chinese uber-nationalism.

At one point he iterated a threat, according to many translations, that if China was crossed by its “enemies” it would leave their heads broken and blood flowing.
Other interpretations are milder, like the official State translation of “collision course”.
The celebrations also led to slowdowns in steel output — ostensibly to reduce air pollution in the lead up to the big event — alongside restrictions related to China’s broader pollution and emissions reduction targets.
Some of those restrictions were wound back in the steel city of Tangshan, which Reuters attributed for a near 6% rise in the most traded Dalian iron ore futures contract for September.
Steel and iron ore futures rose again Tuesday.
The Global Times, widely regarded as the official English language mouthpiece for the CCP, was quick to say iron ore demand would still head south and, quoting unnamed analysts, “not bode well” for Australia. Time, as always, will tell.
Fastmarkets reported prices Monday of 62% fines cfr Qingdao up US$3.84/t to US$221.82/t, with 65% fines from Brazil fetching a premium price up US$3.90 to US$255.50/t, while discounted 58% fines were up US$3.92 to US$184.28/t.
Magnetite Mines (ASX: MGT) released a PFS for its flagship Razorback magnetite project in South Australia this week, with plans now afoot to progress to a definitive feasibility study.
It came off the back of a maiden reserve for the deposit announced last week of 473Mt, which could support an operation producing 2.7Mtpa for 23 years from 2024.
That is based on the company’s preferred option of generating higher head grades through selective mining or ore sorting to produce a 67.5-68.5% iron ore concentrate through a 15.5Mtpa processing plant.
This product would generate a significant premium over the prevailing benchmark 62% price.
Capital estimates have come in at US$429-$506m (A$572-$675m), a big improvement on the $1.5b-plus estimate the project carried when it was last assessed in the early 2010s iron ore boom.
According to the study figures Razorback would carry a $669 NPV and 20% internal rate of return at benchmark iron ore prices of US$110/t, rising to $1.54b at higher price environment of US$150/t.
The project would breakeven at US$54/t, paying its capital cost back in 5 years under the US$110/t scenario and 2.3 years at the higher price.
“The PFS is a significant milestone for the Company, and defines our optimised go forward scope, which has been developed following rigorous and methodical testing of various options,” Magnetite Mines CEO Peter Schubert said.
“The resulting scope meets our objectives of practical scale, capital efficiency, attractive returns, high quality product and an expected low emissions footprint.
“The economic results are attractive and provide an excellent basis to continue towards development.”
Carpentaria Resources (ASX: CAP), another junior at a similar stage with its 10Mtpa Hawsons iron project in New South Wales, was the biggest iron ore winner in the past week before coming out of a trading halt yesterday to announce a $35.6 million placement to progress its bankable feasibility study.
Scroll or swipe to reveal table. Click headings to sort.
| CODE | COMPANY | PRICE | 1 WEEK RETURN % | 1 MONTH RETURN % | 6 MONTH RETURN % | 1 YEAR RETURN % | MARKET CAP |
|---|---|---|---|---|---|---|---|
| CAP | Carpentaria Resources | 0.215 | 39 | 65 | 367 | 1032 | $ 102,284,238.68 |
| JNO | Juno | 0.22 | 22 | 13 | $ 26,453,310.20 | ||
| GWR | GWR Group Ltd | 0.39 | 22 | 47 | -6 | 509 | $ 118,086,712.77 |
| BCK | Brockman Mining Ltd | 0.044 | 16 | 7 | -25 | 120 | $ 371,169,285.24 |
| FEX | Fenix Resources Ltd | 0.39 | 15 | 22 | 66 | 376 | $ 181,032,359.20 |
| RLC | Reedy Lagoon Corp. | 0.017 | 13 | -6 | 6 | 325 | $ 7,990,444.82 |
| GRR | Grange Resources. | 0.6275 | 13 | 21 | 99 | 151 | $ 729,123,379.74 |
| DRE | Drednought Resources | 0.027 | 13 | 17 | 23 | 286 | $ 61,707,294.03 |
| FEL | Fe Limited | 0.056 | 12 | 19 | 44 | 367 | $ 38,469,476.32 |
| MAG | Magmatic Resrce Ltd | 0.145 | 12 | -34 | -12 | -48 | $ 30,707,024.18 |
| TI1 | Tombador Iron | 0.093 | 11 | -5 | 58 | 342 | $ 92,590,185.98 |
| MIN | Mineral Resources. | 57 | 11 | 19 | 46 | 162 | $ 10,654,146,183.90 |
| SRK | Strike Resources | 0.26 | 11 | 16 | 86 | 478 | $ 67,500,000.00 |
| AKO | Akora Resources | 0.265 | 10 | -9 | -27 | $ 13,574,784.00 | |
| GEN | Genmin | 0.22 | 10 | -14 | $ 67,617,084.00 | ||
| MIO | Macarthur Minerals | 0.45 | 10 | -8 | -5 | 181 | $ 61,870,219.40 |
| HAW | Hawthorn Resources | 0.049 | 9 | -4 | -57 | -57 | $ 15,341,718.20 |
| SHH | Shree Minerals Ltd | 0.013 | 8 | -7 | -41 | 117 | $ 13,822,079.60 |
| LCY | Legacy Iron Ore | 0.014 | 8 | -7 | -67 | 367 | $ 89,666,339.24 |
| EFE | Eastern Iron | 0.016 | 7 | 33 | 71 | 243 | $ 11,923,708.22 |
| CZR | CZR Resources Ltd | 0.011 | 5 | -21 | -27 | -27 | $ 31,383,207.83 |
| FMG | Fortescue Metals Grp | 24 | 4 | 4 | -5 | 71 | $ 72,940,678,907.42 |
| VMS | Venture Minerals | 0.14 | 4 | 8 | 164 | 438 | $ 192,730,996.04 |
| MGU | Magnum Mining & Exp | 0.16 | 3 | -14 | 208 | 357 | $ 77,635,117.28 |
| RHI | Red Hill Iron | 0.97 | 3 | -16 | 313 | 506 | $ 58,081,804.53 |
| ACS | Accent Resources NL | 0.051 | 2 | 2 | 155 | 920 | $ 23,767,391.43 |
| BHP | BHP Group Limited | 49.07 | 1 | 1 | 11 | 35 | $ 142,726,500,039.30 |
| RIO | Rio Tinto Limited | 127.26 | 1 | 2 | 8 | 32 | $ 46,821,501,071.82 |
| MGX | Mount Gibson Iron | 0.93 | 1 | 10 | -2 | 44 | $ 1,092,941,855.76 |
| ADY | Admiralty Resources. | 0.017 | 0 | -6 | 42 | 183 | $ 21,358,067.79 |
| CIA | Champion Iron Ltd | 6.46 | -2 | -2 | 29 | 132 | $ 3,271,448,419.44 |
| HAV | Havilah Resources | 0.23 | -2 | -8 | 31 | 70 | $ 68,912,376.30 |
| FMS | Flinders Mines Ltd | 0.85 | -3 | -17 | -12 | 26 | $ 143,521,290.45 |
| TLM | Talisman Mining | 0.2 | -5 | -7 | 106 | 25 | $ 38,258,818.93 |
| SRN | Surefire Rescs NL | 0.014 | -7 | -36 | -48 | 250 | $ 15,311,945.74 |
| MDX | Mindax Limited | 0.069 | -7 | -13 | 2200 | 2200 | $ 129,232,499.48 |
| IRD | Iron Road Ltd | 0.235 | -10 | -31 | 47 | 265 | $ 186,185,630.80 |
| MGT | Magnetite Mines | 0.064 | -28 | -7 | 392 | 3387 | $ 229,377,502.10 |
GWR Group (ASX: GWR) is small fry when it comes to the Australian iron ore industry.
But in the current market, its investors will be smiling gleefully at the revenue generated from its operations near Wiluna last month.
GWR reported an average Platts realised price of US$214/t on two shipments through the Port of Geraldton totalling 116,209 wet metric tonnes. As Brian Taylor would say …

Tony Sage’s Fe Limited (ASX: FEL) is eager to get ore from the JWD deposit in the same Wiluna complex to market.
Highlighting the feverish urgency DSO juniors have to get product away in these heady times, Fe has been mining and crushing its ore before settling port and offtake options, which the Perth Glory owner this week said are “well advanced”.
It appointed a haulage contractor this week, three weeks since its first blast.
According to the company JWD will produce lump iron ore, a premium product that would currently generate around US$45/t over the benchmark price for each tonne Fe Limited sells.
 
Scroll or swipe to reveal table. Click headings to sort.
| CODE | COMPANY | PRICE | 1 WEEK RETURN % | 1 MONTH RETURN % | 6 MONTH RETURN % | 1 YEAR RETURN % | MARKET CAP |
|---|---|---|---|---|---|---|---|
| TER | Terracom Ltd | 0.145 | 32 | 16 | -12 | -9 | $ 105,505,068.20 |
| LNY | Laneway Res Ltd | 0.005 | 25 | 0 | -29 | -38 | $ 17,568,296.70 |
| MR1 | Montem Resources | 0.036 | 20 | -62 | -83 | $ 7,071,908.80 | |
| MCM | Mc Mining Ltd | 0.115 | 15 | 10 | -38 | 5 | $ 17,758,248.83 |
| CRN | Coronado Global Res | 0.94 | 13 | 21 | -13 | 2 | $ 1,508,808,357.00 |
| WHC | Whitehaven Coal | 2.15 | 10 | 22 | 31 | 42 | $ 2,116,920,675.60 |
| AKM | Aspire Mining Ltd | 0.08 | 8 | -4 | -24 | -11 | $ 42,641,506.74 |
| NHC | New Hope Corporation | 1.9 | 8 | 12 | 34 | 34 | $ 1,544,022,387.11 |
| ATU | Atrum Coal Ltd | 0.029 | 7 | -28 | -90 | -89 | $ 16,294,086.28 |
| CKA | Cokal Ltd | 0.062 | 7 | 2 | -19 | 44 | $ 59,173,268.03 |
| YAL | Yancoal Aust Ltd | 2.06 | 4 | -1 | -16 | 0 | $ 2,746,514,028.96 |
| BCB | Bowen Coal Limited | 0.072 | 3 | 14 | 60 | 24 | $ 70,449,282.86 |
| JAL | Jameson Resources | 0.087 | 2 | -3 | -21 | -36 | $ 26,389,874.43 |
| PDZ | Prairie Mining Ltd | 0.27 | 2 | 13 | 6 | 8 | $ 61,655,874.03 |
| AHQ | Allegiance Coal Ltd | 0.685 | 1 | 14 | 104 | 85 | $ 194,875,021.92 |
| TIG | Tigers Realm Coal | 0.008 | 0 | -6 | -27 | 16 | $ 104,533,618.94 |
| NCZ | New Century Resource | 0.22 | 0 | 2 | -6 | 26 | $ 272,233,810.35 |
| SMR | Stanmore Resources | 0.71 | -3 | -3 | -14 | 1 | $ 183,876,311.88 |
| BRL | Bathurst Res Ltd. | 0.425 | -3 | 35 | 9 | -15 | $ 75,218,714.12 |
| PAK | Pacific American Hld | 0.018 | -5 | -14 | -18 | 80 | $ 5,734,528.20 |
| NAE | New Age Exploration | 0.012 | -8 | -29 | -8 | 50 | $ 17,140,786.92 |
Thermal coal fob Newcastle capitalised further through the weak to extend near decade-long highs to US$143.40/t.
Meanwhile coking coal out of Dalrymple Bay Coal Terminal was trading at US$173.42/t according to Fastmarkets on Monday, up $5.
Non Australian and premium product was up even higher.
CBA analyst Vivek Dhar said in a note yesterday the bank believes coking prices are near their peak with steel margins declining in China.
The bank’s negative sentiment on steel demand and, in iron ore’s case, long term supply challenges from Brazil and Chinese controlled operations in Africa, will keep a lid on coking coal prices and send iron ore prices south.
The bank’s latest forecasts show iron ore dropping to US$170/t by the year’s end, US$100/t by the close of 2022 and US$65/t by December 2024.
Coking coal is projected to be more resilient but stagnant, moving from US$170/t in the September quarter this year down to US$150/t by early 2022 and then up to US$162/t by the end of 2024.
At Stockhead, we tell it like it is. While Magnetite Mines is a Stockhead advertiser, it did not sponsor this article.

Mining

Mining

Mining


Get the latest Stockhead news delivered free to your inbox.