Pic: Tuomas Lehtinen/Moment via Getty Images
Bulk Buys: BHP lauds cost control as iron ore prices wobble and African supply rush looms
Mining
Pic: Tuomas Lehtinen/Moment via Getty Images
Mining
Iron ore miners are focusing on costs as a miracle run that shocked market watchers fades and prices threaten to dip below US$100/t.
Majors also have one eye on rising supply from Africa as the continent’s first world class discovery Simandou moves steadily towards production under a consortium led by Rio Tinto (ASX:RIO) and Chinese steel giant Baowu.
In her introduction to BHP (ASX:BHP) shareholders this week, the new CFO of the world’s biggest miner Vandita Pant pointed to the risks to market balance posed by the development of Simandou.
Analysts think it could bring around 120Mt of additional iron ore supply into the market by the latter stages of the 2020s, most of it at a premium grade beyond 65% Fe that — unlike Pilbara ores — is attractive to low emissions steelmakers.
The added competition has the former chief commercial officer, who marketed BHP’s iron ore, coal and other products directly to Asian customers out of Singapore, cautious about the future of the market.
BHP has recently placed a price band of around US$80-100/t as the support level for margins, with any iron ore produced at costs above that viewed as ‘swing supply’.
But for the fourth year in a row BHP has been the world’s lowest cost iron ore producer, with its outlay coming in at US$15.98/t in the December half on a C1 basis (mining and processing costs without sustaining capital, royalties, marketing or freight).
“This year, we continue to see that the demand of iron ore from a demand-supply perspective will be balanced,” she said.
“However, in the long term we do see more supply coming in and this is not a surprise. For a very long time we have been saying that China demand is now in a plateau phase and African supply will come in later this decade.
“And that’s why it’s so important that (in a) commodity market which is going to become more competitive, we are very well positioned for that. And how do we get well positioned for it?
“(It) is by being really good at on our operations, as well as in our cost position … we are for the fourth year in a row, the lowest cost producer of iron ore globally.”
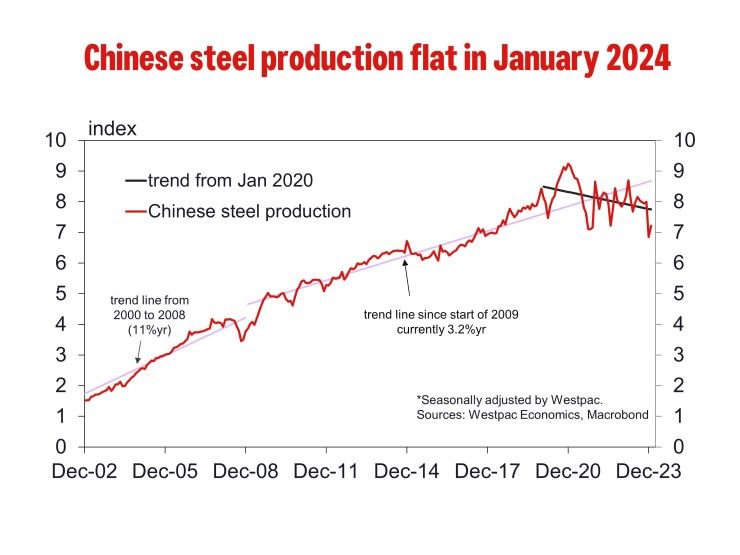
Iron ore started 2024 at over US$140/t, levels some commentators viewed as unsustainable given the parlous state of China’s property sector.
But fundamentals had been positive as well, with high export steel demand and low iron ore port stockpiles suggesting property drivers were being replaced by demand from infrastructure, renewables and manufacturing of automobiles and EVs.
That’s all flipped in recent weeks though, with iron ore prices falling below US$100/t for the first time this year on Friday.
They recovered on Monday on better data out of China where industrial output rose 7% in January and February to its highest rate in two years and fixed asset investment rose 4.2%. Singapore 62% Fe futures were up 1.75% to US$105.75/t yesterday.
But steel specific data remains bad. Property development investment fell 9% in the first two months of the year from an already low 2023 base.
At 3666RMB/t (US$509/t), Chinese rebar prices are at their lowest level in over six months according to MySteel, with rebar inventories more than doubling since January to around 3.9Mt.
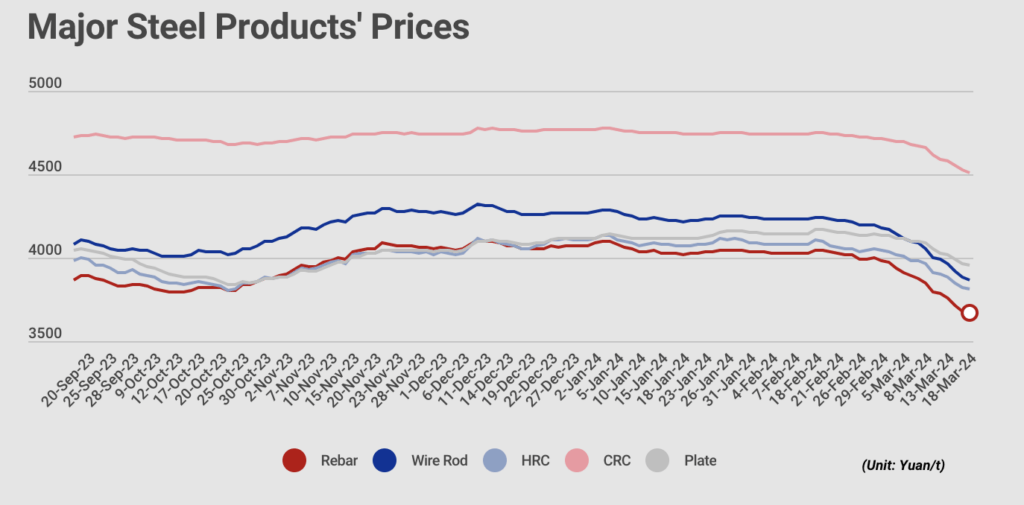
And at 14.3Mt, trader’s inventories have almost tripled after hitting a low of ~5.45Mt in mid-December.
The reality of it all is, as usual, a matter of debate in commodity circles.
China happy to play the weak demand for ironore game to result in lower #ironore prices – so it can build its stockpiles at lower cost – it's a classic cry-wolf/sabre-rattle tactic that 🇨🇳regularly applies – and the WWorld falls for it every time because they don't understand 🇨🇳.
— Keith Goode (@Eagleresa) March 19, 2024
Official figures from the Pilbara Ports Authority, which manages the ports of Port Hedland (BHP, FMG, MinRes and Roy Hill) and Dampier (Rio), showed total throughput was down 4% YoY in February, with Dampier starkly lower, though stronger than expected Brazilian supply has made up the gap.
“At the local government level there are also concerns about production controls, property market defaults and infrastructure funding while the economic data since the Lunar New Year has continued to be on the weak side of expectations,” Westpac’s Justin Smirk said in a note last week.
“In addition, even with the recent fall in iron ore and met coal prices, Chinese steel margins and blast furnace utilisation rates remain quite weak while iron ore inventories at Chinese ports are now at the highest level since March 2023.
“Even with weak iron ore exports from Australia, Brazil has been more than offsetting this and thus iron ore shipments from traditional markets have started to recover and are up +3% year to date.
“While recent trends in China remain a concern for iron ore, we expect the significant cuts in interest rates and deposit rates, plus an end to uncertainty over developers’ finances, should quickly see a rebuilding of the investment pipeline with investment driven by households rather than direct Government support.
“As such, Chinese construction activity should pick up as we move into the second half of the year rebalancing the iron ore market.”
While BHP has been looking into the crystal ball focused on the market, its biggest rival Rio Tinto has applied its foresight to emissions.
Coming in response to queries from investors and activists including a proposal from the Australasian Centre for Corporate Responsibility, the miner says it is “committed to enhance disclosure on plans to reduce Scope 3 emissions from processing iron ore”.
Currently 94% of the company’s 578Mt of Scope 3 CO2 equivalent emissions annually come from customers processing its materials, 69% or 400Mt from iron ore alone.
Rio wants to be Net Zero by 2050, but its analysis of the company’s targets and government commitments shows the trajectory will be closer to 2060 (unsurprising given that’s China’s Net Zero target date).
Quoth Rio’s PR scribes: “To provide more information and transparency for investors and interested stakeholders on our approach to this challenge, we will enhance disclosures prior to the 2025 AGM and thereafter by providing:
The announcement was, predictably, supported by the ACCR, whose company strategy lead Naomi Hogan said the move to make its Scope 3 reduction plans more transparent would “help ensure capital being allocated towards the best opportunities”.’
“This outcome should help Rio on its path to unlock large emissions reductions and also better assure long term value through the energy transition,” she said.
“These disclosures will help address one of the key barriers to decarbonisation of the sector, which is a lack of detailed information around the allocation of capital specifically towards steel decarbonisation.
“Investors need to see and measure where companies are investing and prioritising actions towards scope 3 emissions reductions.”
Scroll or swipe to reveal table. Click headings to sort.
| CODE | COMPANY | PRICE | WEEK RETURN % | MONTH RETURN % | 6 MONTH RETURN % | YEAR RETURN % | MARKET CAP |
|---|---|---|---|---|---|---|---|
| ACS | Accent Resources NL | 0.006 | 0% | -40% | -25% | -76% | $ 2,838,763.70 |
| ADY | Admiralty Resources. | 0.006 | 0% | -14% | 0% | -14% | $ 7,821,474.92 |
| AKO | Akora Resources | 0.15 | 3% | 11% | -6% | 7% | $ 14,247,422.10 |
| BCK | Brockman Mining Ltd | 0.024 | -11% | -8% | -11% | -8% | $ 222,725,571.14 |
| BHP | BHP Group Limited | 43.59 | 2% | -4% | -5% | 0% | $ 214,965,254,366.67 |
| CIA | Champion Iron Ltd | 7.1 | -4% | -14% | 7% | -4% | $ 3,642,040,718.78 |
| CZR | CZR Resources Ltd | 0.24 | -6% | -12% | 78% | 30% | $ 57,754,988.27 |
| CTM | Centaurus Metals Ltd | 0.3 | 9% | 3% | -58% | -63% | $ 148,499,201.10 |
| DRE | Dreadnought Resources Ltd | 0.017 | -6% | -15% | -68% | -73% | $ 59,186,740.32 |
| EFE | Eastern Resources | 0.0075 | -6% | -6% | -6% | -38% | $ 9,314,598.46 |
| CUF | Cufe Ltd | 0.013 | 0% | -19% | -13% | -28% | $ 13,753,348.38 |
| FEX | Fenix Resources Ltd | 0.24 | 0% | -4% | 4% | -2% | $ 163,235,211.20 |
| FMG | Fortescue Ltd | 24.54 | -2% | -14% | 16% | 15% | $ 72,940,678,907.42 |
| RHK | Red Hawk Mining Ltd | 0.725 | 14% | 9% | -5% | 58% | $ 132,797,128.90 |
| GEN | Genmin | 0.160002 | 0% | 0% | 0% | 0% | $ 79,339,701.97 |
| GRR | Grange Resources. | 0.415 | -12% | -7% | -11% | -46% | $ 462,935,479.20 |
| GWR | GWR Group Ltd | 0.105 | 12% | 21% | 14% | -5% | $ 33,727,748.78 |
| HAV | Havilah Resources | 0.155 | 3% | 0% | -31% | -53% | $ 52,245,469.65 |
| HAW | Hawthorn Resources | 0.07 | -9% | -16% | -42% | -20% | $ 23,451,092.91 |
| HIO | Hawsons Iron Ltd | 0.034 | -3% | 0% | -3% | -38% | $ 32,167,487.07 |
| IRD | Iron Road Ltd | 0.06 | 2% | 0% | -25% | -50% | $ 45,233,275.67 |
| JNO | Juno | 0.059 | -5% | -26% | -25% | -30% | $ 11,644,496.64 |
| LCY | Legacy Iron Ore | 0.014 | -7% | -7% | -7% | -22% | $ 107,989,675.67 |
| MAG | Magmatic Resrce Ltd | 0.09 | -9% | 210% | 73% | 1% | $ 25,188,170.63 |
| MDX | Mindax Limited | 0.039 | -3% | -3% | -28% | -61% | $ 79,776,792.42 |
| MGT | Magnetite Mines | 0.265 | 0% | 0% | -25% | -51% | $ 25,100,803.88 |
| MGU | Magnum Mining & Exp | 0.018 | 6% | -25% | -49% | 0% | $ 15,377,866.66 |
| MGX | Mount Gibson Iron | 0.435 | -3% | -16% | -4% | -15% | $ 534,548,842.52 |
| MIN | Mineral Resources. | 68.21 | 4% | 14% | -3% | -15% | $ 12,915,485,940.76 |
| MIO | Macarthur Minerals | 0.1 | -20% | -31% | -43% | -17% | $ 18,287,883.68 |
| PFE | Panteraminerals | 0.041 | -20% | -23% | -20% | -56% | $ 11,261,211.24 |
| PLG | Pearlgullironlimited | 0.025 | -4% | -4% | 0% | -29% | $ 5,113,544.75 |
| RHI | Red Hill Minerals | 5.4 | 2% | 4% | 27% | 22% | $ 345,078,198.00 |
| RIO | Rio Tinto Limited | 120.39 | 4% | -7% | 1% | 5% | $ 43,610,480,820.72 |
| RLC | Reedy Lagoon Corp. | 0.004 | 0% | 0% | -33% | -31% | $ 2,478,162.93 |
| CTN | Catalina Resources | 0.004 | 0% | 0% | 0% | -33% | $ 4,953,947.57 |
| SRK | Strike Resources | 0.052 | 4% | 49% | -7% | -13% | $ 13,903,750.00 |
| SRN | Surefire Rescs NL | 0.01 | -17% | -17% | -38% | -44% | $ 19,863,078.13 |
| TI1 | Tombador Iron | 0.014 | 0% | 0% | -36% | -44% | $ 30,218,753.22 |
| TLM | Talisman Mining | 0.18 | 0% | -5% | 20% | 29% | $ 35,780,866.31 |
| VMS | Venture Minerals | 0.02 | -5% | 33% | 74% | -5% | $ 45,333,594.04 |
| EQN | Equinoxresources | 0.21 | -21% | -16% | 24% | 27% | $ 24,282,000.72 |
| AMD | Arrow Minerals | 0.005 | -29% | -17% | 67% | -29% | $ 37,918,825.48 |
While iron ore’s fortunes remain deeply intertwined with China, BHP’s Pant believes India will provide a strong source of replacement demand in met coal.
Although China does consume Australian met coal in its steelmaking industry, it supplies more of the product it needs from domestic sources than it does iron ore.
A shift to increased use of scrap steel and lower emissions steel tech like electric arc furnaces will also reduce its met coal demand over time.
But India has a strong build program ongoing in terms of blast furnace capacity.
“On met coal the drivers are a bit different. For met coal, India is a really big source of demand,” Pant said.
“As India continues to build its country infrastructure, manufacturing base, steel will continue to be increasing in production in India, from currently 140Mt million tonnes, we expect Indian production of steel to double by the end of this decade.
“As it goes on the journey, it will require a lot of met coal. India does not have any endowment of met coal locally, and hence is a very big portion of demand for our met coal.
“You may not know that, but 40% of our met coal already goes to India, and as India starts to and other countries start to go on the journey for decarbonisation they will continue to pivot towards highest quality met coal.
“And as you would know, we have reshaped our portfolio in the last couple of years towards highest quality metallurgical coal.”
BHP has sold its hard coking coal, semi-soft and PCI producing assets in recent years, including the Poitrel and South Walker Creek mines purchased by Stanmore (ASX:SMR) and the Daunia and Blackwater mines being acquired by Whitehaven Coal (ASX:WHC).
Pant says 85% of its output will be premium hard coking coal, which BHP expects to see achieve stronger margins as time goes by.
PHCC futures were trading for US$284/t in Monday, while thermal coal was fetching around US$130/t.
Those prices remain solid for lower cost producers, with Bengalla and New Acland owner New Hope (ASX:NHC) announcing a $251.7m after tax profit and $143.7m dividend splash on its half year results yesterday.
Scroll or swipe to reveal table. Click headings to sort.
| CODE | COMPANY | PRICE | WEEK RETURN % | MONTH RETURN % | 6 MONTH RETURN % | YEAR RETURN % | MARKET CAP |
|---|---|---|---|---|---|---|---|
| NAE | New Age Exploration | 0.004 | 0% | 0% | -50% | -33% | $ 7,175,595.64 |
| CKA | Cokal Ltd | 0.067 | -11% | -36% | -36% | -58% | $ 73,368,530.64 |
| BCB | Bowen Coal Limited | 0.047 | -25% | -28% | -68% | -83% | $ 130,824,252.91 |
| SVG | Savannah Goldfields | 0.03 | -9% | 0% | -53% | -81% | $ 8,151,462.56 |
| GRX | Greenx Metals Ltd | 0.9 | -11% | -9% | -4% | 57% | $ 254,065,981.11 |
| AKM | Aspire Mining Ltd | 0.185 | 0% | 6% | 99% | 256% | $ 93,912,842.23 |
| AVM | Advance Metals Ltd | 0.039 | 8% | 11% | -68% | -76% | $ 1,443,058.34 |
| YAL | Yancoal Aust Ltd | 5.51 | -8% | -1% | 10% | -1% | $ 7,143,577,354.17 |
| NHC | New Hope Corporation | 4.6 | -3% | -9% | -25% | -11% | $ 3,744,836,105.52 |
| TIG | Tigers Realm Coal | 0.006 | 0% | 0% | 0% | -50% | $ 78,400,214.21 |
| SMR | Stanmore Resources | 3.17 | -6% | -11% | -5% | -1% | $ 2,830,369,730.76 |
| WHC | Whitehaven Coal | 6.4 | -9% | -10% | -3% | -4% | $ 5,287,316,954.88 |
| BRL | Bathurst Res Ltd. | 0.865 | 2% | -1% | -12% | -7% | $ 164,569,410.80 |
| CRN | Coronado Global Res | 1.25 | -2% | -15% | -30% | -29% | $ 2,078,802,625.20 |
| JAL | Jameson Resources | 0.022 | -29% | -29% | -56% | -69% | $ 9,586,133.08 |
| TER | Terracom Ltd | 0.26 | 13% | -4% | -44% | -54% | $ 184,222,234.05 |
| ATU | Atrum Coal Ltd | 0.004526 | 0% | 0% | 0% | 0% | $ 11,966,853.96 |
| MCM | Mc Mining Ltd | 0.145 | -9% | 0% | 7% | -6% | $ 59,144,157.88 |
| DBI | Dalrymple Bay | 2.73 | 0% | -1% | -2% | 4% | $ 1,353,429,350.91 |
| AQC | Auspaccoal Ltd | 0.082 | 49% | -6% | -29% | -40% | $ 44,115,212.83 |


Get the latest Stockhead news delivered free to your inbox.