
Pic: Getty Images
SPIVA Scorecard: 77% of Aussie equity general funds underperformed the S&P ASX 200 in 2023
News
Pic: Getty Images
News
More than three quarters of Aussie fund managers failed to keep up with the S&P/ASX 200 during the full year of 2023 in the second-worst underperformance rate on S&P Dow Jones Indices (S&P DJI) record.
But in some good news for mid and small cap fund managers, more than half beat the beat the benchmark for the equity category, while almost three-quarters of active Australian bond managers outperformed, according to the index provider’s SPIVA Australia Scorecard for 2023.
Since its first publication more than 20 years ago, the S&P DJI’s annual SPIVA scorecard has served as the de facto scorekeeper of the active versus passive debate.
The performance report evaluates actively managed funds against their benchmarks across various timeframes. It covers equity, real estate, and bond funds, offering statistics on outperformance rates, survivorship rates, and the dispersion of fund performance.
To understand the performance of the fundies, it’s good to first have an understanding of the market for which they were operating.
S&P DJI noted in 2023 as in many previous years market sentiment was heavily influenced by central bank policy decisions both domestically and internationally.
The Reserve Bank of Australia (RBA) implemented five target rate increases throughout the year building on rate rises in 2022 as it worked to pull back higher inflation.
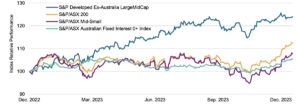
S&P DJI director and APAC head of index investment strategy Sue Lee told Stockhead a notable trend in 2023 was that the mega-cap S&P/ASX 50 outpaced the S&P/ASX Mid-Small by 7%.
The S&P/ASX 200 Equal Weight Index, with a small-cap tilt compared to the S&P/ASX 200, continued its underperformance for the third consecutive year.
“This indicates challenges for Australian large-cap equity active managers who sought opportunities outside of the heavily weighted stocks in the S&P/ASX 200,” Lee says.
The S&P/ASX 200 concluded the year with a total return of 12.4%. In contrast, global equities showed more consistent gains, with the S&P Developed Ex-Australia LargeMidCap recording a total return of 24.1% (in AUD).
On the ASX there were significant sector rotations in 2023 from the previous year. Tech and consumer discretionary were the top-performing sectors up 31% and 22%, which was in stark contrast to losses of 34% and 20% in 2022. Conversely, energy and utilities, which had robust gains of 49% and 30% in 2022, managed to stay just above breakeven last year.
Lee says there are certain market environments that are more favourable or less favourable for active managers with S&P DJI taking particular note of dispersion, which measures potential for active outperformance through stock, sector, or country selection.
“Dispersion is one of the most important metrics we look at, as the spread of returns among different stocks, sectors and countries presents an opportunity set for active outperformance,” Lee says.
The 12-month trailing S&P/ASX 200 sector and stock dispersion reached levels not seen since December 2018, accompanied by a noticeable decline in country-level dispersion within the S&P Developed Ex-Australia LargeMidCap.
“What we saw in the 2023, especially in the second half of the year, was that dispersion fell across the board in both domestic and international equity markets, which made differentiation through stock picking or sector/country tilt more difficult for active managers,” Lee says.
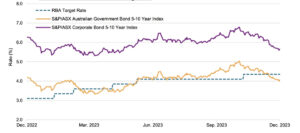
Longer-dated government bond yields were initially lower then higher, eventually settling close to their starting levels by year end.
Credit spreads saw a modest decrease. The spread between the S&P/ASX Australian Government Bond 5-10 Year Index and S&P/ASX Corporate Bond 5-10 Year Index decreased from 209 to 159 bps over the year.
“The fixed income market environment last year could be one of those that were more favourable for active managers, with a narrowing of credit spreads and outperformance of longer-dated bonds versus shorter-dated bonds,” Lee says.
“Active managers who took on a little more duration or a little more credit risk than their benchmarks would have benefitted from these trends.
“In fact, the historical data shows that more active bond managers tended to perform better compared to the benchmark in years with narrowing credit spreads.”
So now we know the backdrop of the market how did Aussie fundies across different categories perform?
As mentioned the S&P/ASX 200 ended the year up 12.4%, but Aussie equity general funds struggled to keep up with the one-year underperformance rate of 77% the second highest in our records.
Longer term, underperformance rates were were higher with 85% of funds underperforming the benchmark over 15 years.
The S&P/ASX Mid-Small gained 7.8% in 2023 with 64% of actively managed Australian equity mid and small cap fund manager managing to beat it.
Funds in the category gained 10.8% and 13.0% on an equal and asset-weighted average basis, respectively. However, S&P DJI notes more such years will be required to change the longer-term figures, with 77% of funds currently lagging over 10 years.
International equity funds posted average 2023 returns of 20.3% and 19.2% on an equal and asset-weighted basis, respectively. However, 81% of funds trailed the S&P Developed Ex-Australia LargeMidCap’s total return of 24.1%.
Over 10 and 15-year horizons, around 94% of funds underperformed.
Active managers in the Australian Bonds category posted their lowest one-year underperformance rate since the 2015 launch of the S&P/ASX Australian Fixed Interest 0+ Index, with just 26% of funds lagging the index.
The longer-term record was also better relative to other categories, with 56% and 46% underperforming over the three- and five-year periods, respectively.
“Australian bond managers indeed had a fantastic year,” Lee says.
“They posted average 2023 returns of 5.6% and 5.9% on an equal- and asset-weighted basis, respectively, compared to a 5.3% return of the S&P/ASX Australian Fixed Interest 0+ Index.”
S&P DJI notes after a challenging start to the year, active managers in the Australian Equity A-REIT category improved their underperformance rate to 69% over the full year. Over the 15-year period, 80% of active funds underperformed.
Liquidation rates for most active fund categories were moderate in 2023. International equity general funds recorded the highest liquidation rate at 7.7%, while only 1.3% of Aussie equity mid and small cap funds failed to survive.
Over the longer term the figure was much higher with 57% of funds across all categories merging or liquidating throughout the 15-year period.
Lee says passive investment has seen high, steady growth over the past few decades. She says in the mutual fund space, assets under management (AUM) of passively managed equity funds recently surpassed 50% of total equity funds AUM.
“What is more interesting now is the growth of passive investment in fixed income, “she says.
“Comparing where the fixed income passive market currently stand versus where the equity passive market were about a decade ago in terms of the breadth and range of passive funds, we may be at an inflection point for the wider adoption of passive investment in fixed income over the next decade.”
Lee says the growth of passive poses a challenge to active managers by reducing a net supply of alpha available in the market.
“When a passive alternative is available, assets move from the least capable active managers to passive and the average ability of the remaining active manager goes up,” she says.
“This leads to competition among surviving, presumably more capable active managers and hence outperformance becomes even more difficult for active managers.”


Get the latest Stockhead news delivered free to your inbox.