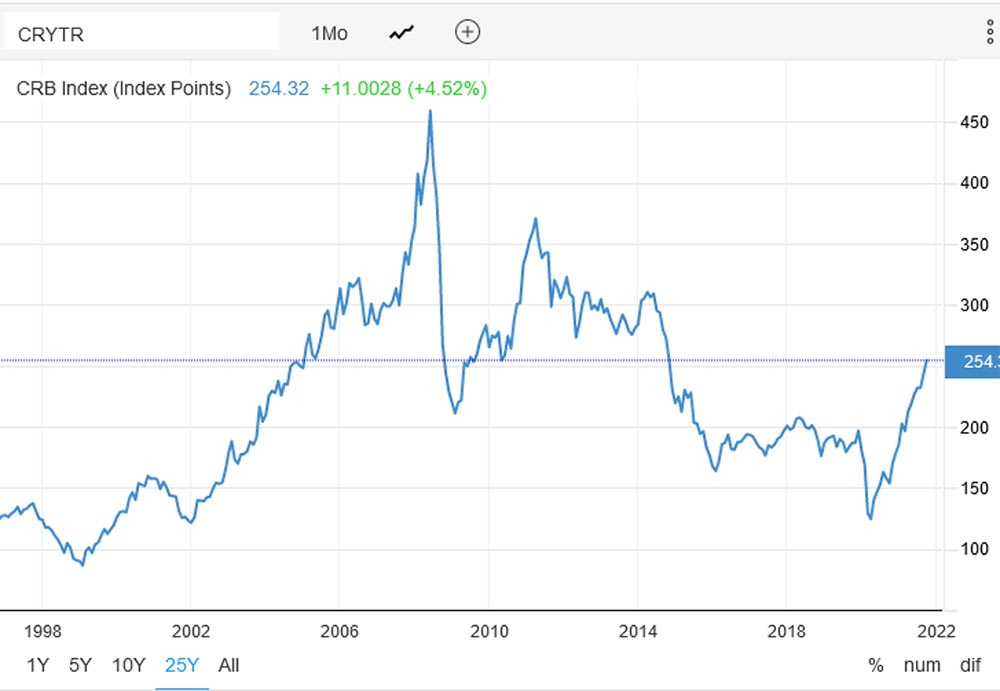
Metals markets are exceptionally volatile (figure 1), reminding me very much of the volatility we saw in late 2008 — a period characterised by deflating asset prices, negative world GDP growth and falling interest rates.
This was followed by a period of strong global economic growth (particularly in Australia) fuelled by expansionary monetary and fiscal policies.
Figure 1 :CRB Index, 1998-2021 (Source: https://tradingeconomics.com/commodity/copper, 15 October 2021).
With inflation on the march and supply chain bottlenecks across broad sections of the economy, we are entering into an extreme phase of the economic and therefore, the commodity cycle, that is torn between supply side pressure and slowing economic growth.
Oil is up around 30% over the last eight weeks finishing the week at US$82.24/bbl, with soaring energy prices fuelling rampant inflation and, in the process, creating havoc in China.
China’s top economic planning agency last week indicated it would liberalise pricing in the state-controlled power market to help alleviate an electricity crisis that has resulted in significant rationing across the country.
Clearly this is a significant threat to Chinese economic growth. Historically rising energy prices have been closely correlated with rising base metal prices as input costs rise to produce these metals, so it will be interesting to see what transpires.
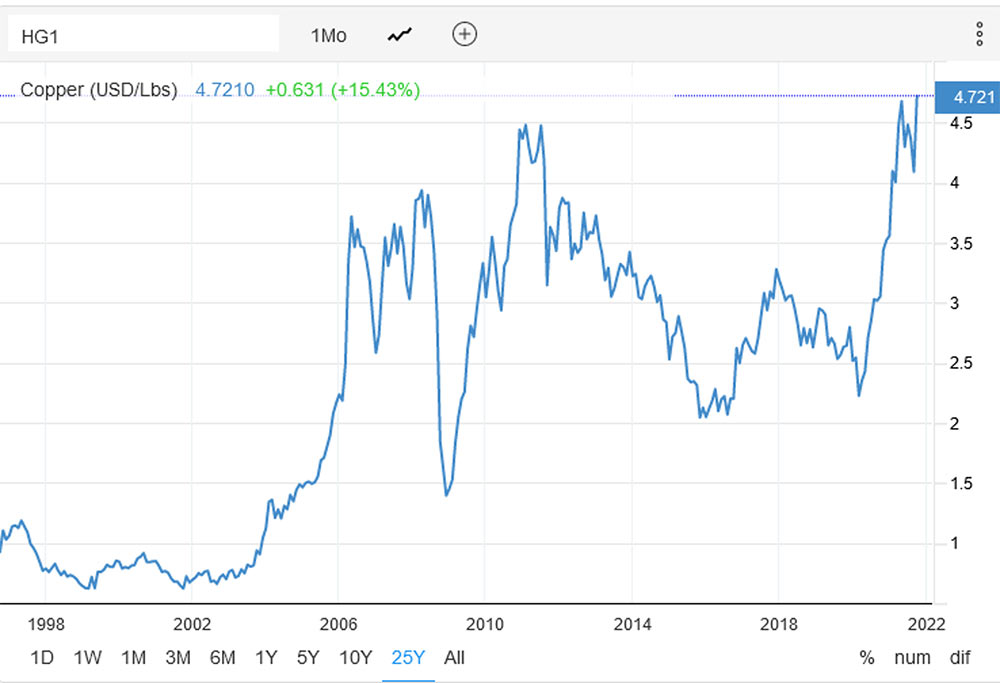
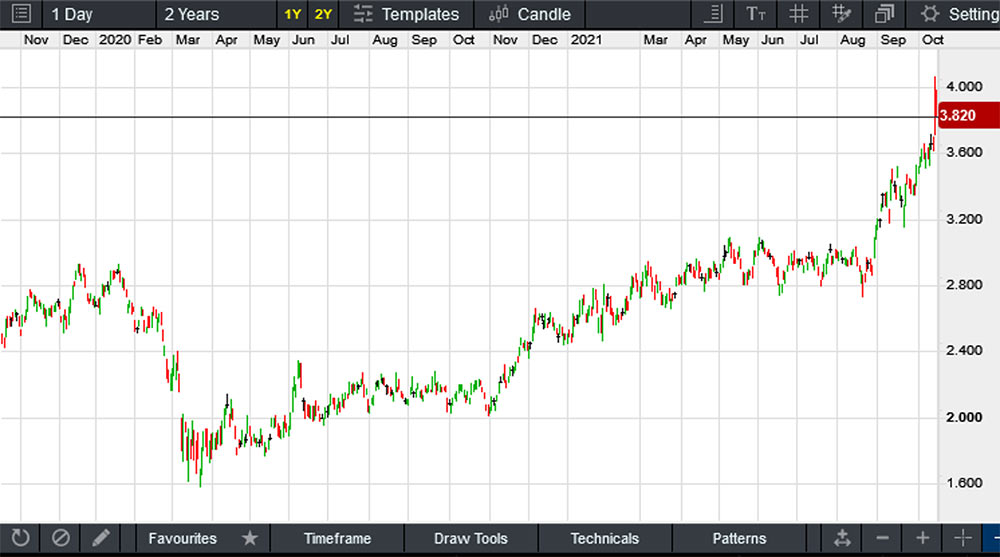
The big mover last week was copper closing at US$4.71/lb only 13 cents off its all-time high (figure 2).
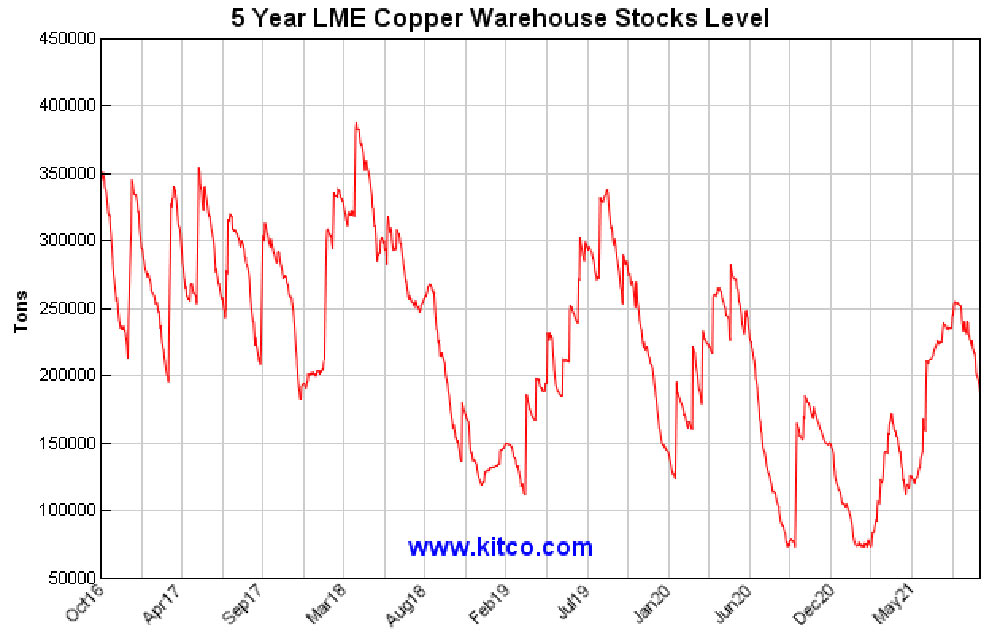
The 2-month futures contract is now in contango, and LME inventories are nearing (figure 3) a 47-year low. Goldman Sachs is predicting LME inventories will be at all time lows by the end of CY 2021.
Figure 2: 25-year copper chart (Source: https://tradingeconomics.com/commodity/copper, 15 October 2021).
Copper supplies remain tight, and according to Citi Research (12 October 2021) Chile’s Codelco — the world’s largest copper miner — is offering to sell copper to European buyers at a premium of US$128 a tonne in 2022; the highest level since 2015 and a rise of more than 20% over CY 2021.
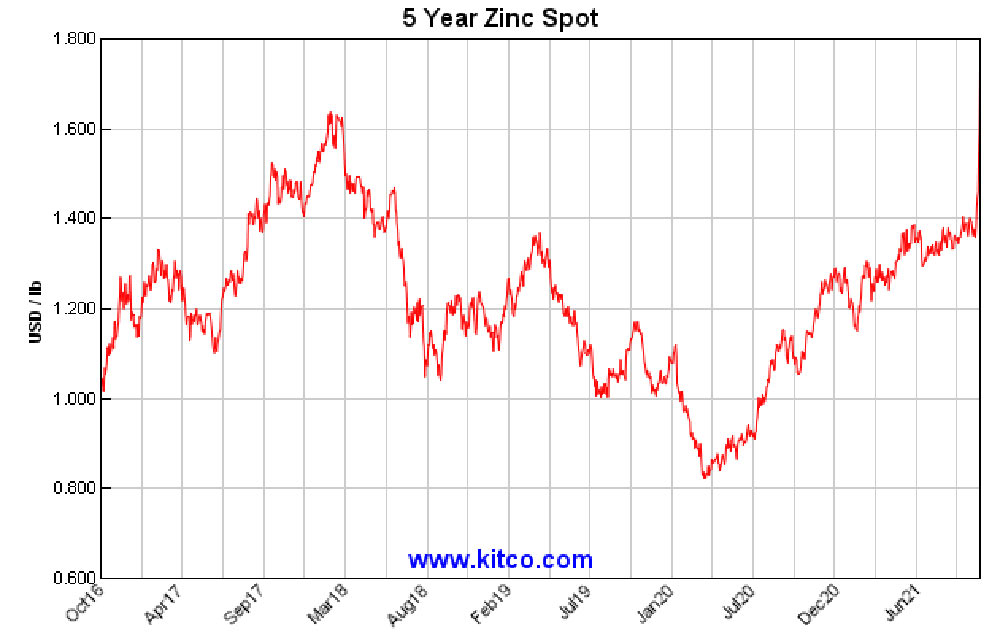
Zinc is the other big mover touching a near 14-year high (figure 4) in Shanghai during the week, while in London the metal had its strongest trading day in over 3.5 years after Nyrstar (a leading lead and zinc smelter with operations in Europe, Australia, and the Americas) indicated it will cut production by up to 50% at its three European zinc smelters due to rising energy prices.
Citi Research (12 October 2021) have recently upgraded their three-month price target to US$3,700/tonne and 4Q’2021 average price forecast to $3,500/t (from $3,000/t and $2,900) due to news of European smelter cuts in an already tight physical market.
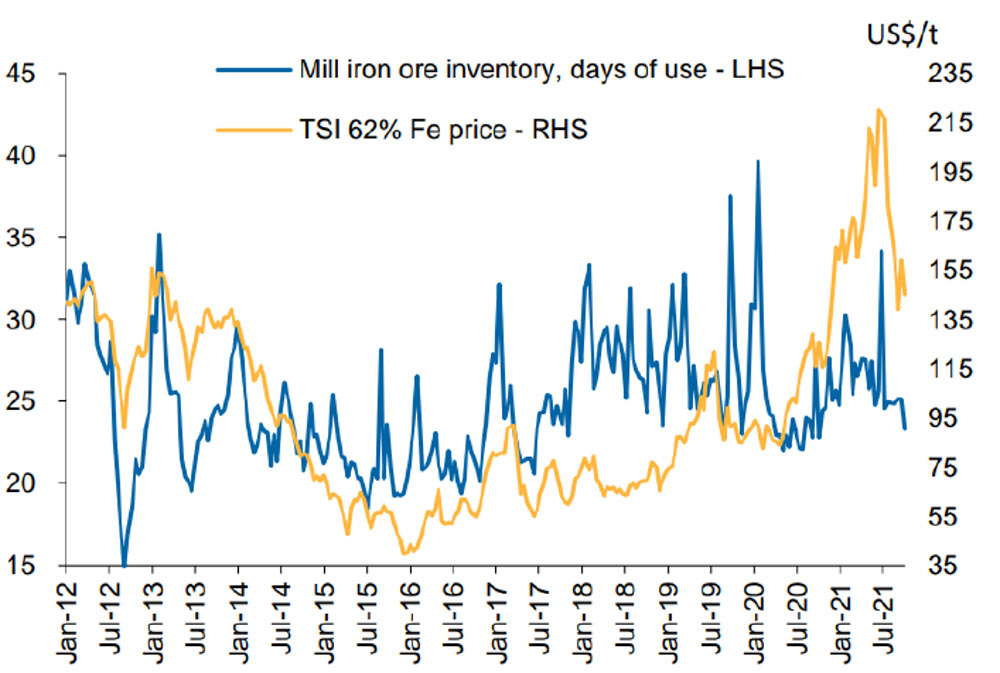
Iron ore prices continued climbing last week closing at US$122/t (62% Fe) with falling inventory levels at Chinese steel mills over much of CY 2021 (figure 5). Recent weekly China blast furnace and steel output data indicates steel production is improving, suggesting Chinese steel mills margins are back at a respectable ~Rmb1000/tonne.
Figure 5: Mill iron ore inventories v TSI 62% Fe price, 2012-2021 (Source: Macquarie, Global Iron Ore Miners, 12 October 2021).
Daily crude steel output among the member mills of the China Iron & Steel Association (CISA) declined sharply over September 21-30, falling by 11.2% or 222,500 tonnes/day in 10 days to 1.77 million t/d on average, a 3.5-year low.
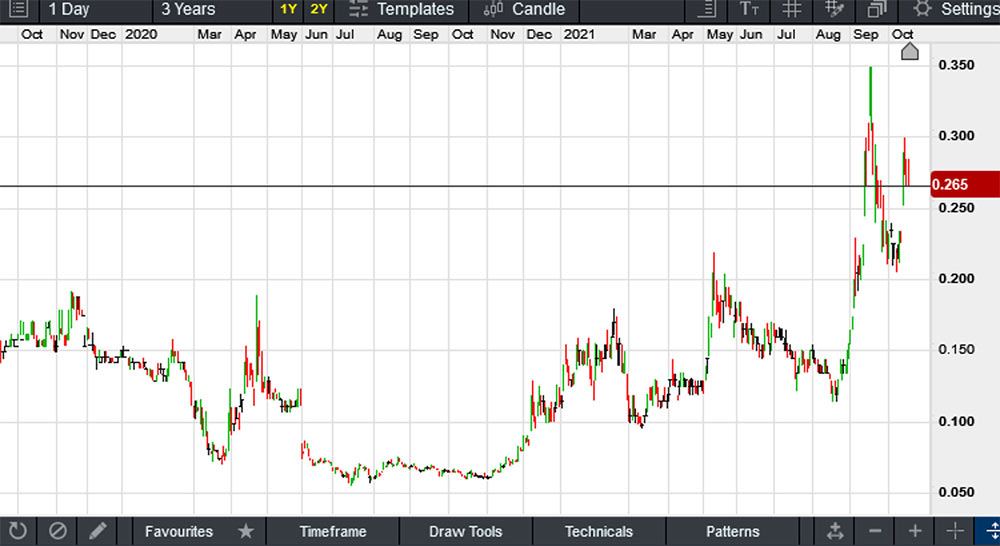
We picked upPeninsula Energy Limited (ASX:PEN) at 12 cents in March of this year just before uranium made its move (currently sitting around US$47.2/lb). Last month the company reported some positive results from the MU1A low-pH in-situ leach (“ISR”) field demonstration at its 100% owned Lance Project in Wyoming (USA).
The demonstration operated for over a year, with PEN looking to enhance the configuration of the injection and recovery well patterns.
PEN is currently planning on expanding the scope of the field demonstration following the installation of a new small-scale pattern.
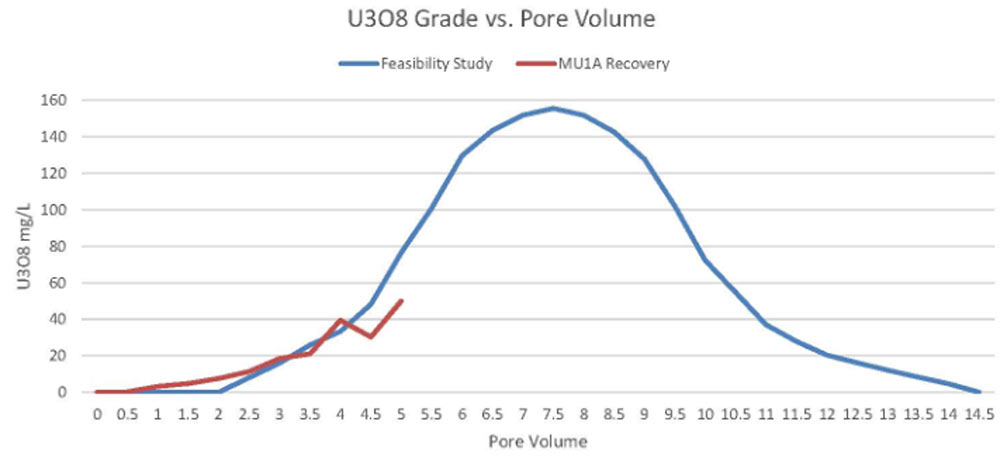
Figure 7: U3O8 grade v Pore Volume (Source: PNE ASX Announcement, 2 September 2021).
PEN has produced uranium from the pilot ion exchange system with data from this test work being applied to optimisation work on a commercial scale, low pH flowsheet ahead of a decision to finance the resumption of commercial production.
On the copper front it looks like South32 Limited (ASX:S32) is frontrunner for a 45% stake in Chilean copper mine Sierra Gorda situated in the Atacama region of Chile, with the Financial Times reporting earlier in the week that the price tag could come in around US$2 billion.
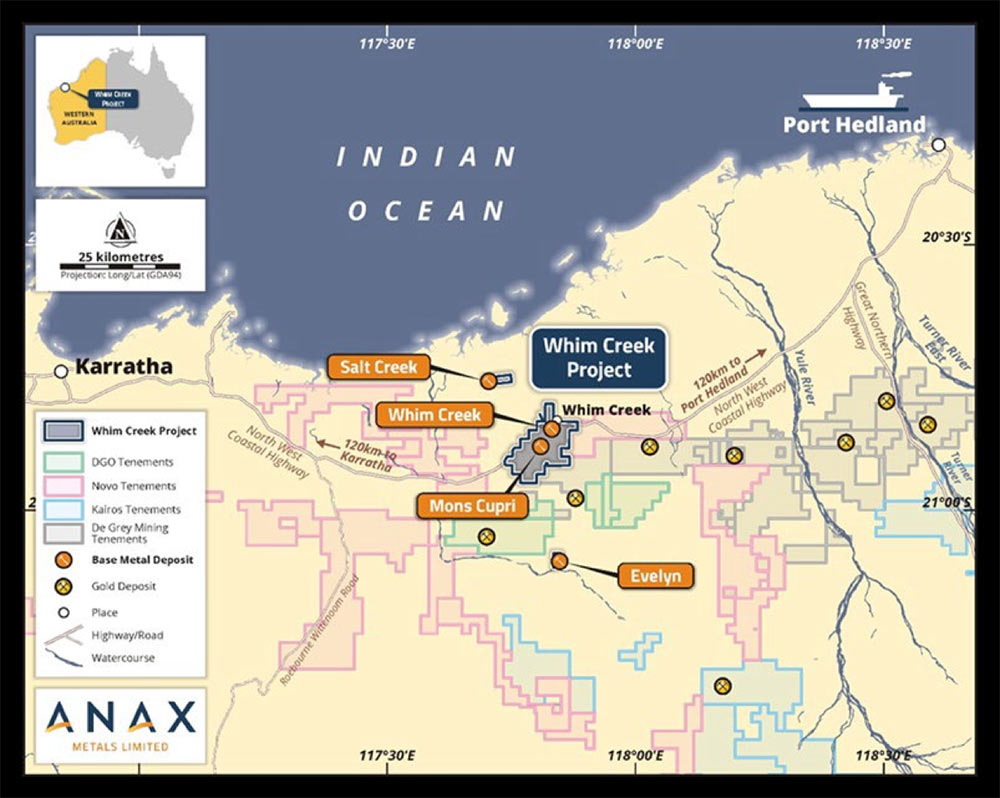
The company is looking to bring its 80% owned Whim Creek Project (Pilbara, WA) back online in early CY 2023 (figure 10), hopefully with some ore sorting technology which should give the head grade a kick.
Figure 10: ANX’s Whim Creek Project (Source: ANX Presentation, September October 2021).
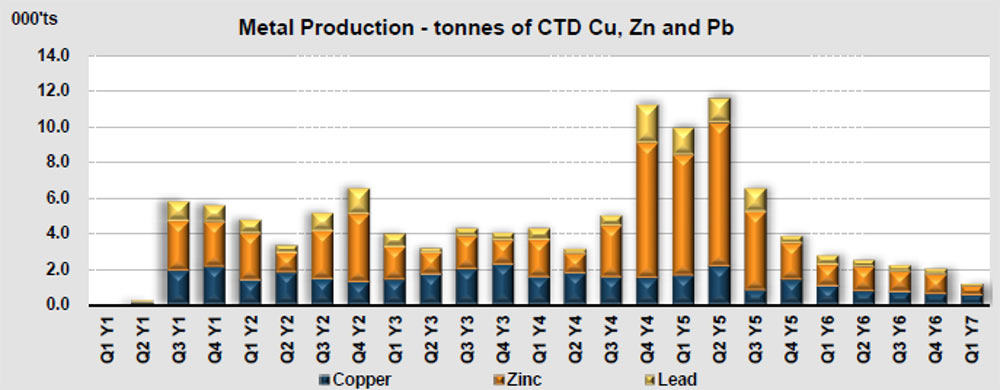
The August 2021 Scoping Study contemplates a 5-7 year mine life with a CAPEX of around $57 million producing 33,200 tonnes of copper, 62,400 tonnes of zinc, 17,800 tonnes of lead and 1.6Moz of silver (figure 11).
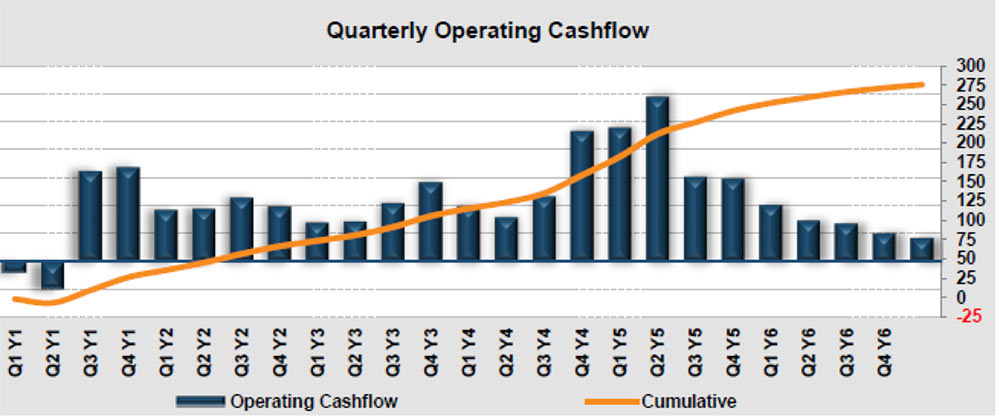
The study generates surplus cash flow of approximately $200 million (figure 12) at an impressive internal rate of return of 77% giving a Net Present Value6 of $163 million.
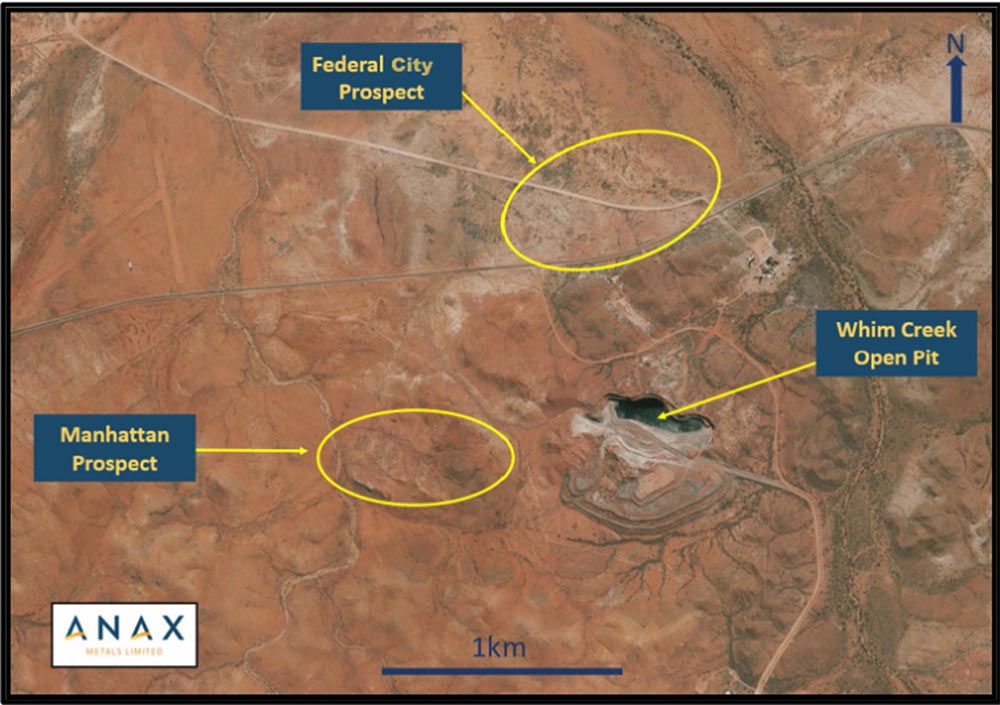
Not the biggest project going around town, but the board, led by managing director Geoff Laing, looks like they have some idea what they are doing and there is some good exploration upside at nearby prospects such as Federal City and Manhattan (within 1km of Whim Creek) that have the potential to extend the mine life (figure 13).
Figure 11: ANX’s Cu, Zn and Pb production from Whim Creek (Source: ANX Presentation, September October 2021).Figure 12: ANX’s Quarterly Operating cash flow from Whim Creek (Source: ANX Presentation, September October 2021).Figure 13: Key exploration prospects in the vicinity of the Whim Creek Project (Source: ANX ASX Announcement, 2 October 2021).
With a lot of listed mineral explorers promoting nothing more than recycled moose pasture valued at in excess of $20 million (including some real garbage from the Lachlan Fold Belt), ANX at least gives you reasonable exposure to some in-demand metals, near-term production potential as well as some half-decent, near-mine exploration upside.
While buying developers pre-project financing can be a little risky, I am happy to take the punt on this occasion.
At RM Corporate Finance, Guy Le Page is involved in a range of corporate initiatives from mergers and acquisitions, initial public offerings to valuations, consulting, and corporate advisory roles.
He was head of research at Morgan Stockbroking Limited (Perth) prior to joining Tolhurst Noall as a Corporate Advisor in July 1998. Prior to entering the stockbroking industry, he spent 10 years as an exploration and mining geologist in Australia, Canada, and the United States. The views, information, or opinions expressed in the interview in this article are solely those of the interviewee and do not represent the views of Stockhead.
Stockhead has not provided, endorsed, or otherwise assumed responsibility for any financial product advice contained in this article.
Get the latest Stockhead news delivered free to your inbox
For investors, getting access to the right information is critical.
Stockhead’s daily newsletters make things simple: Markets coverage, company profiles and industry insights from Australia’s best business journalists – all collated and delivered straight to your inbox every day.
Markets coverage, company profiles and industry insights from Australia’s best business journalists – all collated and delivered straight to your inbox every day.
It’s free. Unsubscribe anytime.
By proceeding, you confirm you understand that we handle personal information in accordance with our Privacy Policy.
I want the news:
Hear it first
Get the latest Stockhead news delivered free to your inbox.
Thanks! You’re subscribed, Stockhead news is coming your way soon.