And hydrate. Via Getty
Candlestick SE: Tell us, oh candles, when will the top 6 BNPLs be Buys again. No, really. Hey why are you laughing?
Experts
And hydrate. Via Getty
Experts
Carl Capolingua is the most precious Australian technical analyst you will meet in this story.
He works by candlelight at ThinkMarkets and in this top-notch non-refundable guest star series, The Candlestick, Capo thrusts us into the fully charted market depths – global, local, individual.
Here he is, action figures sold separately:

Morning party animals, try sitting quietly for a moment and consider investing for a good time, not a long time.
BNPL.
Can you cut and run when the champagne stops flowing?
BNPL…
Ah. You did it.
BNPL.
There! Again. The involuntary twitch!
You’re a replicant for sure, but if it’s any comfort, you’re not alone.
New data shows some 80% of many, oh so very many Aussie investors bought into around 75% of what at least 85% 0f the BNPL sector has been selling over the last 18 months.
Set aside the numbers game for now, and reflect instead on the pain any one of Afterpay (now part of US-based Block Inc and trading under the ASX ticker ASX:SQ2), Zip Co (ASX:ZIP), Sezzle (ASX:SZL), and the many before, under, push, open, under and the rest of the pays inflicted on you and your portfolio can be a bitter pill. No one likes to replay a game in which we got our arses handed back to us on a platter.
But, joining the dots, it’s easy to see why so many investors were initially attracted to BNPL stocks in the first place.
It was one hell of a party on the way up, and I don’t need to remind you that Italians (that’s me) are partial to parties! So much so, I invest the same way I party. My aim for both is to be there for a good time, not a long time.
There were those garlands on entry – tantalising revenue and subscriber growth charts with exponentially ascending lines soaring ever higher to the top right. For a brief period, these were trumpeted to the market in monthly reports. Often, an update would trigger a cheer from the dance floor and a double-digit percentage jump in the relevant company’s stock price.
Note to self and party people still reading: as growth rates started to slow, companies dispensed with monthly reports and went back to quarterly or half-yearly updates. A not unfamiliar pattern and a sure sign this party is running out of puff.
Still, at the time, it was the sort of growth which had many analysts drunk on their own genius (and jelly vodka) scrambling to redefine their definition of “value”. Forget tired old notions like price to earnings (PE) ratios… with the rising BNPL sun, dawned a new era of the price to sales (PS) ratio. As if actual profits in the bank were for heretics and tee-totalers.
Like many parties though, there comes a point where someone yells, “The keg just ran out!” or “The cops are here” or “Terry just ate the cat.”
This is when the party animals with remaining self-preservation instincts, read the cues, grab their cats and exit stage what’s left to seek the next, and the next and the next party. 99% of all Italians know there’s always a party kicking on somewhere in the market.
Unfortunately, a few BNPL revellers, still high on the lingering effects of price to sales ratios, either didn’t hear that frightful call or chose to ignore it. The stream of smart partiers heading out the door started to match the late comers staggering in, and eventually exceeded it. The BNPL party started to shrink, and worse still, it started to stink. And there is no eaten cat bounce in market terminology. Yet.
Alas, there’s always a group who hang around too long and end up holding the bag for the clean-up. That’s the risk of partying for a long time, not a good time.
Anyways, that’s about as far as I think I can push this party analogy for a few paragraphs.
I better sober up and start this technical analysis and trends and stuff thing I call a way of life.
There are many sects of technical analysis. The one I adhere to, though not religiously however much my editor would like to milk this analogy, is called “trend following”.
I have several methods which I use to identify the trend of a stock’s price, either up, down, or sideways.
It’s completely straightforward from there. If I can see an uptrend in a stock’s price, I can consider buying it. (This means the party is pumping, the keg is full, revellers are flooding in the door, and no one wants to leave. It’s party time! Let me in!)
If the trend is sideways, pass. (This means the keg is running out, the smart ones know it’s time to leave, because after all, there’s always a rocking party somewhere else! Interesting note here, many may not notice those departing because there are still just as many late comers entering – an equilibrium so to speak!)
If there’s a downtrend, it’s a hard pass on buying the stock, and more likely, I’ll likely consider shorting it. (This means the keg’s out, punters are leaving in droves, and worse still, nobody wants to join in – therefore why would I!?)
For those new to shorting, it’s where we attempt to take advantage of a stock’s falling price by selling it first and then buying it back at a lower price. For more info on this topic, and how to handle a bear market, check out this handy Bear Market Survival Guide I wrote, for the sheer joy of writing and being right.
Ed: It’s true. Carl literally wrote the book on surviving bear markets.
Well amazingly, despite all of that early promise, profits remain elusive for the sector. The likes of SQ2, ZIP, SZL, and Co. are all yet to log a maiden profit, and based upon my research, are unlikely to do so anytime soon.
Afterpay’s numbers are now buried deep within Block’s numbers, but based upon Block’s last filling, Afterpay’s losses mounted to around $345 million. Looking at the consensus estimates of 11 major brokers and research houses, ZIP won’t be making a profit until at least FY27, and SZL… well, the forecasts don’t go out far enough to predict a profit occurring – if it ever does.
The main problem now is that in their attempts to turn a profit, BNPL companies are drastically cutting back on operating costs and the massive investments in the very growth which got them all the attention in the first place.
Worse still, they’re doing this in a crumbling environment for credit quality and amidst the backdrop of rising funding costs – both spurred by interest rates going from zero to hero in a matter of months. Kick in the possibility of a major economic slowdown, which means fewer of the discretionary purchases the sector desperately relies on.
Ok, this segment isn’t called The Candlestick for nothing.
My methodology relies little on analysing revenue and subscriber numbers, on when profits may or may not materialise, or whether one central bank increases interest rates or not.
Instead, it relies on analysing trends, price action, and volume.
Right now, I’m going to take a cold hard look at the Top 6 ASX listed BNPL stocks purely from a technical standpoint. I can tell you, it ain’t going to be pretty. The cops turned up, the keg ran out and the cat is long eaten, for BNPL and there are few signs a new party is brewing any time soon.
If you’re dancing on your own in the BNPL party, do you hang around?
If you’re not, do you venture in?
The charts suggest if you’re looking for a good time in BNPL, it could be a long time until they return.
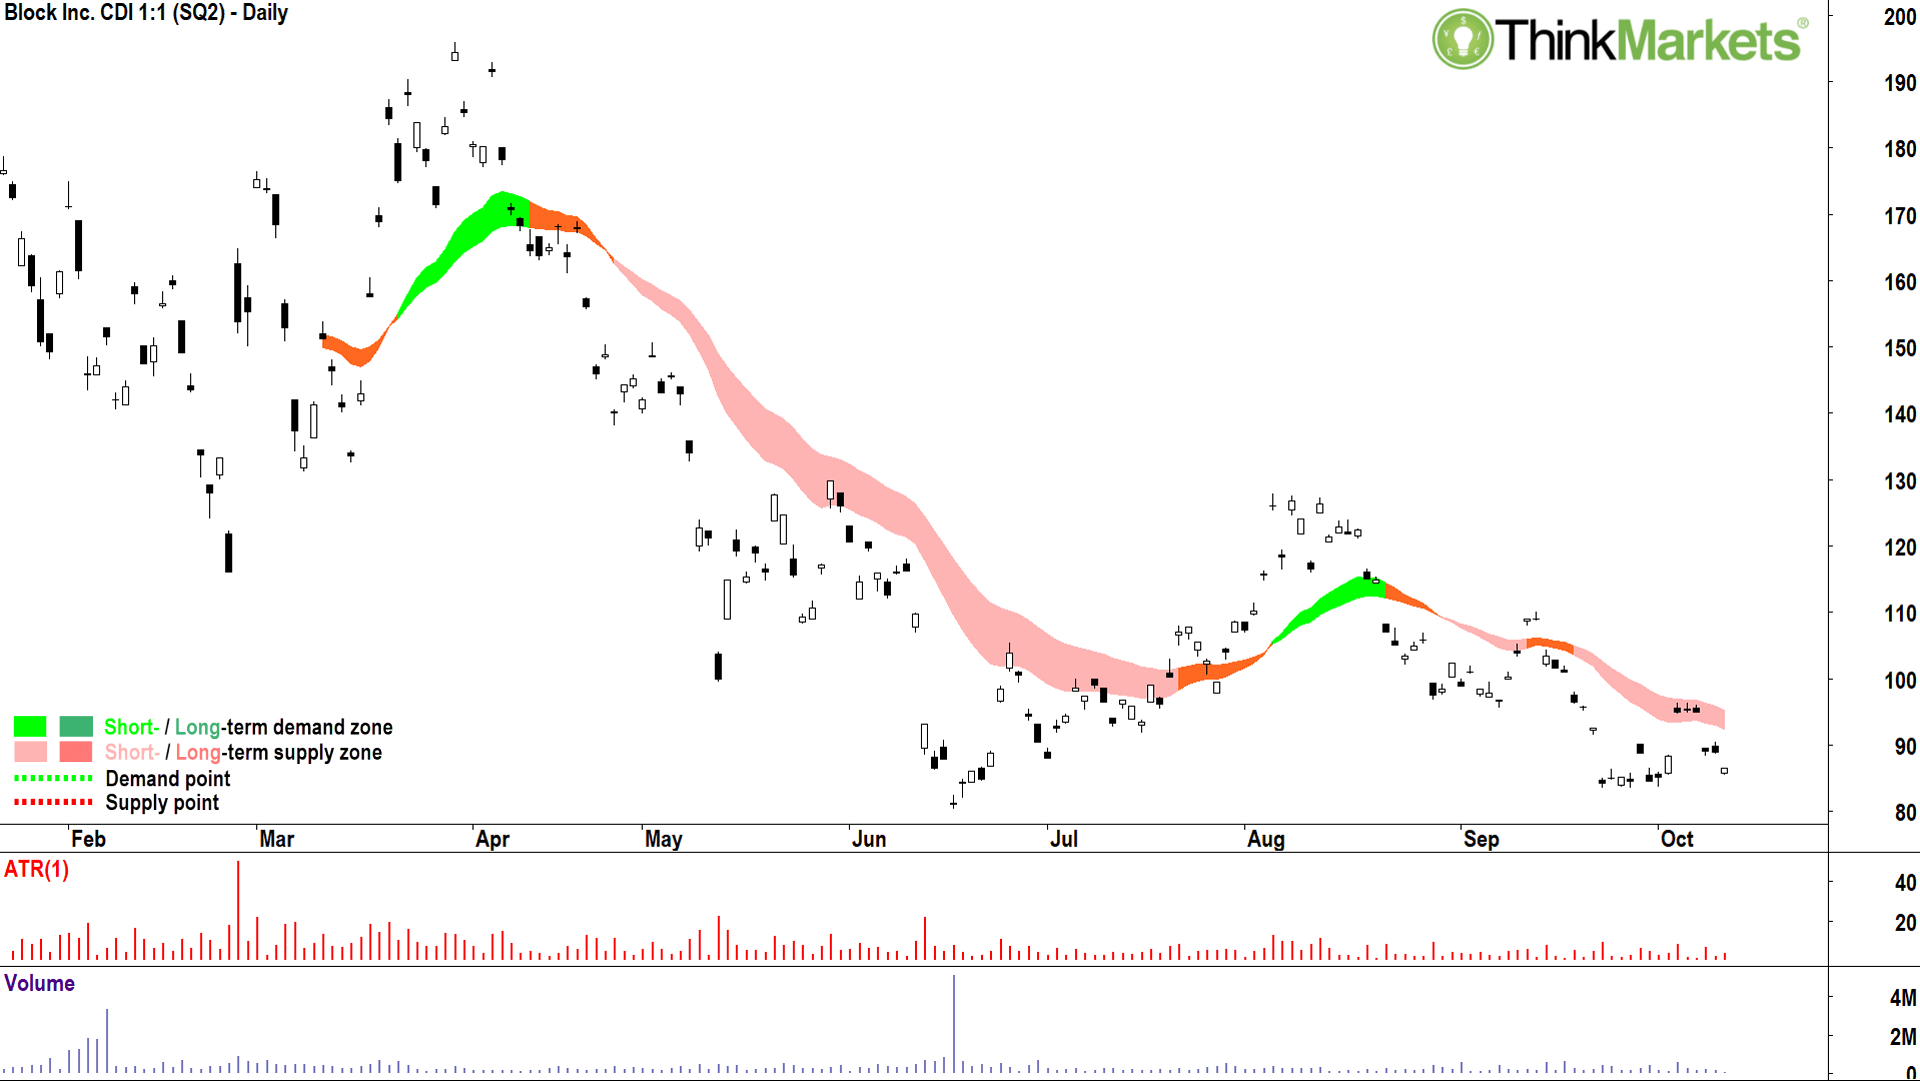
SQ2 hasn’t been around long enough for my long-term trend ribbon to form yet, but it does have a very well-established short-term trend ribbon (light-pink zone) in downtrend mode.
Last week’s rally has met up with this ribbon which has a clear tendency of impeding upwards price movement.
Like many US-traded ASX-listed stocks, the chart of SQ2 is rather sketchy.
This is because the “real” moves happen in New York, and the local variant plays catch up the next day.
On that note, the chart of SQ2 looks very similar to Block Inc (SQ), above. SQ does have a long-term trend ribbon (dark-pink zone), and that’s also very much in downtrend mode.
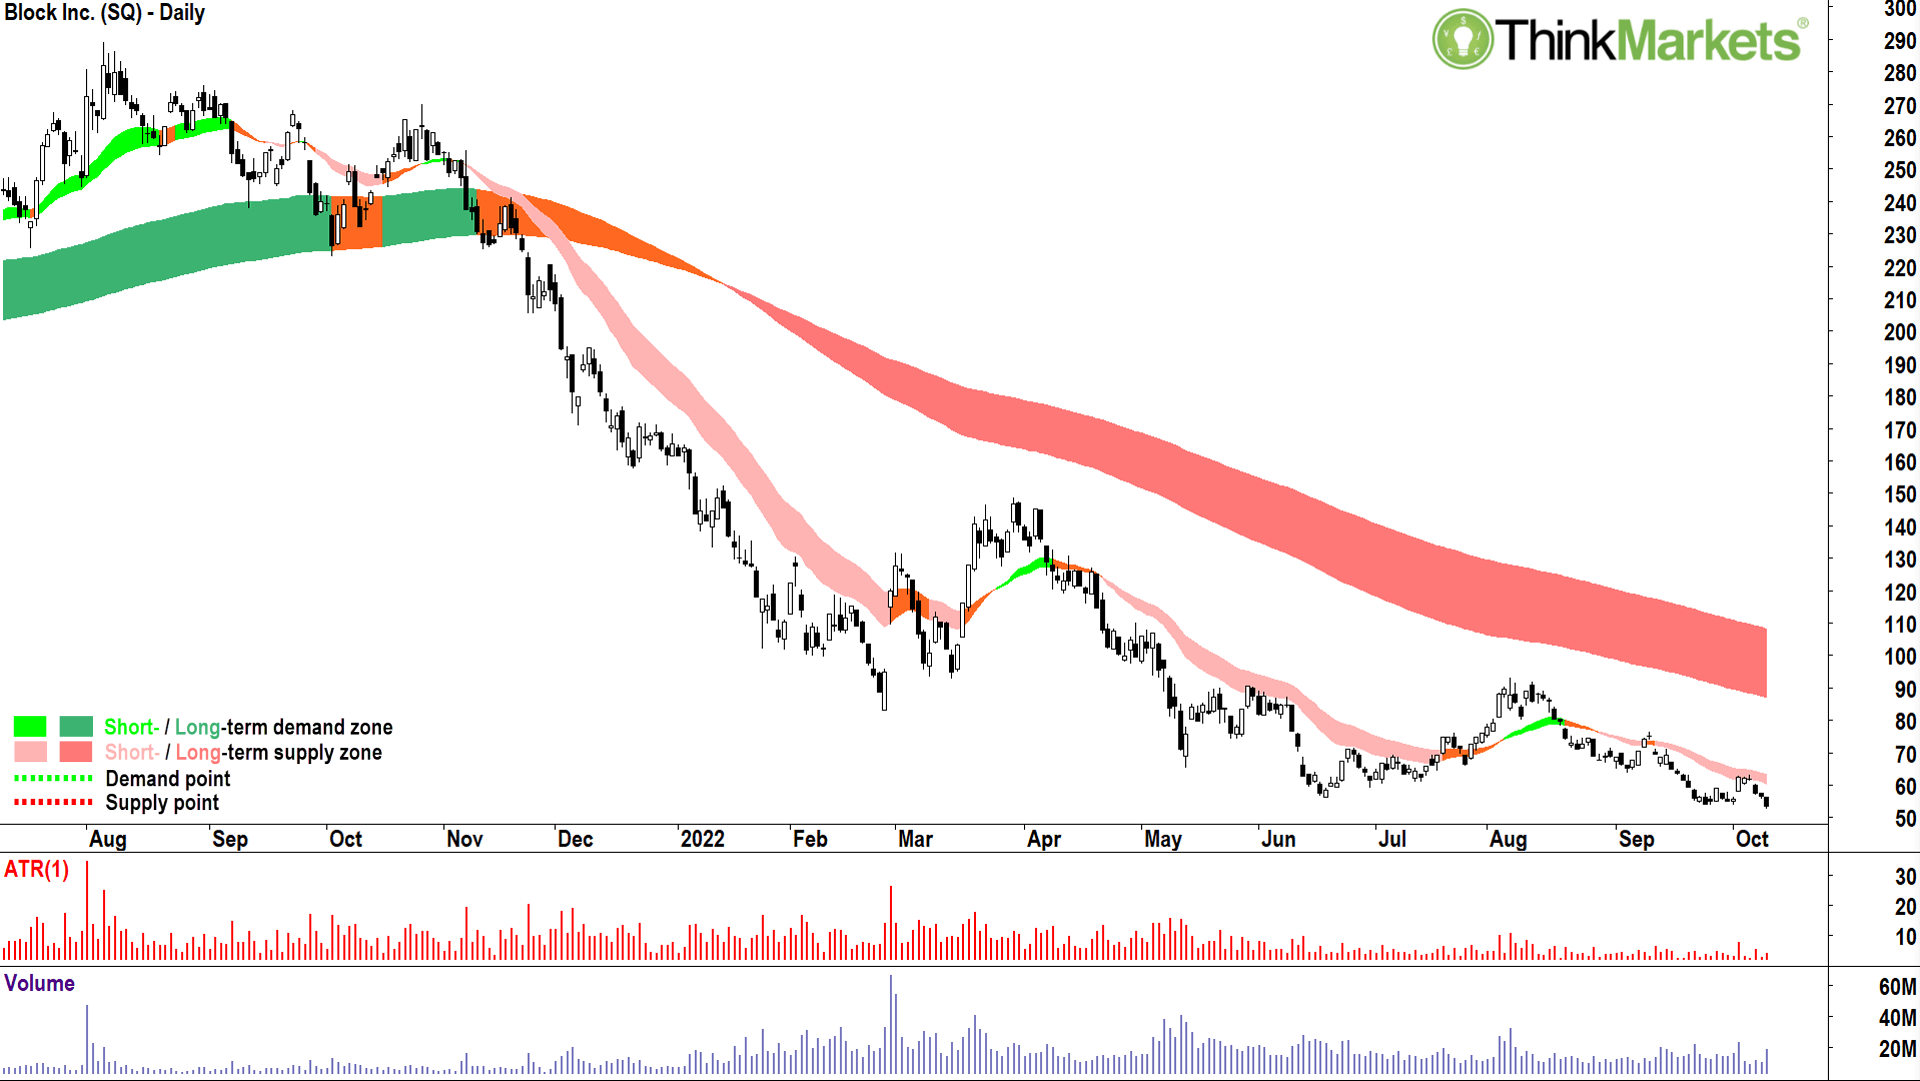
For each, the price action is lower peaks and lower troughs, and the candles are predominantly black. Both are very good indicators the supply-side is in firm control of the price.
For me, charts like SQ (and the rest below) are off limits for buys. In fact, I’d go so far as to say SQ is more in the shorting camp.
View: Avoid (or short) until a close above the September 13 peak of $110.20 on SQ2, or above the September 12 peak of $76.71 on SQ.
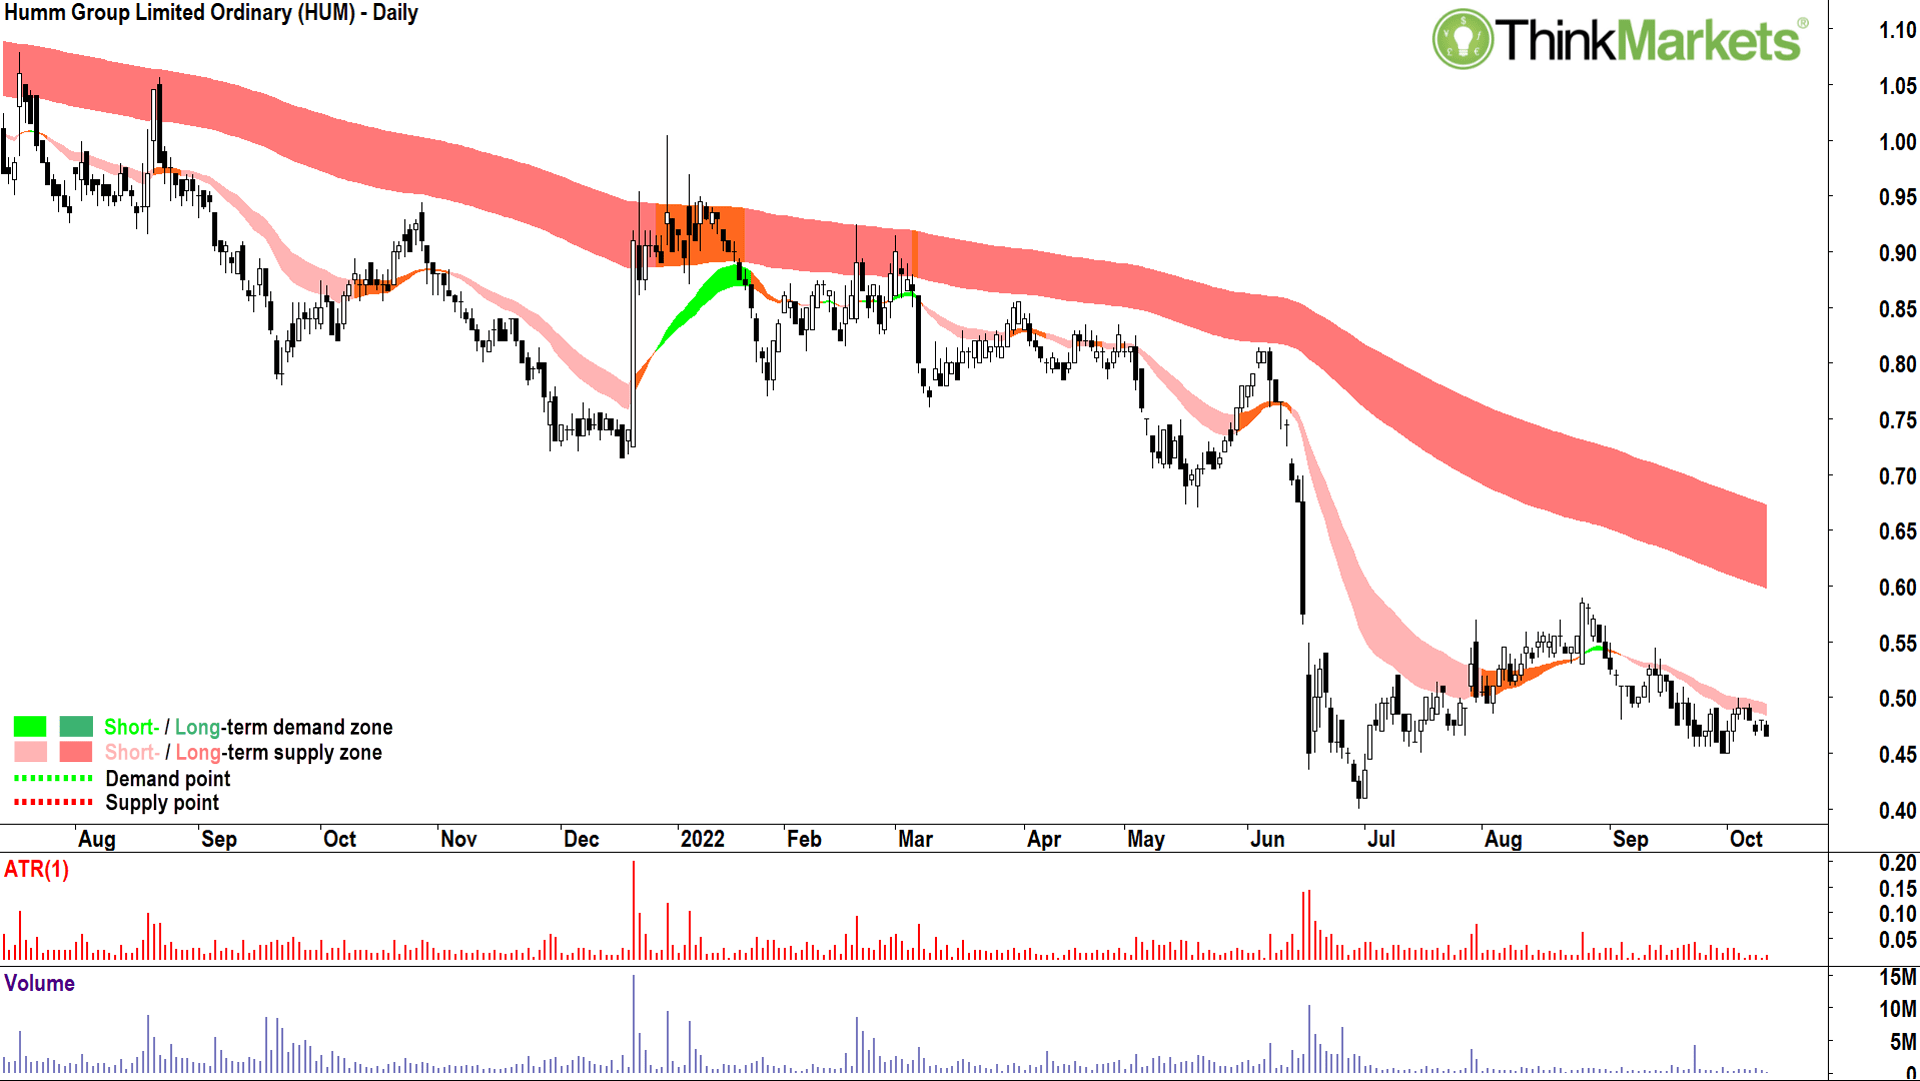
I’m going to go ditto on HUM.
The long-term downtrend ribbon (dark-pink zone) is well-established to the downside, and the short-term downtrend ribbon (light-pink zone) also appears to be similarly well entrenched.
The June-August rally has faded, and the price action is grinding lower once again with predominantly black candles. I’d tip another test of the June low of $0.40. It might bounce from there again, you never know, previous demand points tend to act as future demand points.
Regardless, this is not a game I’d prefer to play.
View: Avoid until a close above the 25 August peak of $0.59.
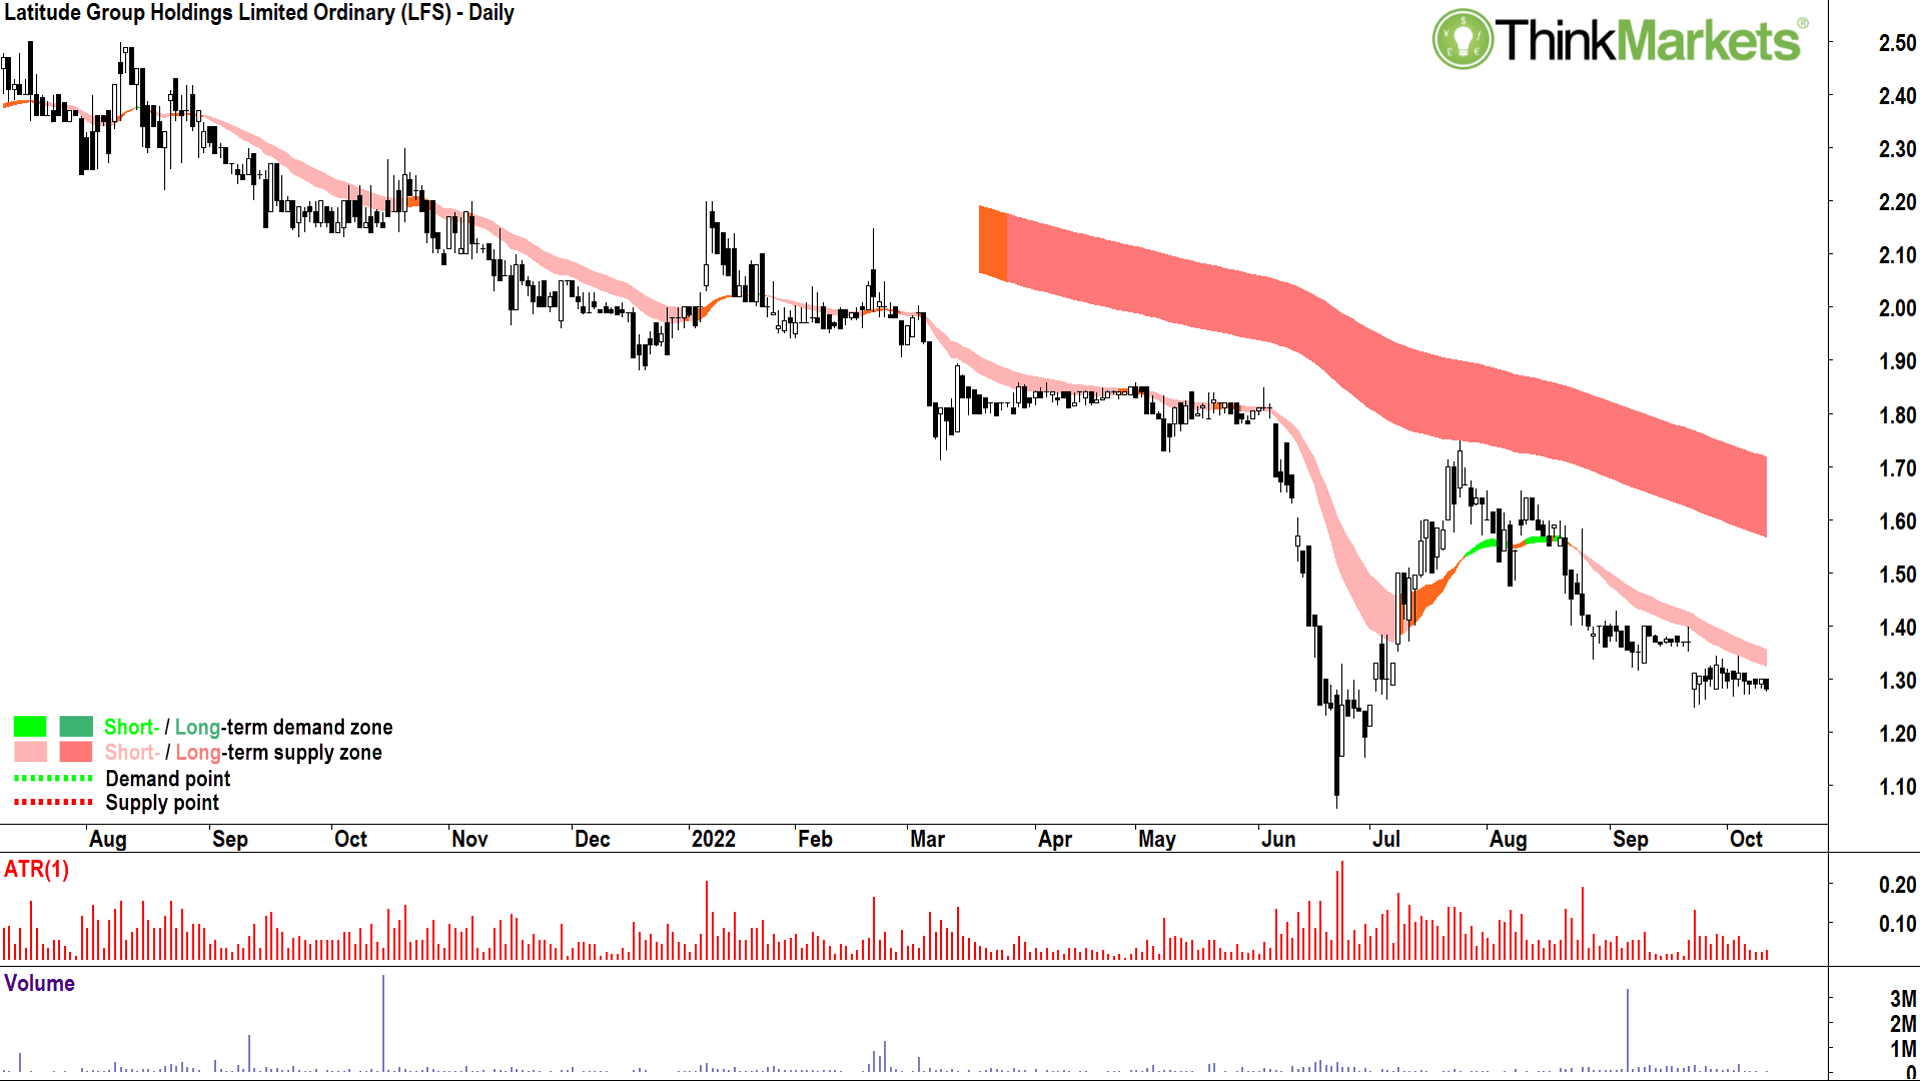
The LFS chart is basically a carbon copy of the HUM chart. Too much pink and black for my liking!
Many investors look at a chart like this and say, “Ooh, that must be cheap!”
I don’t see cheap, I look and I listen to what demand and supply tell me. I see expensive.
Take the demand-side, i.e., potential investors holding cash. They can invest their cash anywhere. They’re clearly not looking to put it in LFS. The LFS chart can only get this way if there’s very little motivated demand.
Why is there so little demand? Because LFS is not cheap!
Nope! To savvy investors holding cash it looks expensive compared to the myriad of alternatives. Similarly, there’s plenty of motivated supply.
Why? Again, because LFS is just not cheap!
It’s important to tune your eye into the market’s voice. I’m sorry (not sorry!) to say, it doesn’t matter what you think about a stock’s value, all that matters is what the market thinks!
View: Avoid until a close above the 25 July peak of $1.75.
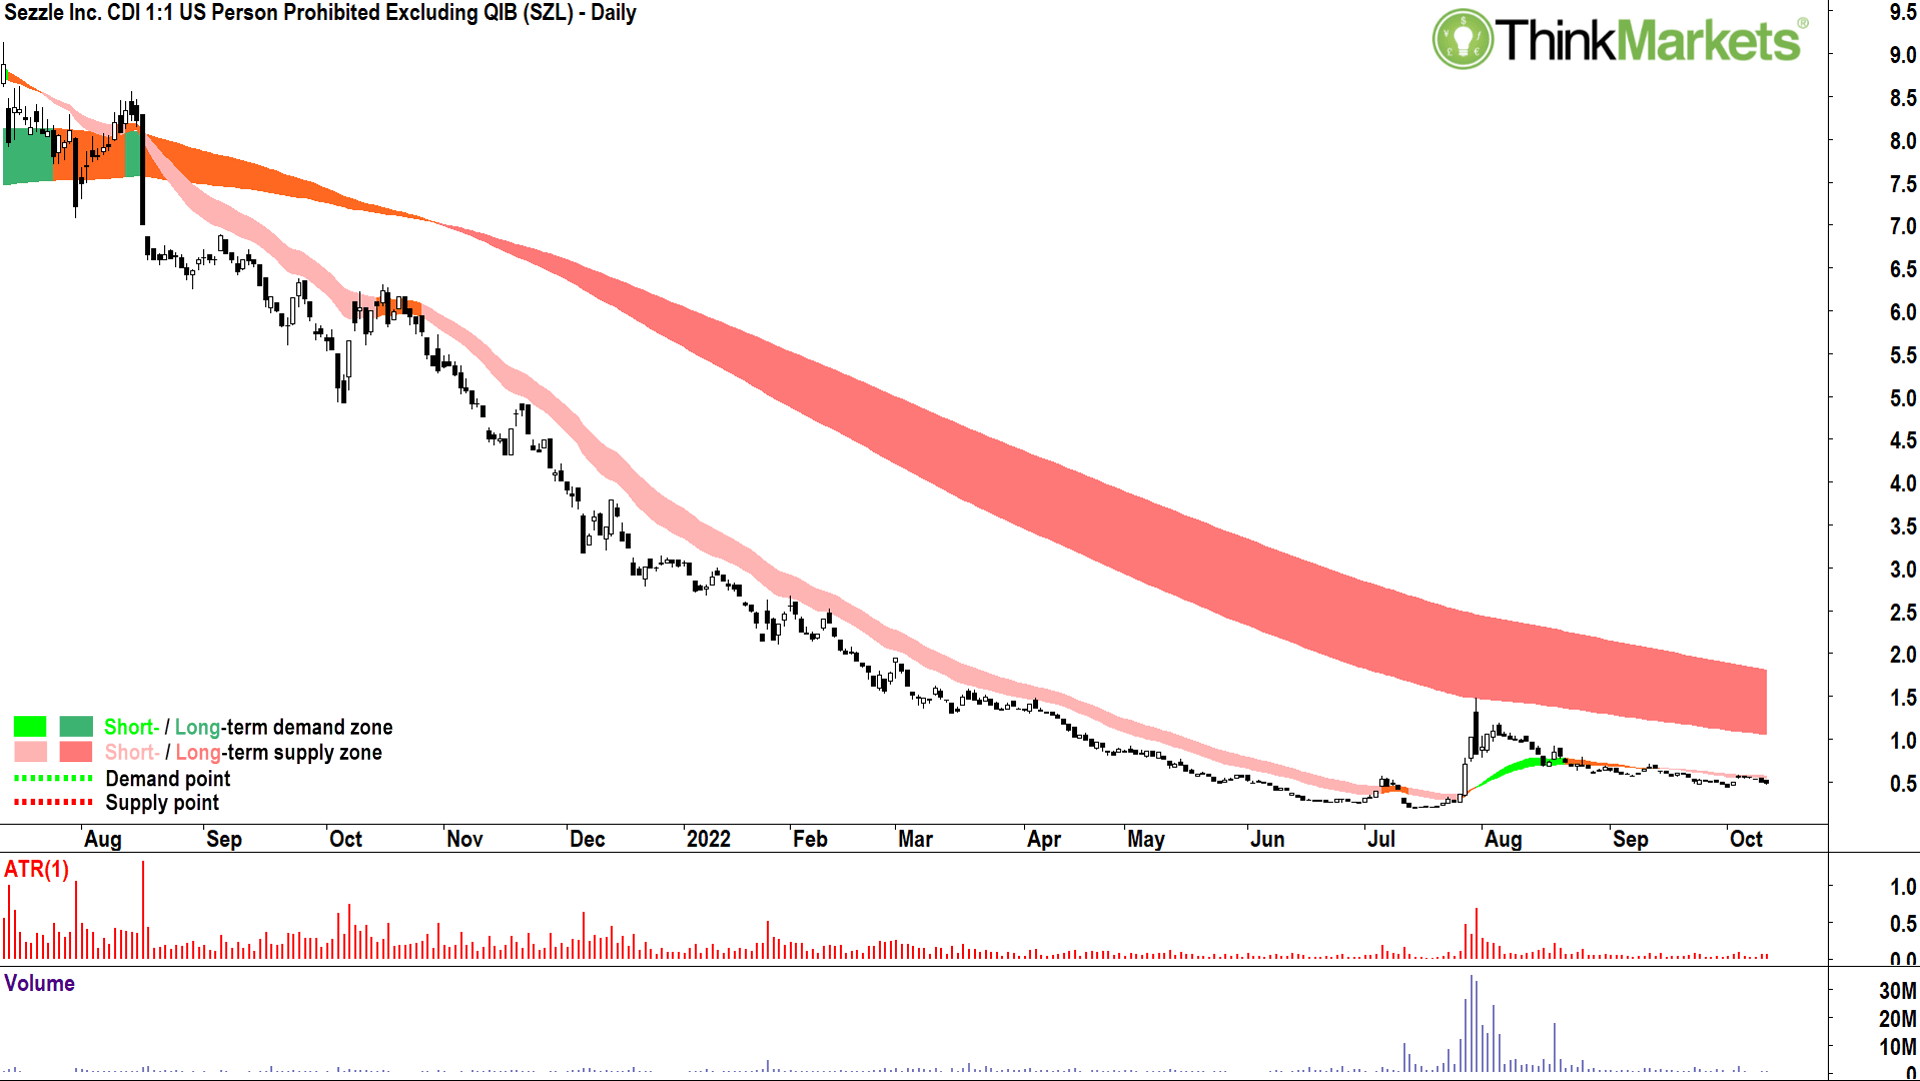
Somehow the SZL chart is the best of this bad bunch. Not that it looks fantastic, mind you, just that it doesn’t look downright awful like the rest.
The momentum to the downside appears to be moderating here, and that’s the first step towards an uptrend. For whatever reason, the market doesn’t hate SZL as much as it did prior to August.
Let me see some higher peaks and higher troughs, and preferably some solid white candles on a burst in volume. Then I might get interested.
Also, keep an eye on the trend ribbons here, a return to a short-term uptrend (light-green zone) is key. After that, ideally SZL then begins dealing with that ominous long-term downtrend ribbon which kicks in around $1.
View: Avoid until a close above the 12 September peak of $0.72
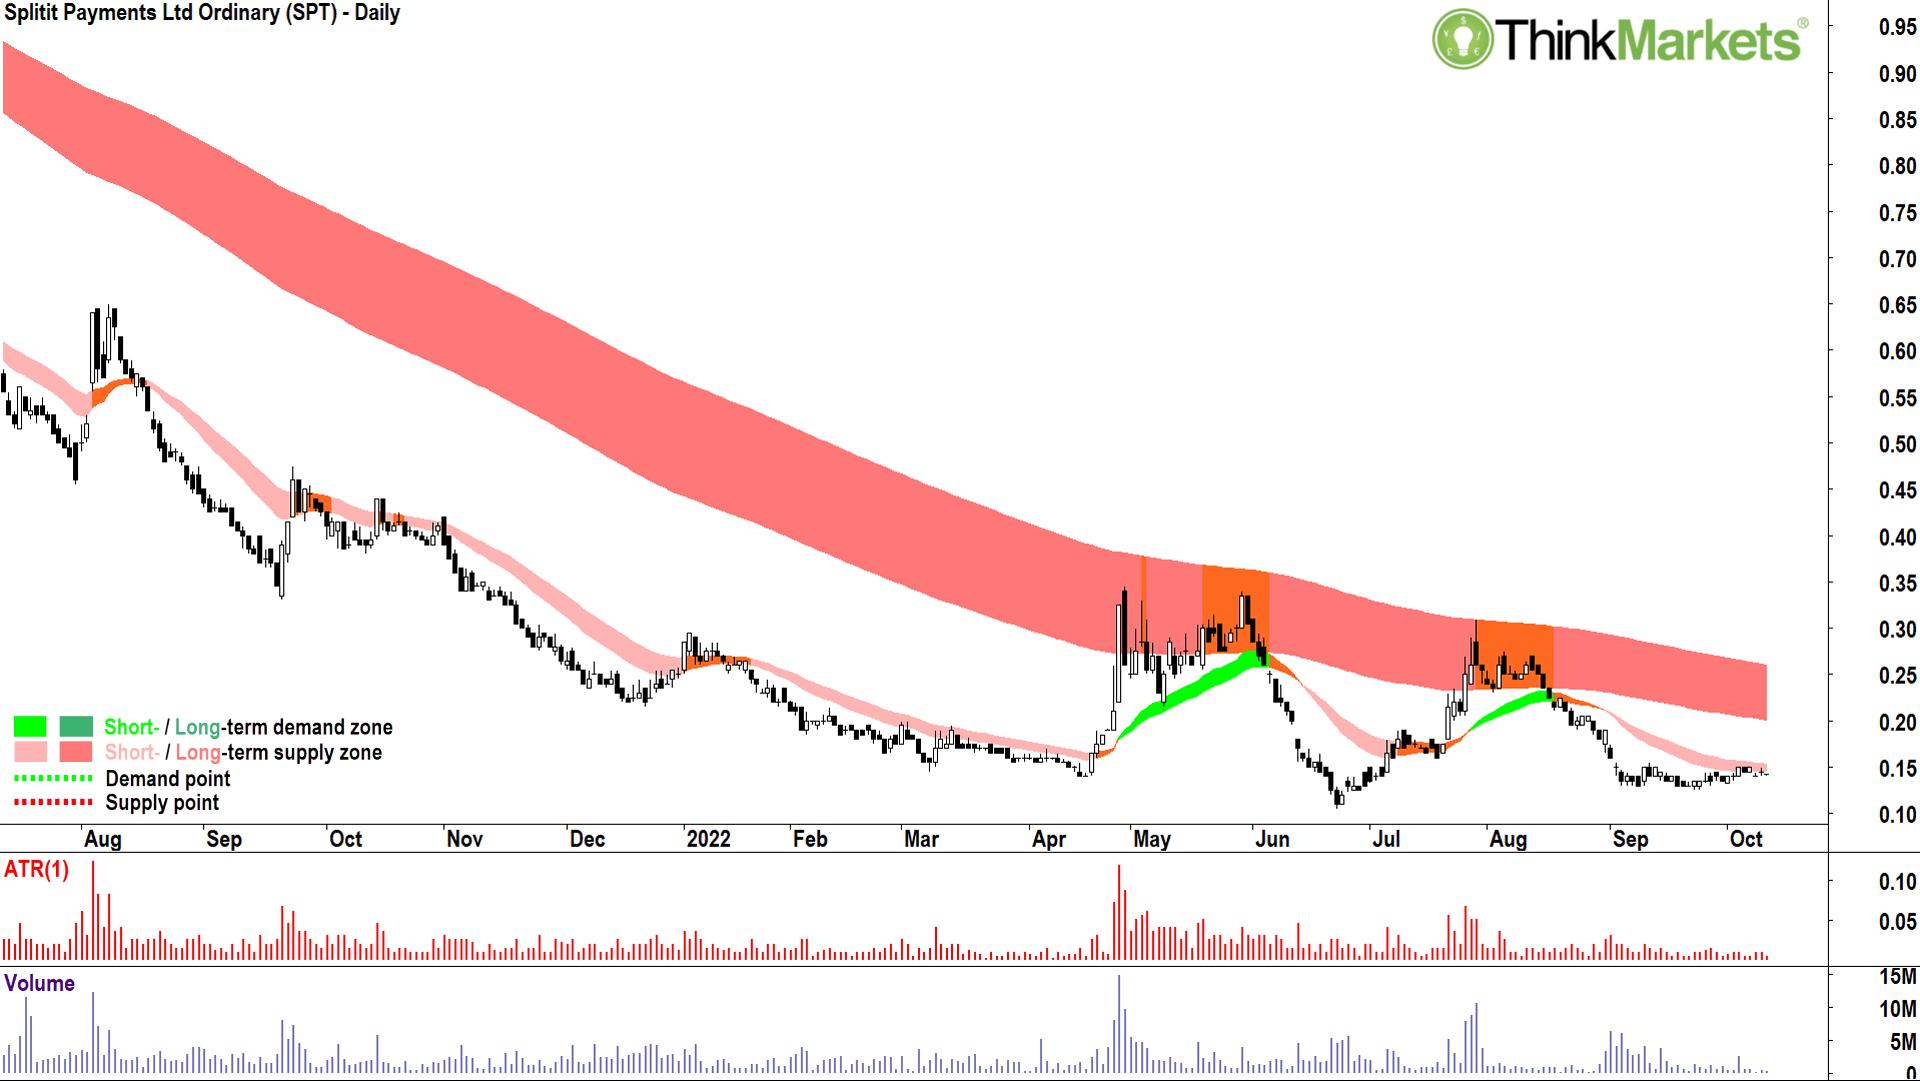
At least you’ve got a firm downside limit on SPT. At 15 cents, give or take, that’s the extent of how much further it can fall. Zero, the ultimate support level!
Like SZL, SPT is starting to flatten out a bit, but it’s hardly showing the signs of demand-side control. You’d be forgiven for forgetting what these signs are by reading this article (hey – we’ve done plenty of demand-side charts in previous additions, see anything I’ve written on coal stocks!).
Demand-side control equals rising short- and long-term trend ribbons, higher peaks and higher troughs, and predominantly white candles. You won’t find many of these items here.
View: Avoid until a close above the 28 July peak of $0.31.
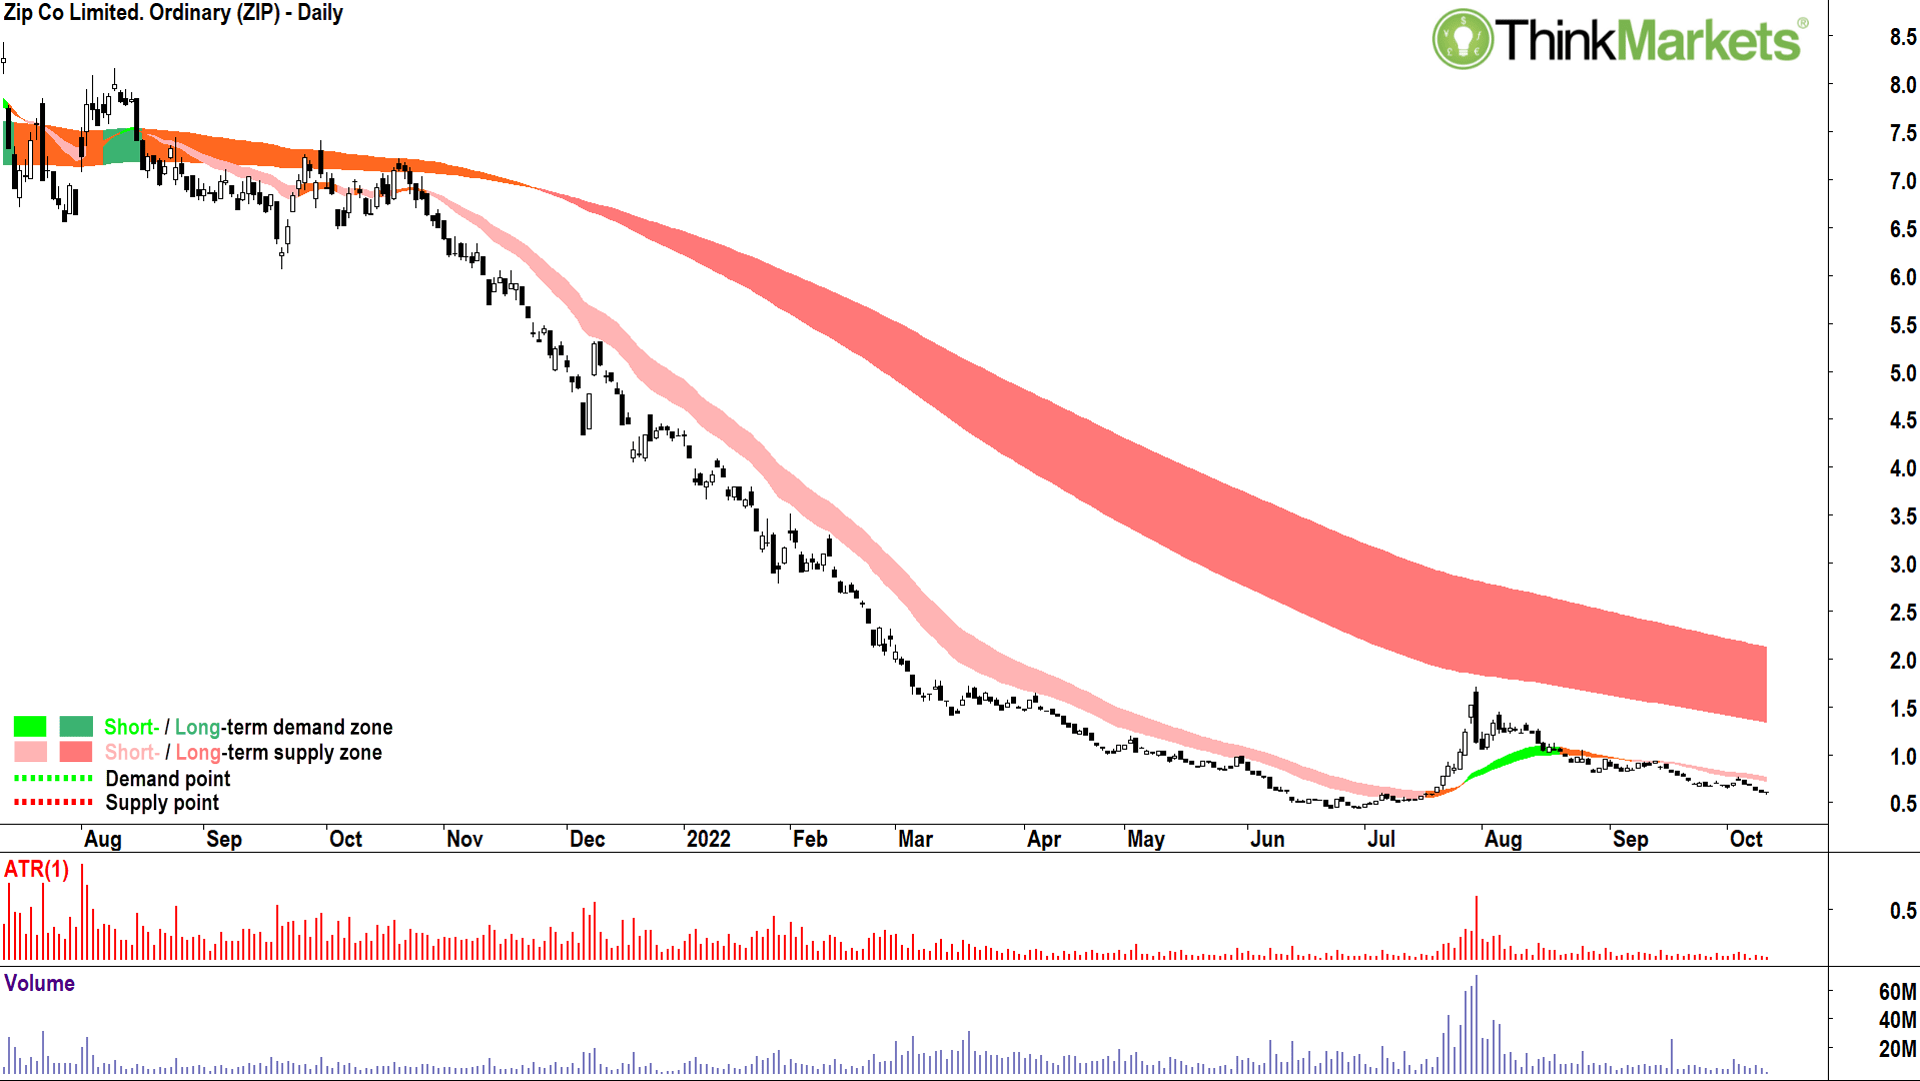
The best for last? Hardly.
Hopefully this isn’t a peek into the future for SZL and SPT – each of which have seen their short-term trends flatten out. ZIP’s short-term trend flattened around June, it even turned up in July, but the recent trend shows it’s once again losing the demand-side battle.
Long-term downtrend, short term downtrend, price action sketchy, and back to predominantly black candles.
Strike, strike, strike, and strike.
Worse still, apart from the drove of investors still holding onto ZIP from on the way up…and on the way down, that last little burst in July created a new batch of “stuck” investors.
This means different layers of investors praying, hoping for their chance to finally get out at break even. It just smacks of supply absolutely everywhere and all the way back up.
Breakeven is looking like a bleaker prospect every day.
View: Avoid until a close above the 13 September peak of $0.94.
Ok, I’ve depressed the hell out of you.
For that I apologise. And unless you’ve woken up from this party, with tattoed face and in Thailand, then you’ve fulfilled the first lesson of trading.
But the key message here is analysis of charts, and more specifically of the trend.
These are learned skills and can help keep you out of sticky situations like many investors find themselves in among the 6 BNPL stocks we’ve discussed here.
You can continue to bang away trying to buy low and sell high based upon news, tips from talking heads, and gut feel, intuition or astrology. But for me, it’s trusting the trend.
It’s not a religion, but it is a party. And it is just getting started!
Candle out!


Get the latest Stockhead news delivered free to your inbox.