
News
ASX Small Caps Lunch Wrap: Who found out there really are monsters in the walls this week?

News
ASX Small Caps Lunch Wrap: Inflation a little higher than expected, but then so is the ASX

Mining

2024. Weird, but nice. Via Getty
Experts
Just before year’s end, Saxo’s Head of Equity Strategy Peter Garnry wondered whether 2024 can once again surprise everyone.
Consensus, he said, is increasingly on ‘a mild recession in the US’ somewhere around mid-year.
Under the assumption that consensus is always wrong, this leads to two paths in 2024.
1) A ‘hard landing’ scenario as high interest rates finally bite; or
2) A re-acceleration of growth in the global economy.
Michael Gable from Fairmont Equities takes up the argument.
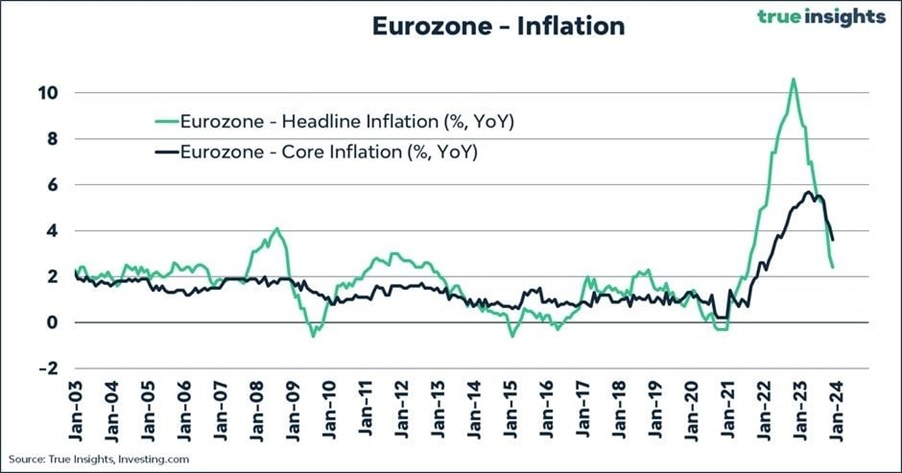
“Inflation, enemy number 1, is on the way down. The trend continues to not only head in the right direction, but it is falling faster than markets had expected,” Michael says.
“Was it transitory after all?”
Headline inflation came in at 2.4% for the year.
Core CPI 3.6%.
Lower than expected and still falling.
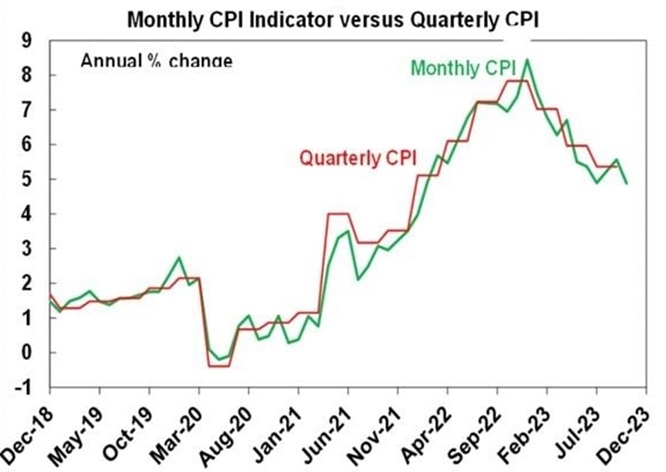
Aussie Monthly CPI was expected to be 5.2% in October after rising 5.6% in Sept.
It came in at 4.9%.
Michael says if the monthly CPI averages 0.3% in Nov and Dec (which is the average of the last three months), then year on year inflation will fall to 3% yoy by December.
This is because +0.9%mom and +1.5%mom from Nov & Dec 2022 will drop out of the calculations.
“That is, in a couple of months from now, inflation could fall sharply into the top end of the RBA’s target,” Michael says.
“Imagine that?”
Annual inflation come in at 3.1% for November, down from 3.2% in the prior month.
Core inflation was unchanged at 4%.
Above where it needs to be, but clearly falling.

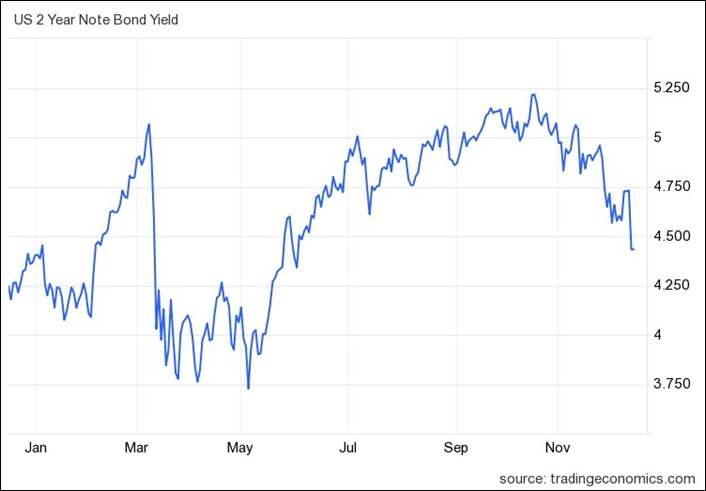
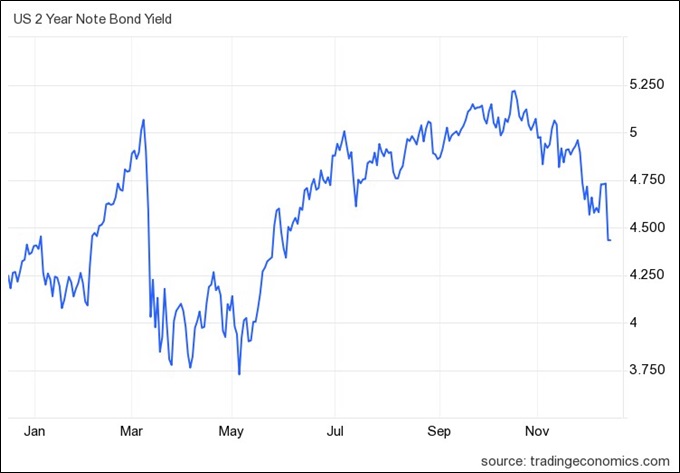
Rising bond yields recently caused havoc with the market.
But Mike says they tend to ‘go up in straight lines and come back down in straight lines.’
“There has never been a sideways path or a ‘higher for longer’. US two years are now down massively from their recent peak as rate cuts next year look increasingly likely.”
“The Australian 3-year, which is a proxy for where our interest rates should be, are now lower than the cash rate and falling,” Gable says.
“Weaker than expected CPI and GDP has flipped expectations of a local rate rise in 2024 into expectations of a rate cut.”
The US ISM is the most reliable PMI for gauging the strength of the US economy, according to Fairmont.
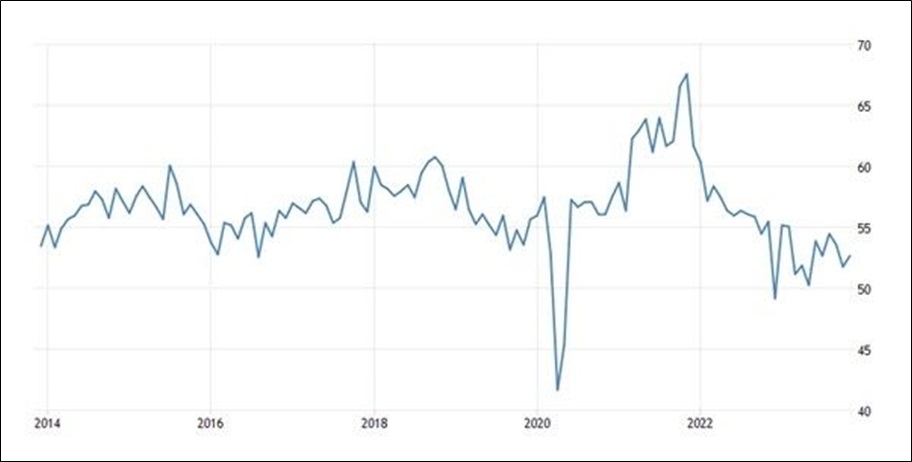
The ISM Services PMI recently increased to 52.7 in November 2023 from 51.8 in October, beating forecasts of 52. A reading above 50 indicates expansion.
“That’s to say, the data is not indicating a recession is on the way. As we can see on the chart, the PMI is forming a trough, (which proves what I have been saying for months now), and this is the time when you get the biggest moves in the share market.
“Not when PMI is very high, but when it is low and starting to head up again.
“With falling CPI, one may suggest that the US economy is in a sweet spot, no recession, but not running too hot. We can make ourselves sound smarter by saying that the market is wrong and soft landings are impossible, but we are here to analyse the data and try to make money from it, not look smart for the sake of it.”
Perhaps things will work out after all?
Interest rates and gold have always tended to move in opposite directions.
Over the past few years, however, this relationship has broken down a bit – with interest rates heading higher and gold prices holding up, Michael says.
“The difference this time is central bank buying. Last year, central banks accumulated 1136 tonnes of gold, which is a record.”
Year to date, central bank gold purchases are up 14% compared to last year, with China being the most significant buyer.
“Why are central banks buying? Countries such as China and Brazil are already starting to sell goods to each other as a way to replace the US dollar (the US dollar is unlikely to be replaced as the global currency of course, but that won’t stop some countries from trying to diminish its importance somewhat.)
“To do this, they will need to settle their current account imbalances using gold. So if gold can hold up in higher rates because of central bank buying, then what can it do when rates fall and central banks continue to purchase?”
Mike says it’s also useful to compare the price of gold to the money supply.
“The (below chart) shows the relationship between the size of the Fed’s balance sheet and the US Treasury’s gold holdings.
“Gold is more undervalued today compared to the late ’60s or ’90s, which were the last times we saw big increases in the price of gold. So even though gold is up more than 7x in the past 23 years, the Federal Reserve’s balance sheet has grown even faster.”
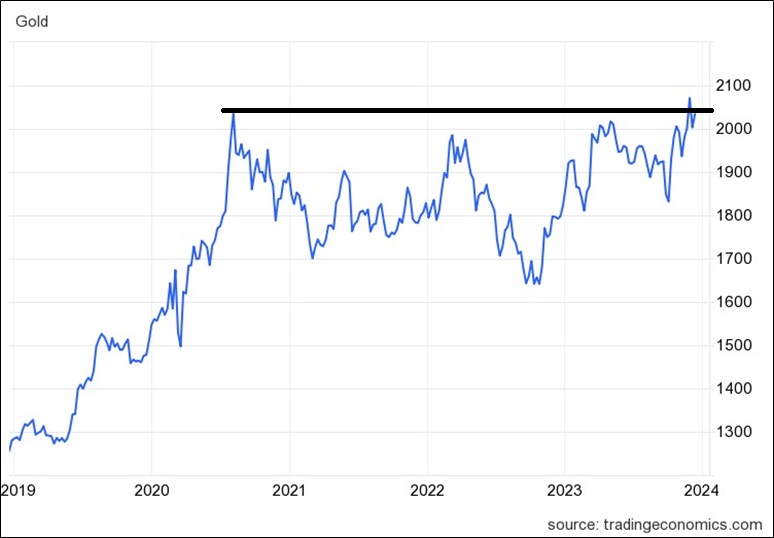
So… gold at an all time high is undervalued?
“In brief, yes, that is clearly possible.
“With the gold chart looking to break through a long term resistance level right now, don’t be too worried about the day to day movements. I would be looking to see how it trades on a monthly chart, not a daily chart.”

“Falling interest rates, central bank buying, over a decade of excess money printing, can mean only one thing for the next few years – upwards pressure on the price of gold. So forget the daily noise for now.”
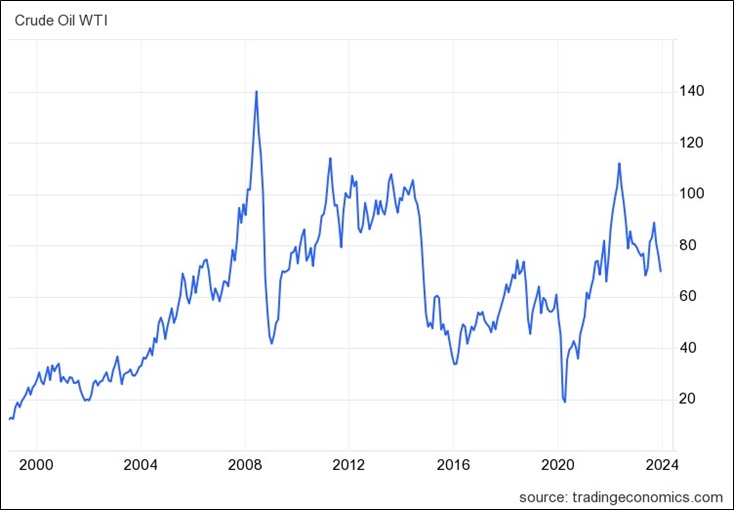
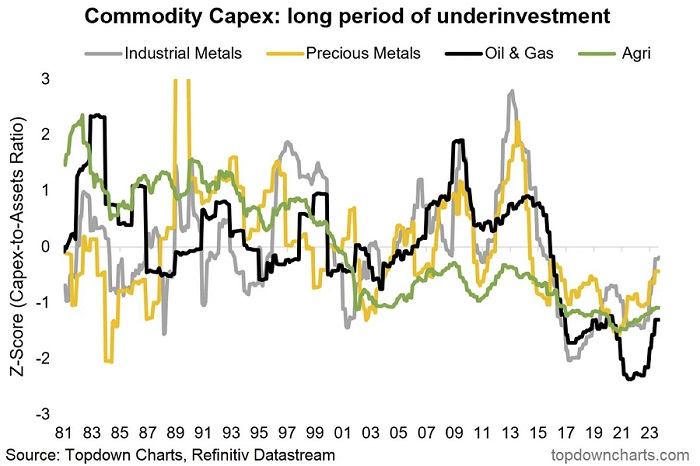
“Oil is back down to the 15-year average price and I expect it to stablise here and then recover again. Energy stocks are still very much under owned by investors. They account for less than 5% of the S&P 500, well below the historical average of 14%.”
However, the outlook by the International Energy Agency (IEA) is gloomy.
Between now and 2040, global energy demand is projected to fall by 3%, despite real GDP capital growing by 40%.
“By then we will experience rapid growth in emerging markets. When an economy is very poor, it consumes little energy,” Michael reckons.
“As it reaches middle-income, its energy demand grows materially. The IEA has a history of being pessimistic in its demand forecasts. Ignoring the COVID year of 2020, they have underestimated demand in 12 out of the last 14 years, by an average 820,000 barrels per day.
“Global oil markets are already in a structural deficit. Crude demand exceeded production in 2021. Massive releases from the US strategic reserves, driving levels to a 40-year low, have masked this deficit. The US stopped releasing from this reserve in June.
“When markets realise that the economy is holding up, oil and gas demand is not in free fall, and supplies are low, the record low investment levels in oil companies will be a thing of the past.”
“Prime Permian acreage that could be bought for US$5000 per net royalty acre a few years ago is now fetching over US$25,000. Exxon has announced it will purchase Pioneer Natural Resources and Chevron will buy Hess, for transactions totalling US$120b.”
The IEA’s projections of lower demand are based on the assumption of improved efficiency.
But Gable says, bluntly – never has improved efficiency reduced demand.
“In 1865, an English economist, William Jevons noticed that as steam engine efficiency improved, it lead to greater demand for coal, not less. Jevons Paradox concludes that improved efficiency leads to accelerated consumption. Over the past few decades, as cars became more efficient, they have not become smaller and lighter.
“As it became more efficient to cool or heat your home, houses have not become smaller. And as it become more efficient to fly a plane, we haven’t traveled less.
“As energy becomes more efficient, we won’t use less of it, we will consume more.”
Talking about oil naturally leads onto talk about uranium and Gable’s been clear on this one.
“Last year there was notable wind and solar projects which were cancelled or delayed due to rising costs. It takes a lot of resources to get a renewable energy project up and running.
“When money and energy were cheap, there was progress being made, but the numbers just don’t stack up anymore with higher interest rates and commodity costs.
“This is why governments are tuning to nuclear power to fill in the gap,” he says.
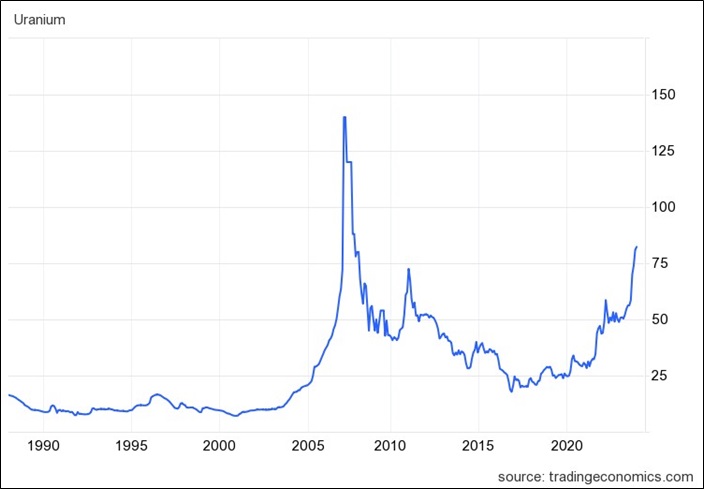
“Looking back over the past 30 years, the fall of the Soviet Union and agreements between Presidents Bush and Yeltsin in the early ’90s saw uranium from old warheads hit the market and there was excess supply. As producers adjusted, supply fell away, became low again, and then the price of uranium took off in the mid 2000s.
“This is the classic merry-go-around that we have become familiar with commodities supply and demand.
“The Paladin Energy (ASX:PDN) share price soared from about 5c to over $9. As usual, supply caught up after 5 years and prices collapsed. Then in 2011, the Fukushima disaster led to a closure of plants, and the excess inventory from Fukushima was sold into the market – excess supply meeting low demand, and the uranium price collapsed again.”
It certainly appears as though these stockpiles have been completely worked through.
“For the first time, uranium is in a structural deficit which will once again take years to correct,” Gable says.
“The Sprott Physical Uranium Trust, which buys and sells physical uranium, has been only able to source small amounts in recent months, leaving it with about $60m of cash on its balance sheet.
“That is, a physical backed trust just can’t find enough physical to buy. It would be like a physical backed gold ETF not being able to buy anymore gold and just sitting on the cash.
“More and more countries are announcing movements back into nuclear energy to meet their zero emission targets, and with almost no uranium around, we could see quite a move in uranium prices for years before supply finally catches up.”
The price of iron ore has surprised all the analysts this year.
“We have noticed that they have started to slowly move up their very low price targets on the iron ore miners, but they are still skeptical. Once they start becoming bullish, that will add more fuel to the big miners to head higher.
“We have been bullish on Fortescue (ASX:FMG) shares all year, noting that a break above $23 will lead to levels in the high $20s. That is now happening but all the other analysts are still slow to react.
Michael says recent comments by the Vale CEO suggest that the market will be tight for a while yet.
“Chinese PMIs have looked weak but they clearly are numbers that need to be taken with a pinch of salt, or to put it a bit more honestly, the numbers can’t be trusted. Chinese stimulus is clearly working behind the scenes, how else do you account for a 16% spike in the iron ore price in the past 6 weeks?
“It will only be a matter of time until the market realises that China is recovering.
“We thought the start of this would have been earlier this year and it has taken longer than we thought, but we are finally getting there.”

“We can also see this bottoming of the Chinese economy through their consumption of copper,” Michael adds.
Dr Copper’s long been regarded as a bellwether for economic growth.
“For the first eight months or 2023, year on year copper demand is up 11% and most of that is coming from China.”
Chinese demand is up 12% year on year for the first nine months of this year, while out of India, demand is now up 36%.
“On a days of cover basis, inventories are now at three days, a level which historically leads to near-term price spikes.”
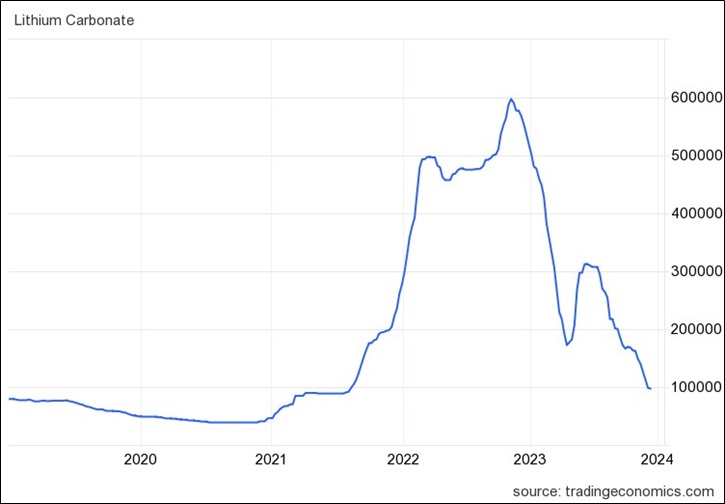
Lithium carbonate and spodumene prices have collapsed about 80% this year.
But they are now breaching the top of the cost curve, Michael reckons.
“Just like nearly 10 years ago with iron ore when FMG was back to $2 and on its knees, investors in lithium are wondering when the Chinese ‘high cost, low quality’ producers will curtail production.
“The past few weeks has seen the pace of selling pick up and bearish analysts turn more bearish and my recent comments to clients and in the media was that we could be seeing some capitulation in the price. The headlines suggest that demand is lower than expected, and that seems to be the story this year with China’s recovery.
“But as highlighted earlier, improving PMIs out of the US and Chinese demand for iron ore and copper suggest that we could be at or near an inflection point.”
“Those that closely study lithium supply suggest that there actually hasn’t been a surge in supply during the past year. There have been a number of new projects being announced, which gives the impression of high supply.
“Recent M&A activity in the space also suggests that those close to the ground are seeing the need to add to their exposures before interest returns to the sector. And just in the past few days, we have seen some massive rebounds in lithium stocks which adds more weight to my idea that recent weakness was capitulation and we have seen the lows.”
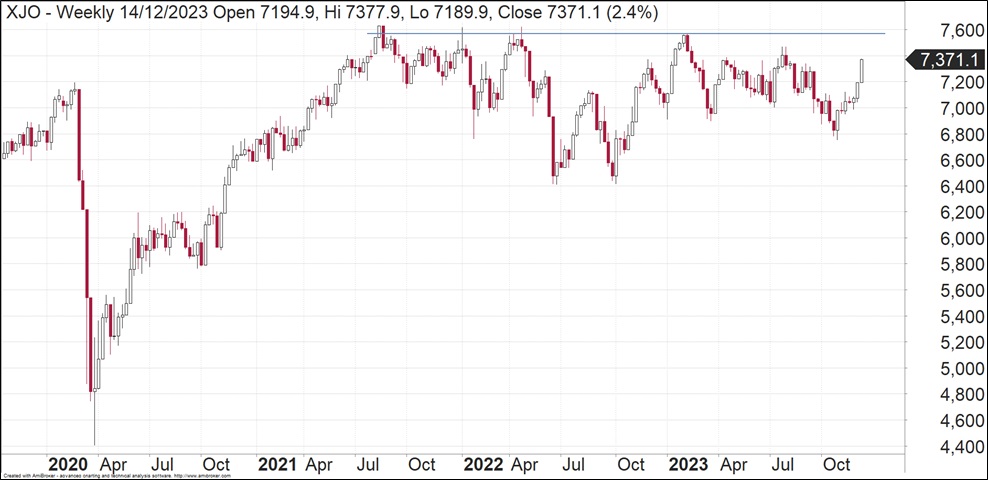
The S&P/ASX 200 powered ahead throughout the pre-Xmas pewriod.
“Lower CPI and lower yields are good for the market. It will help interest rate sensitive stocks in particular. Improving economic activity and lower US yields will also lead to a lower US dollar, which is good for resources,” Mike says.
“2023 has been particularly frustrating, especially the day by day movements. However, when we zoom out and look at the bigger picture then the outlook becomes more exciting. We have essentially been in a ‘bear’ market for two years. Maybe not by pure definition, but two years of a market that hasn’t trended and hasn’t moved to new highs uniformly across most sectors.
“Those that study markets history will know that these bear markets may go on for two years but they never extend into the third.
“Normally by then markets start trending more normally again as whatever caused the original problem starts to get unwound and we return to normality. We can see here a number of examples where a year or two of consolidation led to the next rally.”

In terms of how the charts are looking for the broader market, Fairmont has been saying for months that the overall market has essentially traded sideways for the past two years.
“It has formed a very clear level of resistance near 7600 and the overall pattern resembles that of an ‘inverse head and shoulders’.
“This means that we are looking for our market to retest that 7600 level. Because that level has been in place for so long, when we get an eventual breakout, the result will be a very powerful move. It is similar to our view that when FMG finally gets above $23, then it would lead to a powerful move.
“In the case of the market, as I’ve been saying since earlier this year, a break above 7600 could see the market swiftly move to over 8000 and this is likely to occur in 2024.”
“All this means that I am looking forward to what lies ahead in 2024.
“We are starting to see a lot of the uncertainty from this year around interest rates, inflation, etc start to give way so this will lead to more reliable moves in the market especially in those sectors mentioned above.
“Usually the first year of a recovery is the strongest so now is the time to really get stuck into making the most of it.”
Michael is the CIO and Founder at Fairmont Equities, a premium share advisory firm assisting private clients with the professional management of their share portfolio.
The views, information, or opinions expressed in the interviews in this article are solely those of the interviewees and do not represent the views of Stockhead. Stockhead does not provide, endorse or otherwise assume responsibility for any financial product advice contained in this article.
News
News
Mining

Mining

Mining

Mining


Get the latest Stockhead news delivered free to your inbox.