Who made the gains? Here are November’s top 50 small cap miners and explorers
Pic: Bloomberg Creative / Bloomberg Creative Photos via Getty Images
November was a weaker month for commodity prices across the board.
Nickel’s boisterous late-year run is well and truly over – for now, anyway – as prices continued to slide from $US16,745/t ($24,501/t) to end the month at $US13,805/t.
>>Scroll to the end for November’s Top 50 small caps
Copper managed to consolidate October’s slight gains to finish at around $US5,850/t. Pundits call it ‘Dr Copper’ because the red metal’s performance is a gauge for the health of the global economy. Economy bad = copper bad.
Gold, on the other hand, thrives on global economic Armageddon — which is why we can overlay gold and copper prices and get 12-month charts that look like this:
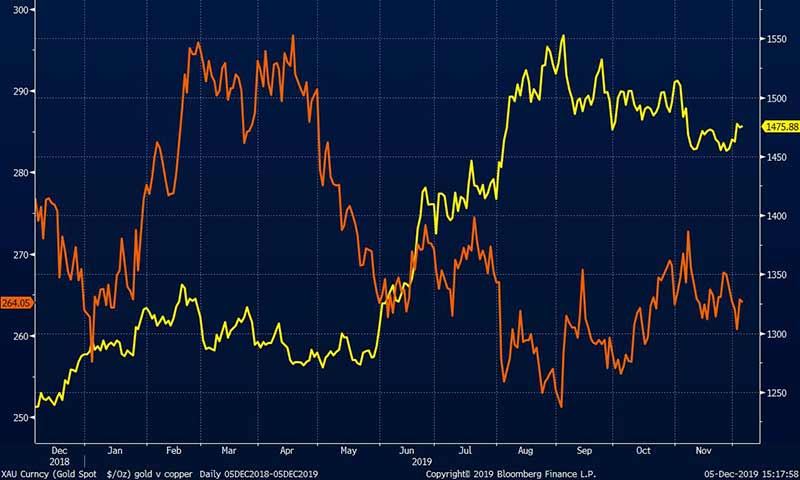
November saw gold soften about 3.7 per cent to end the month at $US1,454/oz. Still, the precious metal is up 17 per cent over the past 12 months; a fantastic return.
After a solid little uptick last month, both zinc and lead were on the receiving end of a November smackdown.
Iron ore went on a rollercoaster, first nosediving then slowly trudging back to where it started on the back of stronger than expected steel demand.
The beleaguered battery metals suite took another hit, with cobalt, lithium and graphite prices falling solidly through November.
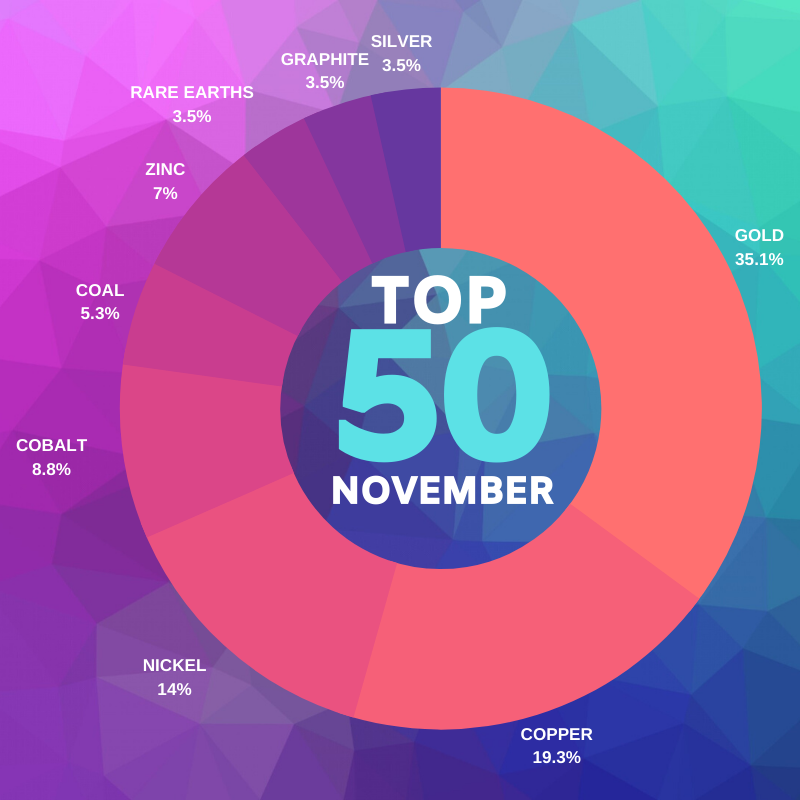
And it shows. Lithium doesn’t even get a look-in to our Top 50 which is dominated — once again — by gold, copper, and nickel:
TOP STOCKS: NOVEMBER HIGHLIGHTS
Metalstech (ASX:MTC) +231%
Market Cap: $6.2m
MetalsTech recorded the biggest one-day gain for an ASX stock in 2019 after announcing that it had signed an option agreement to acquire a 1.1-million-ounce gold project in Slovakia.
The former battery metals microcap has about a month to complete due diligence on the Sturec project, which historically produced +1.5moz of gold and 6.7moz of silver.
And by ‘historically’ we mean 8th century onwards.
It’s a stunning piece of ground:
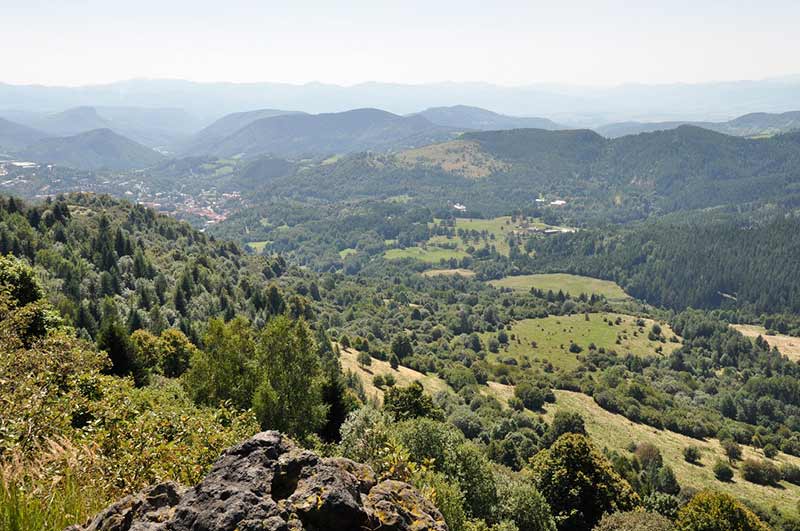
“If we complete on the option we will immediately get to work on a series of high impact and low cost technical exercises to bring the project from JORC (2004) to JORC (2012) standard, design a resource upgrade exploration plan, as well as deliver an optimisation study for the pre-feasibility study,” chairman Russell Moran says.
JORC refers to the mining industry’s official code for reporting exploration results, mineral resources and ore reserves.
“We are also in discussions with potential non-equity focused strategic investors interested in accelerating development of the Sturec project, should we complete on the option,” he says.
Bougainville Copper (ASX:BOC) +160%
Market Cap: $102m
This was the entirety of Bougainville’s latest quarterly report:
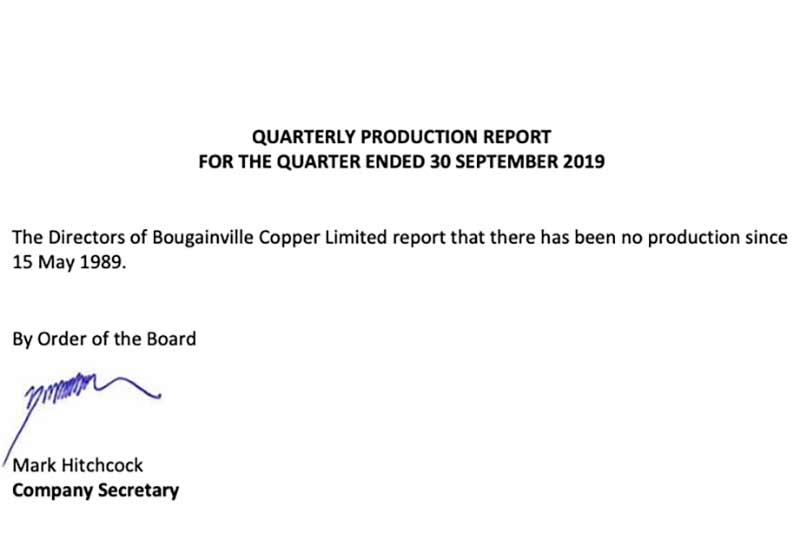
Pretty sad stuff. But in late November Bougainville received a speeding ticket from the ASX after the stock rocketed from 13c to 49c per share in five days.
The company says the gamechanging referendum currently being held in Bougainville “may have attributed to increased confidence in the region”.
READ: Will Bougainville’s resources remain a curse, or become a cure?
Celamin (ASX:CNL) +115%
Market Cap: $21m
We profiled battered explorer Celamin (ASX:CNL) as a stock due for re-rate in early February.
At that time, it had a market cap of $4.7m.
That’s because Celamin had been in dispute with its partner in Tunisia for several years over a tidy looking phosphate project.
The company has now got the upper hand legally – this dodgy partner will now be forced to pay ~$US4.4m or hand over 100 per cent of the project. Sometimes the good guys get a win.
Egan Street Resources (ASX:EGA) +51%
Market Cap: $66.3m
In July, the $970m Silver Lake Resources (ASX:SLR) lobbed an attractive takeover bid at high-grade success story Egan Street.
Egan Street is focused on developing its Rothsay project — a high-grade, underground development just 85km south-east of Silver Lake’s Deflector mine and processing hub in WA.
This deal valued Egan Street at 40c per share, giving it a $52.2m market cap.The Egan Street board unanimously recommended the offer.
In October, Egan Street received a competing takeover proposal from privately owned Adaman Resources. But Silver Lake — which had final dibs —just increased its final offer to 50c per share (or $68.3m market cap). Bonus.
Here’s the top 50 mining small caps for the month of November >>>
Scroll or swipe to reveal table. Click headings to sort. Best viewed on a laptop
| CODE | NAME | % RETURN | PRICE 01 NOV | PRICE 30 NOV | MARKET CAP |
|---|---|---|---|---|---|
| MTC | METALSTECH | 231 | 0.016 | 0.053 | 6.20M |
| AYM | AUSTRALIA UNITED MINING | 200 | 0.001 | 0.003 | 5.53M |
| BOC | BOUGAINVILLE COPPER | 160 | 0.098 | 0.255 | 102.27M |
| CNL | CELAMIN | 115 | 0.065 | 0.140 | 20.91M |
| GAL | GALILEO MINING | 86 | 0.105 | 0.195 | 23.47M |
| LIN | LINDIAN RESOURCES | 86 | 0.014 | 0.026 | 13.14M |
| MRQ | MRG METALS | 83 | 0.006 | 0.011 | 9.82M |
| MTH | MITHRIL RESOURCES | 67 | 0.006 | 0.010 | 4.90M |
| MRD | MOUNT RIDLEY MINES | 67 | 0.002 | 0.002 | 6.71M |
| EGA | EGAN STREET RESOURCES | 51 | 0.315 | 0.475 | 66.33M |
| MZZ | MATADOR MINING | 50 | 0.170 | 0.255 | 25.22M |
| CNJ | CONICO | 44 | 0.009 | 0.013 | 5.00M |
| ARL | ARDEA RESOURCES | 38 | 0.520 | 0.720 | 84.46M |
| A4N | ALPHA HPA | 38 | 0.145 | 0.200 | 126.42M |
| RHI | RED HILL IRON | 38 | 0.158 | 0.217 | 11.92M |
| KNL | KIBARAN RESOURCES | 36 | 0.070 | 0.095 | 29.18M |
| ORM | ORION METALS | 36 | 0.014 | 0.019 | 9.31M |
| HAW | HAWTHORN RESOURCES | 34 | 0.056 | 0.075 | 24.50M |
| DDD | 3D RESOURCES | 33 | 0.002 | 0.002 | 2.31M |
| AUL | AUSTAR GOLD | 33 | 0.003 | 0.004 | 13.56M |
| MAG | MAGMATIC RESOURCES | 29 | 0.140 | 0.180 | 27.57M |
| CMD | CASSIUS MINING | 29 | 0.007 | 0.009 | 2.59M |
| SRK | STRIKE RESOURCES | 28 | 0.039 | 0.050 | 8.36M |
| BAR | BARRA RESOURCES | 25 | 0.020 | 0.025 | 14.91M |
| MGT | MAGNETITE MINES | 25 | 0.004 | 0.005 | 4.31M |
| DAU | DAMPIER GOLD | 25 | 0.016 | 0.020 | 3.81M |
| BMG | BMG RESOURCES | 25 | 0.004 | 0.005 | 2.93M |
| TRL | TANGA RESOURCES | 25 | 0.002 | 0.002 | 4.67M |
| AOA | AUSMON RESOURCES | 25 | 0.002 | 0.002 | 1.58M |
| GBZ | GBM RESOURCES | 25 | 0.040 | 0.050 | 5.91M |
| HMX | HAMMER METALS | 24 | 0.021 | 0.026 | 11.41M |
| CR1 | CONSTELLATION RESOURCES | 24 | 0.210 | 0.260 | 9.10M |
| CKA | COKAL | 23 | 0.039 | 0.048 | 44.08M |
| SUH | SOUTHERN HEMISPHERE MINING | 23 | 0.022 | 0.027 | 2.49M |
| MRR | MINREX RESOURCES | 22 | 0.009 | 0.011 | 1.05M |
| NTU | NORTHERN MINERALS | 22 | 0.050 | 0.061 | 155.88M |
| NCR | NUCOAL RESOURCES | 21 | 0.014 | 0.017 | 13.07M |
| ADT | ADRIATIC METALS | 21 | 1.085 | 1.315 | 233.57M |
| NUS | NUSANTARA RESOURCES | 20 | 0.295 | 0.355 | 59.86M |
| MMI | METRO MINING | 20 | 0.125 | 0.150 | 207.73M |
| GMC | GULF MANGANESE | 20 | 0.005 | 0.006 | 31.11M |
| LML | LINCOLN MINERALS | 20 | 0.005 | 0.006 | 3.45M |
| RDS | REDSTONE RESOURCES | 20 | 0.010 | 0.012 | 5.69M |
| PEC | PERPETUAL RESOURCES | 20 | 0.030 | 0.036 | 11.45M |
| RWD | REWARD MINERALS | 20 | 0.100 | 0.120 | 19.51M |
| CYL | CATALYST METALS | 20 | 2.540 | 3.040 | 250.47M |
| BRL | BATHURST RESOURCES | 20 | 0.092 | 0.110 | 187.77M |
| EM2 | EAGLE MOUNTAIN MINING | 19 | 0.160 | 0.190 | 19.74M |
| TSL | TITANIUM SANDS | 19 | 0.016 | 0.019 | 12.07M |
| DAF | DISCOVERY AFRICA | 19 | 0.016 | 0.019 | 3.46M |
Related Stories


UNLOCK INSIGHTS
Discover the untold stories of emerging ASX stocks.
Daily news and expert analysis, it's free to subscribe.
By proceeding, you confirm you understand that we handle personal information in accordance with our Privacy Policy.


