

Experts
Barry FitzGerald: This copper junior's pooling the bulk tonnage that gets the big end of town buying

Experts
CRITERION: Has this stock been given the right royal treatment it deserves?

Mining

Pic: Bobex-73, iStock / Getty Images Plus
Mining
Our High Voltage column wraps all the news driving ASX stocks with exposure to lithium, cobalt, graphite, nickel, rare earths, manganese, magnesium, and vanadium.
Between January 2020 and February 2023, the Nasdaq Sprott Energy Transition Materials index (NSETM) (197.81%) outperformed the S&P 500 (31.52%) and the MSCI World Metals and Mining Index (81.06%) by considerable margins.
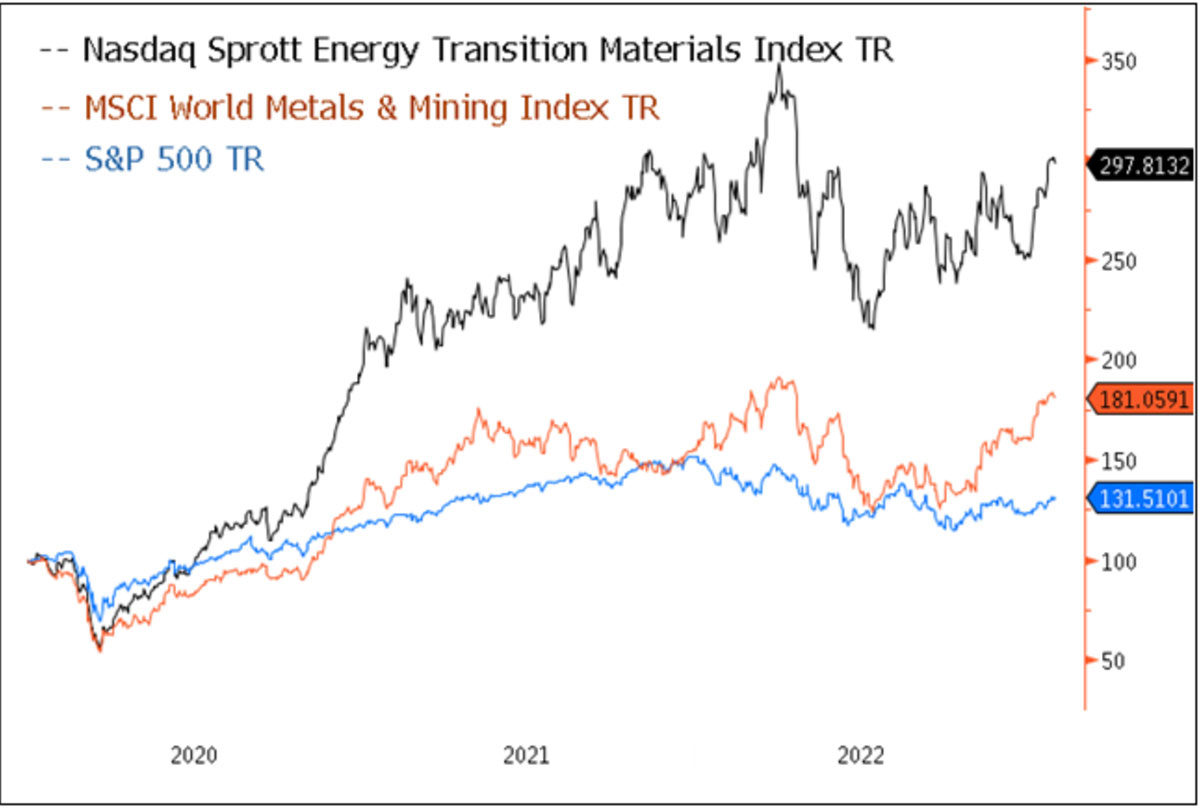
The good news for investors late to the party is this: from an investment cycle perspective, we are likely only in the early stages, say Sprott Asset Management market strategist Paul Wong and ETF product manager Jacob White.
“We believe the post-pandemic era marks the beginning of a new supercycle for commodities, especially for critical minerals driving the clean energy transition,” they say.
“Investment opportunities presented by the clean energy transition will likely centre around the critical minerals vital to powering the planet through low-carbon energy sources and revolutionizing the transportation sector through the electrification of the world’s vehicle fleet.
“Escalating geopolitical tension and the need for governments to re-shore supply chains and production to ensure industrial security have helped to accelerate the transition, which will be commodity- and capital-intensive.
“We foresee a demand shock for commodities, particularly critical materials.”
What do Sprott’s Wong and White say about the outlook for battery metals?
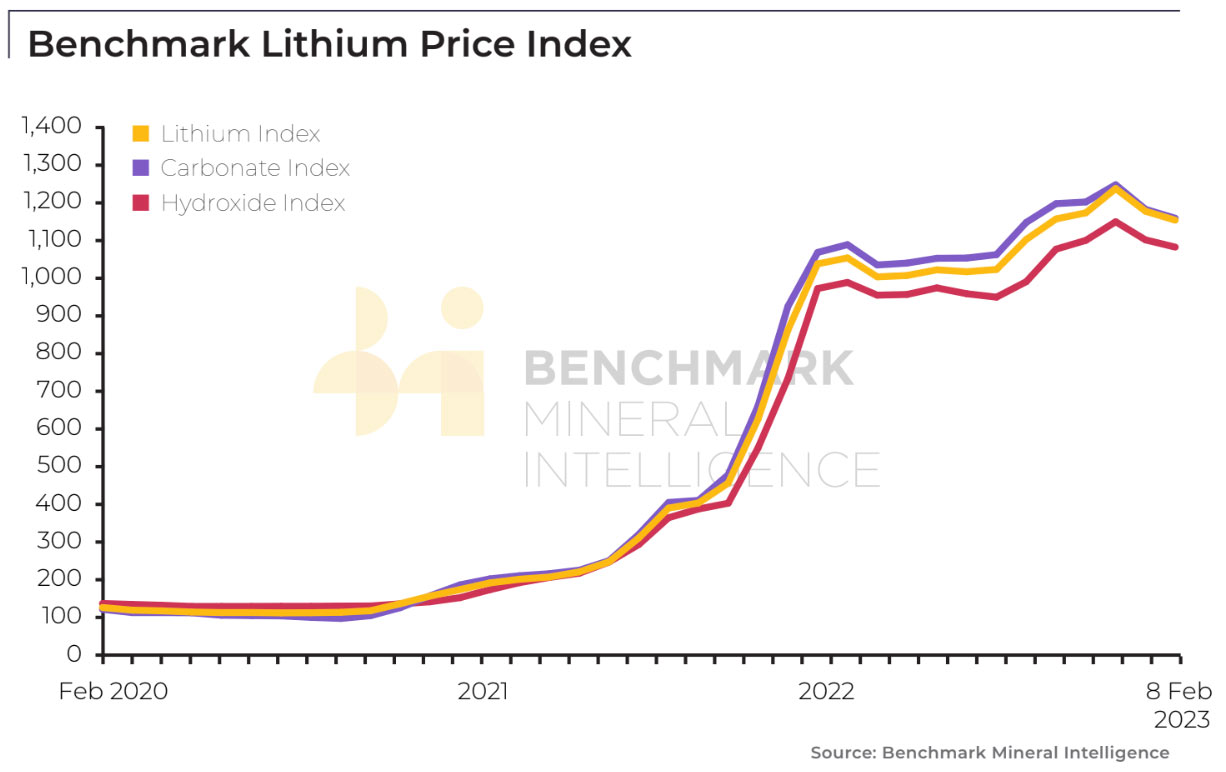
“Lithium prices have entered a consolidation range after nearly quintupling in price since mid-2021,” they say.
“Some softness in consumer spending has weighed on lithium demand in the short run.
“Forecasts for 2023 by investment banks and other price forecasters have also been mixed. Some estimate that the lithium market will be in surplus for 2023, while others cite supply challenges (i.e. longer lead times) that will result in a supply deficit.
“Nevertheless, lithium demand is expected to grow substantially in the long run to meet EV demand, and we believe supply is unlikely to keep up.”
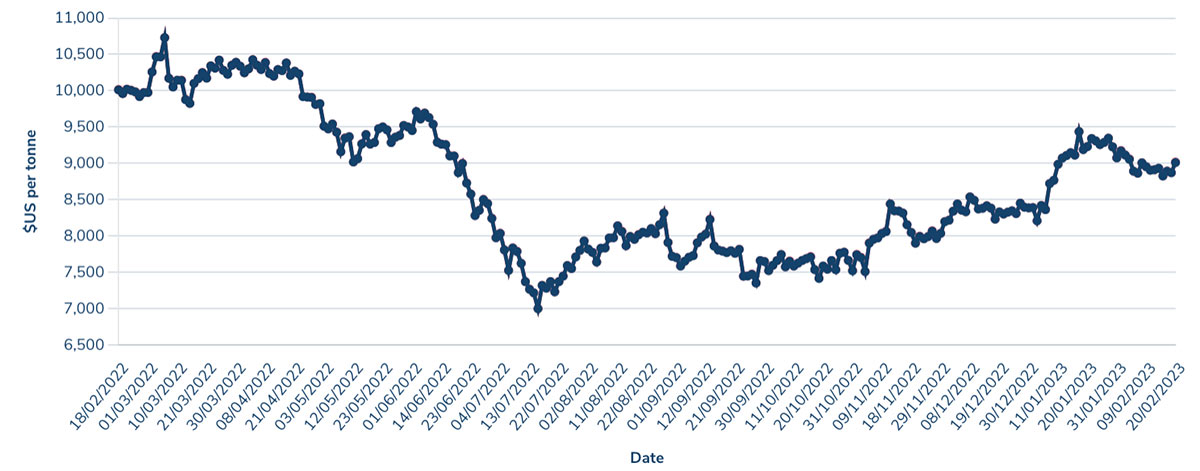
“Copper has many uses in the global economy and is tied more closely to macroeconomic trends than other energy transition materials,” they say.
“Copper is cyclical and has benefitted from the reversal of the 2022 strong USD and the forecasted slowing of Fed interest rate hikes.
“China is by far the largest consumer of copper, and the reversal of its zero-COVID policy to full reopening has acted as a tailwind for the metal.
“Looking ahead, increased demand for copper is expected to be fueled by the global energy transition.
“Copper is critical for conducting electricity in renewable energy sources, including wind and solar, but especially for electric vehicles and electricity grid investments.
“We believe that the additional demand expected from energy transition needs, a disruptable supply chain, low copper inventories, and declining ore grades may lead this market into a supply-demand deficit in the future.”
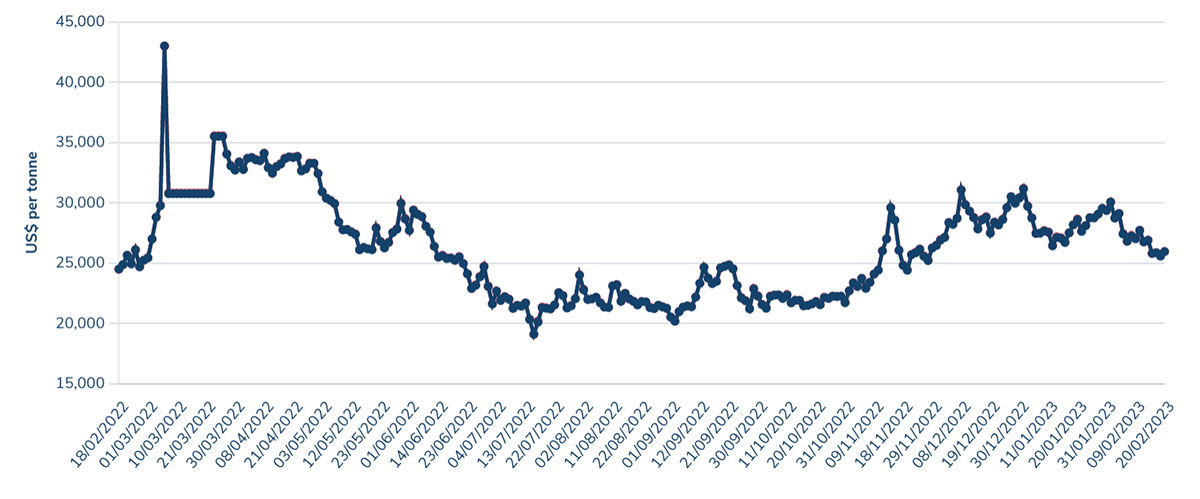
“Nickel has been in a significant uptrend in the past couple of years, excluding the volatility induced by the historic short squeeze on the London Metal Exchange’s nickel market in March 2022,” they say.
“Currently, nickel’s demand primarily comes from stainless steel.
“However, batteries are the most significant demand growth driver, given that nickel is a critical mineral for NMC cathodes. NMC refers to Lithium-Nickel-Manganese-Cobalt-Oxide (LiNiMnCoO2), the preferred cathode powder for electric batteries.
“In the long run, we believe it is likely that the Class 1 nickel market will be in a deficit due to the significant demand from batteries and the transition to higher nickel content chemistries.”
Battery raw materials merger and acquisition (M&A) was the key driver behind 25% of the top 20 mergers and acquisitions (M&A) deals in mining in 2022, according to data and analytics company GlobalData.
As a share of the whole that’s not an outsized amount: mining saw 1,402 M&A deals worth $75 billion in 2022, a drop of 34% from 2021 in terms of deal value.
Gold accounted for the largest share, recording 444 deals worth $39 billion.
But this could just be the start for companies exposed or wanting exposure to energy transition metals like lithium, nickel, cobalt, graphite, copper, manganese and rare earths.
Which #lithium company is most likely to be taken out in 2023 or 2024? Rio Tinto, MinRes, Pilbara Minerals & Westfarmers are said to be looking to acquire assets. Watch out for part II where I ask the same question with 4 more choices. Please retweet! Thanks!
— Peter Epstein, MBA (@peterepstein2) February 20, 2023
GlobalData’s William Tyson says mining companies are shifting their portfolios to focus more on these future-facing metals.
“The shortages of these metals and the growth in demand for EVs have prompted M&A deal activity as mining companies consolidate to fill the gap in supply,” he says.
“GlobalData predicts that global EV production will exceed 30 million vehicles by 2031, and mining companies will have to upscale to provide the essential metals required to produce EV batteries and meet demand.”
It’s not just mining companies looking to grow through battery metals M&A.
Battery makers, and even car manufacturers, are increasingly heading upstream to control raw materials supply at the source.
Tesla is allegedly mulling the takeover of Brazil based near term miner Sigma Lithium Corp, as the global scramble to secure critical minerals heats up.
According to Bloomberg, Tesla has been speaking with potential advisers about a bid and Sigma Lithium is one of the multiple options the EV maker is exploring as it considers its own refining.
The news comes hot on the heels of LG Chem’s $75m investment into Piedmont Lithium’s (ASX:PLL) jointly-owned North American Lithium (NAL) project and GM’s $650 million investment in Lithium Americas to support its Thacker Pass development.
Here’s how a basket of ASX stocks with exposure to lithium, cobalt, graphite, nickel, rare earths, magnesium, manganese, and vanadium is performing>>>
Battery metals stocks missing from our list? Shoot a mail to [email protected].
| CODE | COMPANY | 1 WEEK RETURN % | 1 MONTH RETURN % | 6 MONTH RETURN % | 1 YEAR RETURN % | PRICE | MARKET CAP |
|---|---|---|---|---|---|---|---|
| OM1 | Omnia Metals Group | 26% | 60% | 60% | 0% | 0.24 | $7,411,328 |
| RR1 | Reach Resources Ltd | 20% | 50% | 50% | -25% | 0.006 | $14,265,304 |
| PEK | Peak Rare Earths Ltd | 19% | 54% | 25% | -14% | 0.655 | $124,987,458 |
| RVT | Richmond Vanadium | 17% | 60% | 0% | 0% | 0.385 | $31,896,888 |
| RBX | Resource B | 15% | 83% | 15% | -25% | 0.15 | $8,560,475 |
| WMG | Western Mines | 15% | 19% | 31% | 6% | 0.19 | $7,796,175 |
| ASO | Aston Minerals Ltd | 14% | 22% | 9% | -32% | 0.1025 | $97,990,722 |
| CLA | Celsius Resource Ltd | 13% | -15% | 17% | -37% | 0.017 | $31,572,469 |
| PUR | Pursuit Minerals | 13% | 29% | 69% | 23% | 0.027 | $30,848,846 |
| AX8 | Accelerate Resources | 12% | 4% | -22% | -41% | 0.029 | $10,572,849 |
| CAI | Calidus Resources | 11% | -40% | -61% | -65% | 0.25 | $105,492,202 |
| MQR | Marquee Resource Ltd | 10% | -16% | -61% | -73% | 0.032 | $10,470,640 |
| ARR | American Rare Earths | 10% | 34% | -8% | -29% | 0.275 | $109,363,296 |
| CMO | Cosmometalslimited | 10% | 10% | 10% | -18% | 0.165 | $4,209,150 |
| IDA | Indiana Resources | 10% | -5% | -8% | -8% | 0.057 | $29,058,280 |
| ARU | Arafura Rare Earths | 10% | 25% | 125% | 231% | 0.6625 | $1,277,283,154 |
| STK | Strickland Metals | 9% | -8% | -32% | -38% | 0.036 | $49,757,720 |
| CNJ | Conico Ltd | 9% | 33% | -78% | 1% | 0.012 | $17,459,617 |
| WCN | White Cliff Min Ltd | 9% | 0% | 0% | -60% | 0.012 | $9,408,653 |
| AOA | Ausmon Resorces | 9% | 0% | -14% | -14% | 0.006 | $5,293,736 |
| TLG | Talga Group Ltd | 9% | 11% | 40% | 36% | 1.87 | $625,192,836 |
| FTL | Firetail Resources | 8% | -3% | -45% | 0% | 0.14 | $9,100,000 |
| VMC | Venus Metals Cor Ltd | 7% | -3% | -15% | -26% | 0.145 | $27,602,196 |
| MMC | Mitremining | 7% | 4% | 157% | 48% | 0.295 | $10,615,605 |
| FRS | Forrestaniaresources | 7% | -14% | 3% | -58% | 0.15 | $9,133,695 |
| LIN | Lindian Resources | 7% | -8% | -15% | 562% | 0.225 | $210,218,791 |
| BSX | Blackstone Ltd | 7% | -6% | -30% | -68% | 0.155 | $66,273,920 |
| VML | Vital Metals Limited | 7% | -2% | -42% | -50% | 0.0245 | $127,347,594 |
| TVN | Tivan Limited | 6% | -3% | -31% | 30% | 0.083 | $115,238,712 |
| STM | Sunstone Metals Ltd | 6% | -14% | -20% | -57% | 0.036 | $91,715,625 |
| JMS | Jupiter Mines. | 5% | 1% | 18% | 15% | 0.2425 | $470,157,848 |
| TMB | Tambourahmetals | 5% | -19% | -29% | -54% | 0.11 | $4,531,186 |
| E25 | Element 25 Ltd | 5% | -23% | 14% | -34% | 0.795 | $148,559,087 |
| DVP | Develop Global Ltd | 4% | 2% | 48% | 10% | 3.475 | $583,857,992 |
| LRS | Latin Resources Ltd | 4% | 4% | 9% | 229% | 0.125 | $286,215,139 |
| BCA | Black Canyon Limited | 4% | -6% | 2% | 6% | 0.255 | $10,762,194 |
| GLN | Galan Lithium Ltd | 4% | 1% | -8% | -17% | 1.165 | $343,745,254 |
| PBL | Parabellumresources | 4% | -18% | 49% | 114% | 0.395 | $21,615,388 |
| MAN | Mandrake Res Ltd | 4% | 23% | -4% | 7% | 0.053 | $29,282,496 |
| EMN | Euromanganese | 4% | -23% | -29% | -44% | 0.275 | $69,587,259 |
| SRI | Sipa Resources Ltd | 4% | -9% | -36% | -47% | 0.029 | $6,388,428 |
| WC8 | Wildcat Resources | 3% | -5% | 3% | 0% | 0.03 | $19,860,682 |
| INR | Ioneer Ltd | 3% | -13% | -43% | -34% | 0.3975 | $797,368,541 |
| BUX | Buxton Resources Ltd | 3% | 42% | 75% | 70% | 0.17 | $26,450,907 |
| WIN | Widgienickellimited | 3% | -3% | 10% | -9% | 0.34 | $86,599,426 |
| WR1 | Winsome Resources | 3% | -4% | 708% | 435% | 2.06 | $305,864,882 |
| TKM | Trek Metals Ltd | 3% | -7% | -3% | -24% | 0.069 | $25,112,211 |
| BRB | Breaker Res NL | 3% | -19% | 33% | 10% | 0.285 | $93,097,036 |
| CNB | Carnaby Resource Ltd | 3% | 18% | 28% | -18% | 1.2 | $170,189,246 |
| ZNC | Zenith Minerals Ltd | 2% | -8% | -23% | -37% | 0.23 | $79,133,860 |
| EVG | Evion Group NL | 2% | 0% | -35% | -44% | 0.062 | $17,881,358 |
| TMT | Technology Metals | 2% | -10% | -5% | -3% | 0.315 | $66,094,735 |
| NTU | Northern Min Ltd | 1% | 1% | 4% | -15% | 0.0425 | $218,338,774 |
| BHP | BHP Group Limited | 1% | -3% | 16% | 13% | 48.345 | $245,489,664,144 |
| A11 | Atlantic Lithium | 1% | -7% | 0% | 0% | 0.66 | $384,645,954 |
| LYC | Lynas Rare Earths | 1% | -3% | -13% | -6% | 8.42 | $7,539,256,507 |
| PLL | Piedmont Lithium Inc | 1% | 10% | 4% | 32% | 0.94 | $391,700,500 |
| NIC | Nickel Industries | 0% | -2% | -2% | -22% | 1.0675 | $3,050,184,681 |
| S32 | South32 Limited | 0% | 0% | 10% | 0% | 4.59 | $20,482,930,276 |
| OZL | OZ Minerals | 0% | 0% | 7% | 7% | 27.96 | $9,387,736,729 |
| VIA | Viagold Rare Earth | 0% | 0% | 0% | 0% | 2 | $166,624,808 |
| LPD | Lepidico Ltd | 0% | 0% | -45% | -53% | 0.016 | $114,566,576 |
| CZN | Corazon Ltd | 0% | -16% | -9% | -33% | 0.021 | $12,206,611 |
| AVZ | AVZ Minerals Ltd | 0% | 0% | 0% | -3% | 0.78 | $2,752,409,203 |
| HXG | Hexagon Energy | 0% | 13% | 0% | -67% | 0.018 | $8,719,570 |
| VRC | Volt Resources Ltd | 0% | -14% | -40% | -43% | 0.012 | $38,794,239 |
| ADV | Ardiden Ltd | 0% | -7% | -13% | -46% | 0.007 | $18,818,347 |
| IXR | Ionic Rare Earths | 0% | -5% | -31% | -39% | 0.036 | $137,991,172 |
| SYR | Syrah Resources | 0% | -16% | 24% | 33% | 1.89 | $1,247,401,985 |
| AVL | Aust Vanadium Ltd | 0% | 7% | -33% | -6% | 0.032 | $130,908,757 |
| FFX | Firefinch Ltd | 0% | 0% | 0% | -15% | 0.2 | $236,569,315 |
| ATM | Aneka Tambang | 0% | 5% | -4% | 0% | 1.1 | $1,434,014 |
| AQD | Ausquest Limited | 0% | 7% | -20% | -11% | 0.016 | $13,202,388 |
| G88 | Golden Mile Res Ltd | 0% | -13% | -38% | -63% | 0.021 | $4,296,385 |
| WKT | Walkabout Resources | 0% | 5% | -36% | -49% | 0.11 | $67,289,010 |
| BOA | Boadicea Resources | 0% | -9% | -33% | -56% | 0.1 | $7,769,990 |
| LSR | Lodestar Minerals | 0% | -10% | -36% | -50% | 0.0045 | $6,953,749 |
| RAG | Ragnar Metals Ltd | 0% | 23% | -65% | -57% | 0.016 | $6,066,958 |
| TEM | Tempest Minerals | 0% | -11% | -41% | -4% | 0.024 | $12,114,393 |
| EMC | Everest Metals Corp | 0% | -14% | -14% | -36% | 0.09 | $9,578,980 |
| GRE | Greentechmetals | 0% | 20% | -52% | -43% | 0.15 | $4,843,500 |
| FRB | Firebird Metals | 0% | -14% | -33% | -56% | 0.16 | $11,358,049 |
| ENV | Enova Mining Limited | 0% | -8% | -33% | -40% | 0.012 | $4,691,152 |
| EMT | Emetals Limited | 0% | 0% | 10% | -35% | 0.011 | $9,350,000 |
| PNT | Panthermetalsltd | 0% | 9% | -16% | -14% | 0.19 | $5,842,500 |
| AVW | Avira Resources Ltd | 0% | 0% | -25% | -50% | 0.003 | $6,401,370 |
| RAS | Ragusa Minerals Ltd | 0% | -4% | -42% | 59% | 0.11 | $17,111,854 |
| THR | Thor Energy PLC | 0% | 0% | -40% | -61% | 0.006 | $8,853,677 |
| VMS | Venture Minerals | 0% | -14% | -11% | -41% | 0.024 | $42,400,982 |
| TAR | Taruga Minerals | 0% | -14% | -44% | -45% | 0.018 | $11,296,429 |
| MEK | Meeka Metals Limited | 0% | -19% | -37% | -8% | 0.048 | $51,245,229 |
| VHM | Vhmlimited | -1% | -8% | 0% | 0% | 0.97 | $140,769,241 |
| AGY | Argosy Minerals Ltd | -1% | 12% | 95% | 118% | 0.74 | $954,997,099 |
| ESS | Essential Metals Ltd | -1% | -4% | 10% | 23% | 0.5 | $133,783,347 |
| FG1 | Flynngold | -1% | -10% | -6% | -41% | 0.09 | $8,949,998 |
| MTM | Mtmongerresources | -1% | -6% | -61% | -57% | 0.075 | $4,219,792 |
| PTR | Petratherm Ltd | -1% | -5% | -1% | 53% | 0.069 | $14,159,322 |
| MLX | Metals X Limited | -1% | -17% | 24% | -43% | 0.34 | $299,397,802 |
| LPM | Lithium Plus | -1% | -7% | -46% | 0% | 0.34 | $17,220,388 |
| WA1 | Wa1Resourcesltd | -1% | -9% | 600% | 491% | 1.33 | $46,264,837 |
| BUR | Burleyminerals | -2% | 41% | 195% | 117% | 0.325 | $19,345,522 |
| AZS | Azure Minerals | -2% | -7% | 39% | -26% | 0.32 | $100,225,928 |
| CHN | Chalice Mining Ltd | -2% | -8% | 42% | -16% | 6.23 | $2,288,798,940 |
| PRL | Province Resources | -2% | -13% | -63% | -58% | 0.054 | $63,800,630 |
| IG6 | Internationalgraphit | -2% | 5% | -28% | 0% | 0.26 | $22,876,908 |
| ETM | Energy Transition | -2% | -6% | -30% | -31% | 0.048 | $63,719,969 |
| ILU | Iluka Resources | -2% | 0% | 8% | -5% | 10.62 | $4,546,774,016 |
| NMT | Neometals Ltd | -2% | -5% | -41% | -38% | 0.82 | $436,665,529 |
| POS | Poseidon Nick Ltd | -3% | -16% | -41% | -60% | 0.037 | $125,949,143 |
| LMG | Latrobe Magnesium | -3% | -4% | -21% | -30% | 0.074 | $118,499,832 |
| NC1 | Nicoresourceslimited | -3% | -15% | -40% | -3% | 0.555 | $48,798,376 |
| M24 | Mamba Exploration | -3% | -16% | 85% | -3% | 0.185 | $10,977,001 |
| PAM | Pan Asia Metals | -3% | -11% | -26% | -38% | 0.35 | $54,336,568 |
| MNS | Magnis Energy Tech | -3% | 2% | -1% | -9% | 0.4275 | $392,984,251 |
| KZR | Kalamazoo Resources | -3% | -25% | -30% | -52% | 0.165 | $24,927,245 |
| NWM | Norwest Minerals | -3% | 16% | 43% | 25% | 0.066 | $14,659,088 |
| FGR | First Graphene Ltd | -3% | -8% | -31% | -46% | 0.097 | $56,969,006 |
| LML | Lincoln Minerals | -3% | 78% | 367% | 367% | 0.032 | $17,824,494 |
| PAN | Panoramic Resources | -3% | -21% | -35% | -39% | 0.155 | $307,637,101 |
| LRV | Larvottoresources | -3% | -16% | -43% | -43% | 0.155 | $10,424,482 |
| IPX | Iperionx Limited | -3% | 7% | -9% | -6% | 0.9 | $159,343,381 |
| S2R | S2 Resources | -3% | -15% | 0% | -28% | 0.145 | $51,746,854 |
| NVX | Novonix Limited | -4% | -14% | -41% | -73% | 1.5 | $722,860,314 |
| EV1 | Evolutionenergy | -4% | 17% | -8% | -41% | 0.27 | $40,668,750 |
| GAL | Galileo Mining Ltd | -4% | -13% | -25% | 310% | 0.8 | $160,076,191 |
| GSR | Greenstone Resources | -4% | -11% | -65% | -38% | 0.025 | $30,191,974 |
| SCN | Scorpion Minerals | -4% | -3% | -8% | 0% | 0.072 | $24,890,846 |
| LTR | Liontown Resources | -4% | -2% | -20% | -14% | 1.3425 | $2,836,006,477 |
| CDT | Castle Minerals | -4% | 0% | -28% | -57% | 0.023 | $22,988,339 |
| LOT | Lotus Resources Ltd | -4% | -2% | 7% | -12% | 0.22 | $292,122,371 |
| EGR | Ecograf Limited | -4% | 5% | -48% | -63% | 0.22 | $96,821,694 |
| KOR | Korab Resources | -4% | -12% | -37% | -54% | 0.022 | $8,442,150 |
| KTA | Krakatoa Resources | -5% | -5% | -35% | -2% | 0.042 | $13,443,687 |
| GED | Golden Deeps | -5% | 0% | -38% | -17% | 0.01 | $11,552,267 |
| DRE | Dreadnought Resources Ltd | -5% | -5% | -15% | 118% | 0.0895 | $296,435,540 |
| OMH | OM Holdings Limited | -5% | 6% | 25% | -15% | 0.79 | $579,819,320 |
| AOU | Auroch Minerals Ltd | -5% | 0% | -19% | -49% | 0.059 | $26,098,553 |
| NVA | Nova Minerals Ltd | -5% | -12% | -31% | -37% | 0.585 | $126,032,479 |
| IPT | Impact Minerals | -5% | -5% | 6% | -25% | 0.0095 | $22,332,335 |
| CMX | Chemxmaterials | -5% | -13% | -28% | -36% | 0.14 | $7,092,558 |
| REE | Rarex Limited | -5% | 6% | -19% | -48% | 0.055 | $31,286,875 |
| PNN | Power Minerals Ltd | -5% | -10% | -11% | -1% | 0.455 | $32,691,244 |
| A8G | Australasian Metals | -5% | -5% | -36% | -66% | 0.18 | $7,410,689 |
| AXN | Alliance Nickel Ltd | -5% | -14% | -22% | 36% | 0.09 | $57,825,565 |
| EUR | European Lithium Ltd | -5% | -14% | -22% | -36% | 0.07 | $98,548,264 |
| DEV | Devex Resources Ltd | -5% | -7% | -30% | -37% | 0.26 | $96,402,430 |
| CRR | Critical Resources | -5% | 21% | 0% | -44% | 0.052 | $79,516,631 |
| EFE | Eastern Resources | -6% | 0% | -45% | -70% | 0.017 | $21,113,090 |
| VUL | Vulcan Energy | -6% | -8% | -22% | -31% | 6.27 | $880,692,748 |
| CTM | Centaurus Metals Ltd | -6% | -12% | -4% | -12% | 1.07 | $450,597,118 |
| AXE | Archer Materials | -6% | -7% | -35% | -45% | 0.575 | $150,625,160 |
| ALY | Alchemy Resource Ltd | -6% | 0% | -16% | 23% | 0.016 | $18,260,182 |
| MRR | Minrex Resources Ltd | -6% | -14% | -43% | -51% | 0.032 | $32,546,025 |
| AS2 | Askarimetalslimited | -6% | -16% | 47% | 45% | 0.56 | $27,948,024 |
| BKT | Black Rock Mining | -6% | -3% | -3% | -43% | 0.15 | $147,396,605 |
| CHR | Charger Metals | -6% | -6% | -33% | -49% | 0.37 | $15,737,172 |
| AM7 | Arcadia Minerals | -6% | -4% | 13% | -8% | 0.22 | $10,273,536 |
| BC8 | Black Cat Syndicate | -6% | -14% | -12% | -38% | 0.365 | $95,814,703 |
| AZL | Arizona Lithium Ltd | -7% | -4% | -28% | -54% | 0.0645 | $153,877,792 |
| LIT | Lithium Australia | -7% | -10% | -46% | -63% | 0.043 | $52,511,242 |
| MIN | Mineral Resources. | -7% | -5% | 39% | 78% | 84.86 | $15,623,972,937 |
| CXO | Core Lithium | -7% | -9% | -32% | 14% | 0.9575 | $1,706,615,450 |
| KOB | Kobaresourceslimited | -7% | -7% | 8% | 0% | 0.14 | $10,640,000 |
| GSM | Golden State Mining | -7% | -2% | -25% | -53% | 0.041 | $5,031,611 |
| 1AE | Auroraenergymetals | -7% | -13% | -45% | 0% | 0.135 | $17,185,585 |
| NKL | Nickelxltd | -7% | -16% | -48% | -57% | 0.067 | $5,344,367 |
| OCN | Oceanalithiumlimited | -7% | -24% | -50% | 0% | 0.325 | $11,834,550 |
| HRE | Heavy Rare Earths | -7% | 4% | 0% | 0% | 0.13 | $8,328,310 |
| ASN | Anson Resources Ltd | -7% | 6% | 31% | 52% | 0.19 | $224,074,587 |
| PVT | Pivotal Metals Ltd | -7% | -7% | 41% | -36% | 0.038 | $17,680,612 |
| IGO | IGO Limited | -7% | -9% | 9% | 10% | 13.44 | $10,026,225,844 |
| KGD | Kula Gold Limited | -7% | -7% | 0% | -45% | 0.025 | $9,030,298 |
| BM8 | Battery Age Minerals | -7% | 0% | 0% | 23% | 0.5 | $34,140,355 |
| LPI | Lithium Pwr Int Ltd | -8% | -21% | -37% | -39% | 0.37 | $226,475,122 |
| MRC | Mineral Commodities | -8% | -13% | -32% | -51% | 0.061 | $42,870,268 |
| RGL | Riversgold | -8% | -14% | -33% | 18% | 0.024 | $21,745,757 |
| ODE | Odessa Minerals Ltd | -8% | -14% | -25% | -14% | 0.012 | $8,483,461 |
| GW1 | Greenwing Resources | -8% | -22% | -11% | -31% | 0.235 | $35,582,128 |
| GCM | Green Critical Min | -8% | -13% | 32% | 23% | 0.0175 | $17,263,376 |
| GRL | Godolphin Resources | -8% | -28% | -15% | -42% | 0.0755 | $10,298,142 |
| PMT | Patriotbatterymetals | -8% | 25% | 0% | 0% | 1.56 | $226,757,674 |
| INF | Infinity Lithium | -8% | -8% | -21% | -30% | 0.115 | $48,572,170 |
| BYH | Bryah Resources Ltd | -8% | -8% | -18% | -56% | 0.023 | $6,468,830 |
| AKE | Allkem Limited | -8% | -9% | -6% | 23% | 11.6 | $7,326,691,408 |
| RMX | Red Mount Min Ltd | -8% | 10% | -21% | -39% | 0.0055 | $12,495,181 |
| BNR | Bulletin Res Ltd | -8% | 5% | -24% | -31% | 0.11 | $30,827,066 |
| XTC | Xantippe Res Ltd | -8% | -8% | -45% | -50% | 0.0055 | $63,480,598 |
| DM1 | Desert Metals | -8% | -8% | -21% | -70% | 0.165 | $11,952,778 |
| VR8 | Vanadium Resources | -8% | 9% | 4% | -5% | 0.076 | $36,330,928 |
| M2R | Miramar | -9% | -9% | -45% | -63% | 0.072 | $5,159,767 |
| ARL | Ardea Resources Ltd | -9% | -23% | -36% | -23% | 0.615 | $108,904,260 |
| RNU | Renascor Res Ltd | -9% | -13% | 8% | -19% | 0.2275 | $545,972,612 |
| QEM | QEM Limited | -9% | 5% | -17% | 14% | 0.2 | $27,028,714 |
| CWX | Carawine Resources | -9% | -20% | -5% | -39% | 0.1 | $19,681,747 |
| VTM | Victory Metals Ltd | -9% | -5% | -30% | 8% | 0.2 | $10,733,739 |
| SBR | Sabre Resources | -9% | -30% | -43% | -31% | 0.0345 | $9,910,530 |
| LKE | Lake Resources | -9% | -20% | -47% | -32% | 0.64 | $873,265,992 |
| AUZ | Australian Mines Ltd | -9% | -18% | -44% | -73% | 0.049 | $27,414,805 |
| LEG | Legend Mining | -9% | 17% | 4% | -32% | 0.049 | $137,756,786 |
| MLS | Metals Australia | -9% | 2% | -14% | 9% | 0.049 | $28,530,701 |
| OD6 | Od6Metalsltd | -9% | 5% | 57% | 0% | 0.29 | $15,954,494 |
| LEL | Lithenergy | -9% | 8% | -21% | -18% | 0.815 | $48,420,750 |
| SUM | Summitminerals | -10% | -3% | -22% | 0% | 0.14 | $3,709,133 |
| WC1 | Westcobarmetals | -10% | -22% | 22% | -7% | 0.14 | $12,093,723 |
| PLS | Pilbara Min Ltd | -10% | -4% | 44% | 47% | 4.38 | $12,591,471,858 |
| HAS | Hastings Tech Met | -10% | -22% | -35% | -50% | 2.93 | $387,535,542 |
| MRD | Mount Ridley Mines | -10% | -10% | -10% | -44% | 0.0045 | $38,924,414 |
| PGM | Platina Resources | -10% | -5% | -55% | -68% | 0.018 | $11,217,246 |
| QPM | Queensland Pacific | -10% | -14% | -37% | -46% | 0.0945 | $162,410,357 |
| AKN | Auking Mining Ltd | -10% | -16% | -33% | -57% | 0.081 | $14,451,583 |
| EMS | Eastern Metals | -10% | -16% | -51% | -68% | 0.071 | $2,773,573 |
| SYA | Sayona Mining Ltd | -10% | -14% | -19% | 69% | 0.22 | $1,781,372,996 |
| EMH | European Metals Hldg | -10% | -7% | -24% | -51% | 0.615 | $79,378,369 |
| JRV | Jervois Global Ltd | -10% | -34% | -57% | -70% | 0.1975 | $415,852,193 |
| AML | Aeon Metals Ltd. | -10% | -10% | -21% | -46% | 0.026 | $27,410,016 |
| JRL | Jindalee Resources | -10% | 18% | -15% | -18% | 2.31 | $145,168,784 |
| RDT | Red Dirt Metals Ltd | -11% | -13% | -17% | -21% | 0.425 | $189,085,683 |
| ITM | Itech Minerals Ltd | -11% | -2% | -26% | -47% | 0.285 | $36,834,072 |
| AAJ | Aruma Resources Ltd | -11% | -30% | -10% | -38% | 0.065 | $10,673,382 |
| SGQ | St George Min Ltd | -11% | -6% | 161% | 49% | 0.073 | $66,990,844 |
| PAT | Patriot Lithium | -11% | 24% | 0% | 0% | 0.365 | $22,132,688 |
| QXR | Qx Resources Limited | -11% | -22% | 33% | 3% | 0.04 | $35,874,493 |
| RLC | Reedy Lagoon Corp. | -11% | -27% | -53% | -73% | 0.008 | $4,533,757 |
| ENT | Enterprise Metals | -11% | -20% | -20% | -47% | 0.008 | $5,640,646 |
| GBR | Greatbould Resources | -11% | -11% | -29% | -53% | 0.078 | $34,477,197 |
| KFM | Kingfisher Mining | -11% | -39% | 11% | 35% | 0.31 | $17,188,800 |
| 1MC | Morella Corporation | -12% | -23% | -57% | -45% | 0.0115 | $73,182,965 |
| IMI | Infinitymining | -12% | -29% | 16% | 3% | 0.185 | $14,530,881 |
| AZI | Altamin Limited | -12% | -13% | -20% | -1% | 0.066 | $27,420,173 |
| MCR | Mincor Resources NL | -12% | -23% | -33% | -24% | 1.3925 | $736,092,356 |
| NWC | New World Resources | -13% | 7% | 44% | -20% | 0.049 | $92,641,650 |
| ESR | Estrella Res Ltd | -13% | -22% | -18% | -53% | 0.014 | $20,770,006 |
| TKL | Traka Resources | -13% | 0% | 0% | -42% | 0.007 | $5,059,422 |
| KNI | Kunikolimited | -13% | -22% | -49% | -52% | 0.45 | $22,502,279 |
| ADD | Adavale Resource Ltd | -13% | -9% | -26% | -46% | 0.02 | $10,390,522 |
| DTM | Dart Mining NL | -13% | -27% | -47% | -59% | 0.04 | $7,002,925 |
| KAI | Kairos Minerals Ltd | -13% | -17% | -31% | -20% | 0.02 | $41,245,963 |
| LNR | Lanthanein Resources | -13% | -9% | -50% | -38% | 0.02 | $22,431,511 |
| WML | Woomera Mining Ltd | -13% | -32% | -12% | -27% | 0.013 | $13,386,257 |
| GT1 | Greentechnology | -14% | -21% | -1% | -15% | 0.69 | $129,702,107 |
| PSC | Prospect Res Ltd | -14% | 61% | 85% | 337% | 0.185 | $85,518,000 |
| RXL | Rox Resources | -14% | -23% | -42% | -65% | 0.15 | $34,774,910 |
| CZL | Cons Zinc Ltd | -14% | 13% | -18% | -31% | 0.018 | $8,682,441 |
| BMM | Balkanminingandmin | -15% | 18% | 100% | 15% | 0.38 | $17,013,365 |
| SLZ | Sultan Resources Ltd | -15% | -36% | -61% | -66% | 0.052 | $4,414,073 |
| MOH | Moho Resources | -15% | -19% | -35% | -70% | 0.017 | $3,945,582 |
| COB | Cobalt Blue Ltd | -15% | -21% | -43% | -8% | 0.465 | $170,226,464 |
| PGD | Peregrine Gold | -16% | -9% | -48% | -26% | 0.43 | $16,280,413 |
| ASM | Ausstratmaterials | -16% | 38% | -49% | -76% | 1.935 | $310,905,248 |
| SRZ | Stellar Resources | -17% | -23% | -41% | -67% | 0.01 | $11,050,940 |
| CAE | Cannindah Resources | -17% | -22% | -28% | -49% | 0.19 | $109,645,991 |
| LLI | Loyal Lithium Ltd | -17% | -14% | -20% | 37% | 0.3425 | $18,633,950 |
| ARN | Aldoro Resources | -18% | -21% | -31% | -53% | 0.185 | $22,582,463 |
| HNR | Hannans Ltd | -19% | -28% | -38% | -64% | 0.013 | $35,419,863 |
| TON | Triton Min Ltd | -20% | -14% | 14% | 0% | 0.032 | $48,397,446 |
| CTN | Catalina Resources | -20% | -11% | -11% | -58% | 0.008 | $9,907,895 |
| GL1 | Globallith | -21% | -22% | -14% | 10% | 1.645 | $355,999,338 |
| EVR | Ev Resources Ltd | -23% | 11% | -52% | -72% | 0.0155 | $14,975,745 |
| L1M | Lightning Minerals | -23% | -11% | 0% | 0% | 0.17 | $6,336,112 |
| PVW | PVW Res Ltd | -25% | -5% | -61% | -85% | 0.105 | $10,830,996 |
| CLZ | Classic Min Ltd | -25% | -55% | -78% | -97% | 0.0045 | $4,605,308 |
| ABX | ABX Group Limited | -25% | 4% | -8% | -8% | 0.12 | $29,066,806 |
| AR3 | Austrare | -26% | -27% | -48% | -72% | 0.225 | $21,420,349 |
| CY5 | Cygnus Metals Ltd | -28% | -14% | 47% | 76% | 0.33 | $62,517,232 |
| KFM | Kingfisher Mining | -32% | -25% | 53% | 33% | 0.345 | $18,782,750 |
Experts
Experts
Mining


Get the latest Stockhead news delivered free to your inbox.


