
Pic: Bloomberg Creative / Bloomberg Creative Photos via Getty Images
Here’s why investors are starting to put uranium in the battery metal basket
Mining
Pic: Bloomberg Creative / Bloomberg Creative Photos via Getty Images
Mining
It’s clear that electric cars will have a huge impact on battery metals — but not many investors realise the impact they will have on demand for uranium.
Electric vehicles (or “EVs”) will be charged from mains power around the clock, dramatically increasing power demand from the electricity grid in coming years.
Nuclear power is expected to play a crucial role fulfilling that demand as the world goes searching for reliable, low-carbon electricity.
One British energy analyst put it like this: “In the next decades, we are going to need previously unthinkable levels of new low-carbon electricity capacity for charging electric vehicles and to replace coal and gas.
“There is no other low-carbon energy which can match nuclear power for scale and reliability.”
Renewable energy sources such as solar and wind will not be reliable enough on their own, Breakaway Research analyst Mike Harrowell told the RIU Sydney Resources Round Up earlier this year.
“When it is dark in the German winter and the wind turbines are frozen solid – where is the power going to come from? At the end of the day there needs to be a fuel source that is not weather-dependent.”
>> Scroll down for a list of ASX stocks with exposure to uranium, courtesy of leading ASX data provider MakCorp
The International Energy Agency (IEA) expects at least 125 million electric vehicles on the road by 2030 – up from 1 million in 2017.
But that number could be as high as 220 million if policy ambitions for EVs continue to rise to meet climate goals.
That would require a minimum of 404 terrawatt-hours (TWh) and a maximum of 928 TWh of additional electricity over the same period — a seven- to 17-fold increase when compared to the electricity consumed by EVs last year.
China — the biggest EV market — will continue as the largest power consumer, even if its share in global electricity consumption from EVs declines from 91 per cent in 2017 to 47 per cent in 2030, as the energy agency expects.
The need to power EVs from a de-carbonised grid provides opportunities for nuclear, Brandon Munro, the chief of ASX-listed uranium explorer Bannerman Resources (ASX:BMN), said at the recent World Nuclear Association Symposium in London.
“By 2030, under the IEA’s EV30@30 scenario [EVs making up 30 per cent of new car sales by 2030], 25 additional 1000 MWe reactors would be needed just to support the needs of EVs,” Brandon Munro said.
This means more uranium will be needed to power those additional reactors.
Reactors typically burn around 27 tonnes of uranium fuel for each gigawatt of electricity produced, according to Cannacord.
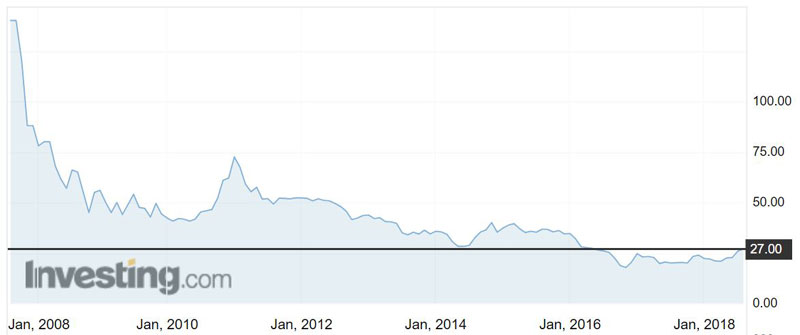
Uranium has been in the doldrums for a long time, but things are looking up, with the spot price recently reaching a two-year-high of $US26.70 ($37.07) per pound (see chart below) – a 24 per cent gain since the start of the year.
Cameco, the world’s largest uranium producer, recently announced its decision to indefinitely suspend uranium production at its McArthur River mine, in Saskatchewan, Canada.
The McArthur River uranium mine produced around 11 per cent of the world’s uranium supply and the shutdown is expected to hasten the rebound in uranium prices.
Over the past 12 months, over 20 of the 60-plus ASX uranium stocks have made gains.
Deep Yellow (ASX:DYL) is up 94 per cent over the past year at 46.5c.
The junior explorer is on the hunt for uranium in Namibia and is in the process of expanding its existing resource base.
Deep Yellow says a uranium supply shortfall is set to emerge from 2023, which has clear implications for the price to overshoot the forecast $US65 to $US70-per-pound price levels required to incentivise new production.
Meanwhile, Boss Resources (ASX:BOE) has an edge on the competition courtesy of its ownership of the Honeymoon project in South Australia, Stockhead columnist Barry Fitzgerald reported in June.
While much of its competition has to wait for a full-blown recovery in the uranium market before even thinking about getting in to production, Boss could have Honeymoon back in production within nine months for a restart cost of about $US10 million, leveraging off $170 million in existing infrastructure.
The advanced status of the project — and the turning sentiment in the uranium market — has already prompted verbal inquiries to Boss about offtake agreements.
Boss’ share price has rallied 66 per cent to about 7.3c in the past year.
Energy Metals (ASX:EME), one of the few pure-play uranium explorers, has also witnessed decent share price gains.
Shares have climbed 66 per cent over the past 12 months to trade at around 14c.
Energy Metals’ Bigrlyi project in the Northern Territory is currently on care and maintenance, but the company is planning to undertake further studies on the project in the next financial year.
It has all the necessary permits and authorities to export uranium oxide concentrates from Australia.
The company has completed its first shipment and is negotiating with Australian uranium producers to enable further shipments from Australia for resale, primarily to major Chinese
utility China General Nuclear Power Group.
Bannerman, which is developing its Etango uranium project in Namibia, has seen its share price appreciate 59.5 per cent over the past year to 5.9c
Other players like Vimy Resources (ASX:VMY), meanwhile, have not fared as well, with its share price sliding 22 per cent over 12 months to trade at 9.7c.
Toro Energy (ASX:TOE) has also lost ground. Its share price dipped 13 per cent over the past year to 2.7c.
Here’s a list of ASX stocks with exposure to uranium courtesy of leading ASX data provider MakCorp
Swipe or scroll to reveal full table. Click headings to sort
| ASX code | Company | 6-month price change | 12-month price change | Price Sep 14 (intraday) | Market Cap |
|---|---|---|---|---|---|
| DYL | DEEP YELLOW | 0.722222222222 | 0.9375 | 0.465 | 89.6M |
| BOE | BOSS RESOURCES L | 0.553191489362 | 0.659090909091 | 0.073 | 115.7M |
| CZL | CONSOLIDATED ZIN | 0.5 | -0.25 | 0.015 | 12.9M |
| BMN | BANNERMAN RESOUR | 0.439024390244 | 0.594594594595 | 0.059 | 59.8M |
| SMM | SUMMIT RESOURCES | 0.233333333333 | 0.0882352941176 | 0.185 | 43.6M |
| EME | ENERGY METALS LT | 0.166666666667 | 0.609195402299 | 0.14 | 29.4M |
| MYL | MYANMAR METALS L | 0.120689655172 | 0.160714285714 | 0.065 | 84.8M |
| JRL | JINDALEE RESOURC | 0.115384615385 | 0.0943396226415 | 0.29 | 10.1M |
| BHP | BHP BILLITON | 0.109462290503 | 0.181666046858 | 31.775 | 159.0B |
| KSN | KINGSTON RESOURC | 0.1 | 0.222222222222 | 0.022 | 26.9M |
| MEU | MARMOTA | 0.0625 | 0.0625 | 0.017 | 11.1M |
| PEN | PENINSULA ENERGY | 0.0172413793103 | -0.169014084507 | 0.295 | 71.2M |
| ZEU | ZEUS RESOURCES L | 0 | -0.133333333333 | 0.013 | 2.3M |
| RDM | RED METAL | 0 | -0.446808510638 | 0.13 | 28.4M |
| MLS | METALS AUSTRALIA | 0 | 0 | 0.004 | 9.4M |
| MEY | MARENICA ENERGY | 0 | 0.136363636364 | 0.125 | 6.0M |
| RIO | RIO TINTO | -0.0197050938338 | 0.0694647557765 | 73.13 | 113.6B |
| TOE | TORO ENERGY | -0.0357142857143 | -0.129032258065 | 0.027 | 60.5M |
| GGG | GREENLAND MINERA | -0.046511627907 | -0.18 | 0.082 | 91.1M |
| ACB | A-CAP RESOURCES | -0.06 | -0.12962962963 | 0.047 | 41.0M |
| SO4 | SALT LAKE POTASH | -0.0857142857143 | 0.0434782608696 | 0.48 | 82.3M |
| AGS | ALLIANCE RESOURC | -0.0869565217391 | 0.220930232558 | 0.105 | 11.0M |
| RVY | RIFT VALLEY RESO | -0.0952380952381 | -0.269230769231 | 0.019 | 16.5M |
| AVL | AUSTRALIAN VANAD | -0.0980392156863 | 2.28571428571 | 0.046 | 73.0M |
| CHK | COHIBA MINERALS | -0.111111111111 | -0.384615384615 | 0.008 | 4.5M |
| IPT | IMPACT MINERALS | -0.133333333333 | -0.235294117647 | 0.013 | 17.2M |
| BKY | BERKELEY ENERGIA | -0.146198830409 | -0.104294478528 | 0.73 | 188.6M |
| SMC | STRATEGIC MIN | -0.15 | 0.133333333333 | 0.34 | 26.6M |
| CXU | CAULDRON ENERGY | -0.151515151515 | -0.391304347826 | 0.028 | 9.2M |
| HLX | HELIX RESOURCES | -0.166666666667 | 0.111111111111 | 0.03 | 11.4M |
| AFR | AFRICAN ENERGY | -0.178571428571 | -0.54 | 0.023 | 14.4M |
| SRZ | STELLAR RESOURCE | -0.210526315789 | -0.117647058824 | 0.015 | 5.7M |
| VML | VITAL METALS | -0.222222222222 | -0.222222222222 | 0.007 | 12.2M |
| CAZ | CAZALY RESOURCES | -0.239130434783 | 0.0294117647059 | 0.035 | 8.1M |
| AEE | AURA ENERGY | -0.241379310345 | -0.214285714286 | 0.022 | 22.5M |
| DEV | DEVEX RESOURCES | -0.25 | 0.2 | 0.006 | 6.6M |
| POW | PROTEAN ENERGY L | -0.263157894737 | 0.272727272727 | 0.028 | 8.2M |
| HAV | HAVILAH RESOURCE | -0.264150943396 | -0.380952380952 | 0.195 | 42.6M |
| CXO | CORE EXPLORATION | -0.283333333333 | -0.104166666667 | 0.043 | 27.3M |
| TAS | TASMAN RESOURCES | -0.287878787879 | -0.675862068966 | 0.047 | 22.9M |
| APC | AUSTRALIAN POTAS | -0.29347826087 | -0.322916666667 | 0.065 | 19.8M |
| IAU | INTREPID MINES L | -0.293617021277 | -0.308333333333 | 0.83 | 11.4M |
| AGE | ALLIGATOR ENERGY | -0.3 | -0.363636363636 | 0.007 | 6.6M |
| VMY | VIMY RESOURCES L | -0.307142857143 | -0.224 | 0.097 | 39.5M |
| SPQ | SUPERIOR RESOURC | -0.333333333333 | 0.333333333333 | 0.008 | 5.5M |
| ADD | ADAVALE RESOURCE | -0.333333333333 | -0.333333333333 | 0.01 | 804.4k |
| LAM | LARAMIDE RES-CDI | -0.333333333333 | 0 | 0.3 | 39.2M |
| SYR | SYRAH RESOURCES | -0.340057636888 | -0.370013755158 | 2.29 | 801.4M |
| TRT | TODD RIVER RESOU | -0.344 | -0.392592592593 | 0.082 | 6.3M |
| ERA | ENERGY RES AUST | -0.363636363636 | -0.324561403509 | 0.385 | 189.0M |
| CFE | CAPE LAMBERT RES | -0.368421052632 | -0.04 | 0.024 | 24.3M |
| AZI | ALTA ZINC | -0.375 | -0.6875 | 0.005 | 6.8M |
| AMD | ARROW MINERALS L | -0.375 | -0.459459459459 | 0.02 | 5.8M |
| VRM | VERDANT MINERALS | -0.379310344828 | -0.379310344828 | 0.018 | 19.9M |
| THX | THUNDELARRA | -0.391304347826 | -0.481481481481 | 0.014 | 8.9M |
| KLH | KALIA | -0.4 | -0.625 | 0.006 | 15.1M |
| IEC | INTRA ENERGY COR | -0.4 | -0.1 | 0.009 | 4.7M |
| RNU | RENASCOR RESOURC | -0.457142857143 | -0.05 | 0.019 | 18.3M |
| EPM | ECLIPSE METALS L | -0.5 | -0.5 | 0.003 | 3.4M |
| SPX | SPECTRUM RARE EA | -0.583333333333 | 0 | 0.005 | 4.2M |
| RMT | RMA ENERGY | -0.666666666667 | -0.666666666667 | 0.001 | 2.1M |
| MHC | MANHATTAN CORP | -0.676470588235 | -0.725 | 0.011 | 8.9M |
| MGT | MAGNETITE MINES | -0.724137931034 | -0.75 | 0.008 | 6.6M |
| RLC | REEDY LAGOON | -0.770833333333 | -0.153846153846 | 0.011 | 4.0M |
Stockhead is proud to use MakCorp as a provider of great value, accurate and reliable data on ASX-listed mining stocks. For more information head to MakCorp’s website.
![]()
This article does not constitute financial product advice. You should consider obtaining independent advice before making any financial decisions.

Mining

Mining

Mining


Get the latest Stockhead news delivered free to your inbox.