
Pic: Bloomberg Creative / Bloomberg Creative Photos via Getty Images
Why uranium looks set to continue upwards – and which stocks could benefit
Mining
Pic: Bloomberg Creative / Bloomberg Creative Photos via Getty Images
Mining
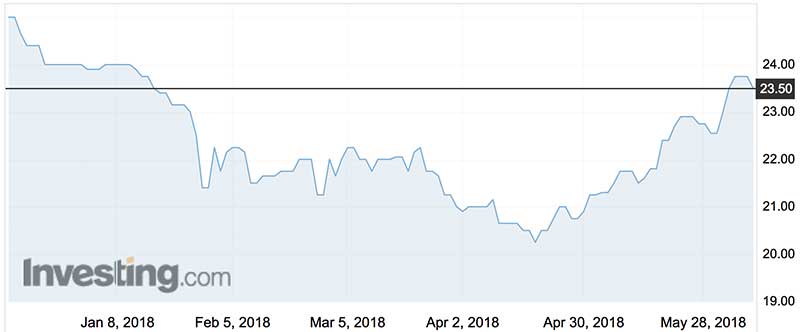
The price of uranium has been rising steadily for two months — and looks set to continue, according to analysts.
At the end of May uranium increased by $US1.75 to $US22.75 per pound. As of last week it was up a further 60c to $23.35.
Uranium is breaking out of a three-year downtrend, according to Tina Normann, quantitative analyst at Canadian equity researcher Eight Capital.
The spot price is up 10 per cent month over month and is currently on an upward trend that Eight Capital sees continuing for some time. The investment firm forecasts a price of $US29 per pound for 2018.
That could lead to renewed interest in uranium stocks and Eight Capital believes it’s a good time for investors to get into the sector.
>> Scroll down for a list of ASX stocks with exposure to uranium, courtesy of leading ASX data provider MakCorp
“Mine closures and production pullbacks continue to dominate headlines while US lawmakers are starting to take notice of external pressures on what is a ‘strategic’ industry,” Eight Capital says.
The US, which imports 93 per cent of its uranium, has placed a moratorium on nuclear plant closures, halted sales of excess uranium by the Department of Energy and may be reviewing its stance on ex-Soviet foreign imports.
Meanwhile, Kazakhstan’s state-owned uranium producer Kazatomprom could be cutting its production by more than the 20 per cent it previously flagged.
The country’s energy minister has reportedly revealed Kazatomprom may cut production by a further 6 per cent.
Another indicator that the market could be on the way up is the emergence of a new uranium trader that is set to be listed on London’s AIM exchange.
The company, known as “Yellow Cake”, has launched an initial public offer to raise up to $US200 million to buy 8.1 million pounds of uranium.
Over the past year about 30 of the nearly 70 ASX-listed stocks that have exposure to uranium have made gains.
Since January only 20 have increased in value — though that’s most likely due to other commodities they have in their portfolio.
Here’s a list of ASX stocks with exposure to uranium courtesy of leading ASX data provider MakCorp. (Scroll or swipe for full table)
| ASX code | Company | One-year price change | Price change since Jan 2 | Price Jun 8 (intraday) | Market Cap |
|---|---|---|---|---|---|
| AVL | AUSTRALIAN VANAD | 1.8 | 1.21052631579 | 0.042 | 64.1M |
| MYL | MYANMAR METALS | 1.48484848485 | 0.344262295082 | 0.082 | 53.8M |
| SPQ | SUPERIOR RESOURC | 1.16666666667 | 0.181818181818 | 0.013 | 8.9M |
| DEV | DEVEX RESOURCES | 0.75 | -0.3 | 0.007 | 5.5M |
| USA | URANIUMSA | 0.666666666667 | 0 | 0.01 | 3.6M |
| EME | ENERGY METALS | 0.6 | 0.777777777778 | 0.16 | 31.5M |
| RNU | RENASCOR RESOURC | 0.529411764706 | -0.235294117647 | 0.026 | 23.8M |
| BMN | BANNERMAN RESOUR | 0.529411764706 | -0.0714285714286 | 0.052 | 48.8M |
| MEU | MARMOTA | 0.5 | -0.181818181818 | 0.018 | 10.8M |
| POW | PROTEAN ENERGY | 0.48 | 0.48 | 0.037 | 10.6M |
| BHP | BHP BILLITON | 0.460746460746 | 0.147237196765 | 34.05 | 175.2B |
| CAZ | CAZALY RESOURCES | 0.404761904762 | 0.156862745098 | 0.059 | 14.1M |
| RIO | RIO TINTO | 0.392270531401 | 0.130196078431 | 86.46 | 139.1B |
| BOE | BOSS RESOURCES | 0.387755102041 | 0.283018867925 | 0.068 | 107.1M |
| KSN | KINGSTON RESOURC | 0.294117647059 | 0.047619047619 | 0.022 | 26.7M |
| SO4 | SALTAKE POTASH | 0.267441860465 | 0.0582524271845 | 0.545 | 94.5M |
| ZEU | ZEUS RESOURCES | 0.230769230769 | 0.0666666666667 | 0.016 | 2.9M |
| DYL | DEEP YELLOW | 0.222222222222 | 0.03125 | 0.33 | 62.3M |
| SYR | SYRAH RESOURCES | 0.219709208401 | -0.35881104034 | 3.02 | 916.1M |
| MLS | METALS AUSTRALIA | 0.2 | 0.2 | 0.006 | 11.7M |
| EPM | ECLIPSE METALS | 0.2 | -0.625 | 0.006 | 5.7M |
| SMC | STRATEGIC MIN | 0.142857142857 | 0 | 0.4 | 28.2M |
| SPX | SPECTRUM RARE EA | 0.142857142857 | -0.272727272727 | 0.008 | 5.4M |
| ACB | A-CAP RESOURCES | 0.12 | 0.12 | 0.056 | 54.4M |
| CXU | CAULDRON ENERGY | 0.114285714286 | -0.327586206897 | 0.039 | 12.5M |
| IAU | INTREPID MINES | 0.071568627451 | 0.0073732718894 | 1.093 | 15.1M |
| ERA | ENERGY RES AUST | 0.0515463917526 | -0.423728813559 | 0.51 | 274.4M |
| MEY | MARENICA ENERGY | 0.0384615384615 | 0.227272727273 | 0.135 | 7.7M |
| CFE | CAPEAMBERT RES | 0.0333333333333 | -0.550724637681 | 0.031 | 28.2M |
| BKY | BERKELEY ENERGIA | 0.0251572327044 | -0.22380952381 | 0.815 | 208.8M |
| AGS | ALLIANCE RESOURC | -0.0210526315789 | 0 | 0.093 | 9.6M |
| JRL | JINDALEE RESOURC | -0.0454545454545 | -0.176470588235 | 0.21 | 7.7M |
| ADD | ADAVALE RESOURCE | -0.0769230769231 | -0.333333333333 | 0.012 | 965K |
| HLX | HELIX RESOURCES | -0.0952380952381 | -0.191489361702 | 0.038 | 15.0M |
| VRM | VERDANT MINERALS | -0.125 | -0.432432432432 | 0.021 | 20.1M |
| IPT | IMPACT MINERALS | -0.133333333333 | -0.235294117647 | 0.013 | 17.2M |
| SMM | SUMMIT RESOURCES | -0.15 | -0.170731707317 | 0.17 | 37.1M |
| TOE | TORO ENERGY | -0.15625 | -0.341463414634 | 0.027 | 54.2M |
| SRZ | STELLAR RESOURCE | -0.157894736842 | -0.0588235294118 | 0.016 | 6.1M |
| AEE | AURA ENERGY | -0.16 | -0.0869565217391 | 0.021 | 21.7M |
| TRT | TODD RIVER RESOU | -0.166666666667 | -0.411764705882 | 0.1 | 6.5M |
| PEN | PENINSULA ENERGY | -0.193548387097 | -0.450549450549 | 0.25 | 60.8M |
| GGG | GREENLAND MINERA | -0.20618556701 | -0.23 | 0.077 | 89.5M |
| RLC | REEDYAGOON | -0.214285714286 | -0.816666666667 | 0.011 | 4.4M |
| RDM | RED METAL | -0.214285714286 | -0.266666666667 | 0.11 | 24.2M |
| MDX | MINDAX | -0.25 | 0.2 | 0.006 | 4.4M |
| RVY | RIFT VALLEY RESO | -0.285714285714 | -0.2 | 0.02 | 15.0M |
| AMD | ARROW MINERALS | -0.3 | -0.447368421053 | 0.021 | 7.1M |
| KLH | KALIA | -0.307692307692 | -0.307692307692 | 0.009 | 20.1M |
| CXO | CORE EXPLORATION | -0.308823529412 | -0.459770114943 | 0.047 | 29.1M |
| VMY | VIMY RESOURCES | -0.323529411765 | -0.28125 | 0.115 | 49.8M |
| IEC | INTRA ENERGY COR | -0.333333333333 | 0.666666666667 | 0.01 | 5.0M |
| AGE | ALLIGATOR ENERGY | -0.333333333333 | -0.272727272727 | 0.008 | 4.8M |
| HAV | HAVILAH RESOURCE | -0.35628742515 | -0.104166666667 | 0.215 | 49.1M |
| MHC | MANHATTAN CORP | -0.379310344828 | -0.307692307692 | 0.018 | 3.5M |
| AZI | ALTA ZINC | -0.384615384615 | -0.333333333333 | 0.008 | 11.0M |
| APC | AUSTRALIAN POTAS | -0.456 | -0.352380952381 | 0.068 | 20.7M |
| CHK | COHIBA MINERALS | -0.466666666667 | -0.2 | 0.008 | 5.0M |
| LAM | LARAMIDE | -0.5 | -0.5 | 0.25 | 29M |
| CZL | CONSOLIDATED ZIN | -0.533333333333 | -0.461538461538 | 0.007 | 6.4M |
| THX | THUNDELARRA | -0.583333333333 | -0.393939393939 | 0.02 | 13.3M |
| MGT | MAGNETITE MINES | -0.648648648649 | -0.657894736842 | 0.013 | 9.6M |
| RMT | RMA ENERGY | -0.666666666667 | -0.666666666667 | 0.001 | 2.1M |
| TAS | TASMAN RESOURCES | -0.694444444444 | -0.38202247191 | 0.055 | 26.7M |
| AFR | AFRICAN ENERGY | -0.7375 | -0.461538461538 | 0.021 | 14.4M |
| WML | WOOMERA MINING | -0.86 | -0.86 | 0.14 | 15.8M |
Australian Vanadium (ASX:AVL) tops the list with a gain of 180 per cent over the past year. But that is because of its interest in vanadium – which is in demand due to its role in energy storage.
The company owns the Nowthanna Hill uranium and vanadium project in Western Australia, but its key focus is the Gabanintha vanadium project, which is also in Western Australia.
Energy Metals (ASX:EME), one of the few pure-play uranium explorers, has witnessed decent share price gains on both a one-year and year-to-date basis.
Energy Metals has climbed 60 per cent over the past 12 months and 78 per cent since the start of this year.
The company’s Bigrlyi project in the Northern Territory is currently on care and maintenance, but Energy Metals is planning to undertake further studies on the project in the next financial year.
Energy Metals has all the necessary permits and authorities to export uranium oxide concentrates from Australia.
The company has completed its first shipment and is negotiating with Australian uranium producers to enable further shipments from Australia for resale, primarily to major Chinese
utility China General Nuclear Power Group.
Other players like Vimy Resources (ASX:VMY), meanwhile, have not fared as well, with its share price sliding 32 per cent over the past year and 28 per cent since the start of the year.
Toro Energy (ASX:TOE) has also lost ground. Its share price has dipped nearly 16 per cent in the last 12 months and 34 per cent so far this year.
Stockhead is proud to use MakCorp as a provider of great value, accurate and reliable data on ASX-listed mining stocks. For more information head to MakCorp’s website.
![]()
This article does not constitute financial product advice. You should consider obtaining independent advice before making any financial decisions.


Get the latest Stockhead news delivered free to your inbox.