Gold Digger: Bring on the recession already, gold bulls plead

Pic: Khosrork, iStock / Getty Images Plus
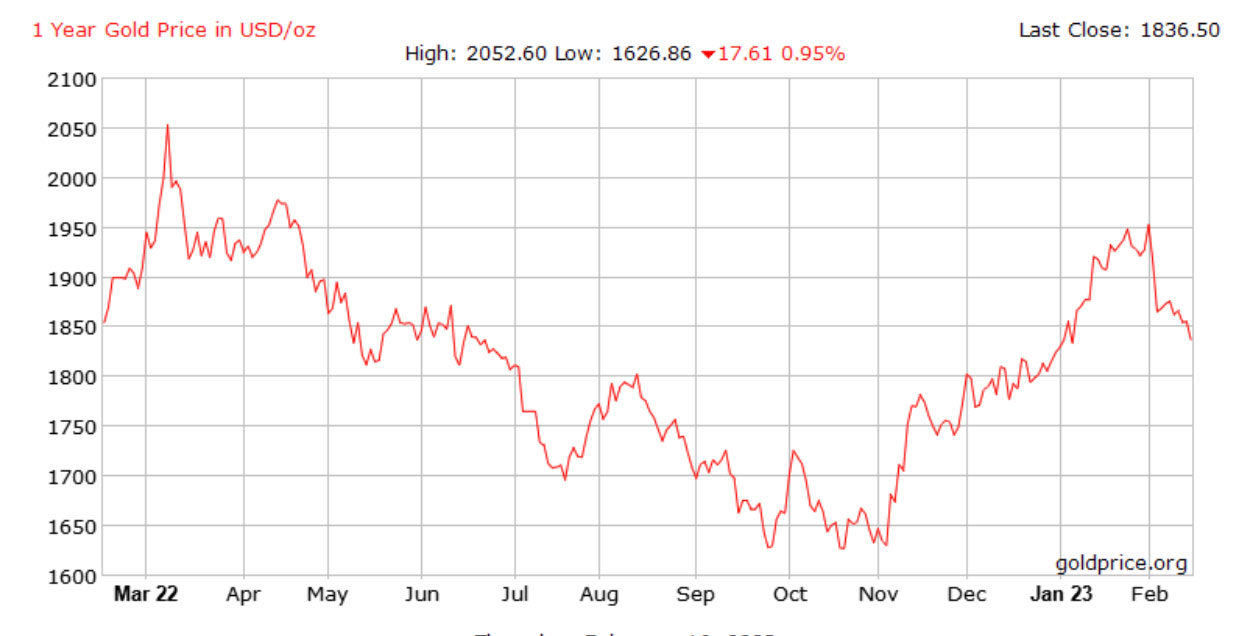
- Gold prices weakened this week on a hot US producer price index (PPI) report
- “… the outlook should be for higher prices by the end of the year”: OANDA’s Ed Moya
- Takeover target Newcrest delivers shock $450 million dividend payout
- ASX small cap gold stocks of the week: Falcon Metals, Matsa Resources
Our Gold Digger column wraps all the news driving ASX stocks with exposure to precious metals.
Gold prices initially weakened this week on a hot US producer price index (PPI) report, which stoked inflation worries and the possibly of more rate hikes.
After falling 0.2% in December, producer prices jumped 0.7% in January — nearly double what economists had forecast.
But the medium-term outlook for gold remains robust. OANDA’s Ed Moya says the worst-case scenario for gold is a ‘no landing’ scenario, which the Fed will not abide.
Unlike hard (recession) or soft (no recession) economic landings, in a ‘no landing’ scenario, the economy doesn’t slow down.
Inflation remains above-trend, and the Fed is forced to not only hike rates by more than expected but keep them elevated for longer.
“The US economy is too strong, and the Fed will have to consider being more aggressive with its rate hiking cycle, which should surely send this economy into a recession,” Moya says.
Which is good news for gold.
According to ANZ commodity strategists Daniel Hynes and Soni Kumari, gold underperforms in the six months before a recession but tends to outperform equities during them, with average returns of 16%.
“Gold might consolidate here until we see exactly how high markets want to price in the peak rate,” Moya says.
“Short-term dollar strength might drag gold down a little, but the outlook should be for higher prices by the end of the year.”
Newcrest announces surprise divvie windfall
Newcrest Mining(ASX:NCM) delivered a shock $450 million dividend payout in a hint to shareholders it can go it alone in the face of a $24.5 billion bid from the world’s biggest gold miner Newmont Mining.
It came as Newcrest rejected the 0.38 for 1 scrip bid from Newmont, which valued Newcrest shares at a 21% premium to its pre-bid level at $27.16 a pop.
However, NCM has said it would allow Newmont under the hood, offering access to non-public information to inspire the Denver-based 6Mozpa gold giant to come back with a better offer.
RBC’s Alex Barkley said the dividend came as a surprise but sent a positive signal for its long-term prospects.
“We had expected the same 7.5cps paid in 1H FY22 to again be paid, leaving better cash flow in H2 FY23 to allow a 2H catchup payment,” he says.
“However, NCM has opted for a strong 1H dividend; firstly in terms of the interim, and this has been further topped up by the special. NCM said the dividend demonstrates confidence in its ability to fund its growth pipeline while simultaneously providing strong shareholder returns.”
The company made a statutory and underlying profit of US$293m after producing 1.04Moz of gold and 67,000t of copper in the first half of 2022-23, up 25% and 32% respectively with all in sustaining costs 8% lower at US$1089/oz and margins 17% higher at US$585/oz.
Winners & Losers
Here’s how ASX-listed precious metals stocks are performing:
Scroll or swipe to reveal table. Click headings to sort. Best viewed on a laptop.
Stocks missing from this list? Email [email protected]
| CODE | COMPANY | 1 WEEK RETURN % | 1 MONTH RETURN % | 6 MONTH RETURN % | 1 YEAR RETURN % | PRICE | MARKET CAP |
|---|---|---|---|---|---|---|---|
| MEG | Megado Minerals Ltd | 51% | 44% | -41% | -24% | 0.065 | $5,912,500 |
| EMU | EMU NL | 43% | -18% | -59% | -68% | 0.004 | $2,749,072 |
| FAL | Falconmetalsltd | 42% | -3% | 36% | -30% | 0.32 | $60,180,000 |
| PUR | Pursuit Minerals | 27% | 27% | 56% | 12% | 0.028 | $33,133,946 |
| MAT | Matsa Resources | 22% | 13% | -2% | -28% | 0.044 | $19,364,217 |
| PUA | Peak Minerals Ltd | 20% | 20% | -40% | -50% | 0.006 | $6,248,260 |
| MCT | Metalicity Limited | 20% | 0% | 0% | -61% | 0.003 | $10,476,118 |
| THR | Thor Energy PLC | 20% | 0% | -40% | -63% | 0.006 | $8,853,677 |
| AVW | Avira Resources Ltd | 20% | 0% | -40% | -57% | 0.003 | $6,401,370 |
| KNB | Koonenberrygold | 20% | -2% | -27% | -57% | 0.06 | $4,545,387 |
| TCG | Turaco Gold Limited | 19% | 0% | -6% | -44% | 0.064 | $27,801,583 |
| DCX | Discovex Res Ltd | 17% | 17% | -36% | -63% | 0.0035 | $13,210,272 |
| PNX | PNX Metals Limited | 17% | -7% | -7% | -25% | 0.0035 | $17,776,231 |
| CXU | Cauldron Energy Ltd | 17% | 0% | -28% | -64% | 0.007 | $7,452,544 |
| TRM | Truscott Mining Corp | 16% | 179% | 303% | 353% | 0.145 | $24,237,774 |
| BMO | Bastion Minerals | 16% | 58% | -57% | -69% | 0.052 | $7,824,064 |
| ADG | Adelong Gold Limited | 11% | 43% | -50% | -67% | 0.01 | $5,338,223 |
| XTC | Xantippe Res Ltd | 10% | 10% | -50% | -45% | 0.0055 | $52,900,498 |
| KSN | Kingston Resources | 9% | 5% | 15% | -36% | 0.105 | $43,643,634 |
| ORN | Orion Minerals Ltd | 9% | 9% | -13% | -42% | 0.0175 | $83,218,619 |
| PRX | Prodigy Gold NL | 9% | -8% | -16% | -55% | 0.012 | $20,974,594 |
| KAU | Kaiser Reef | 9% | -3% | 3% | -8% | 0.185 | $25,151,339 |
| SVG | Savannah Goldfields | 9% | 6% | -5% | -29% | 0.19 | $35,881,203 |
| VAN | Vango Mining Ltd | 8% | 13% | 30% | 33% | 0.052 | $65,516,757 |
| VMC | Venus Metals Cor Ltd | 7% | 4% | -15% | -24% | 0.145 | $25,821,409 |
| BBX | BBX Minerals Ltd | 7% | 36% | 114% | 3% | 0.15 | $73,608,221 |
| SFM | Santa Fe Minerals | 7% | 9% | -12% | -62% | 0.075 | $5,461,409 |
| NAG | Nagambie Resources | 7% | -3% | -15% | 20% | 0.06 | $32,016,628 |
| PGO | Pacgold | 7% | 0% | -17% | -48% | 0.385 | $20,335,872 |
| DTR | Dateline Resources | 7% | -16% | -74% | -64% | 0.032 | $18,085,905 |
| CLA | Celsius Resource Ltd | 6% | -15% | 31% | -37% | 0.017 | $29,715,265 |
| NSM | Northstaw | 6% | -16% | 9% | -35% | 0.185 | $22,223,495 |
| SMI | Santana Minerals Ltd | 5% | 19% | 0% | 93% | 0.87 | $123,485,406 |
| ICL | Iceni Gold | 5% | -19% | 0% | -13% | 0.105 | $13,460,625 |
| HMG | Hamelingoldlimited | 5% | -19% | -27% | -37% | 0.11 | $11,550,000 |
| HAW | Hawthorn Resources | 4% | -9% | 18% | 9% | 0.1 | $33,501,561 |
| PRS | Prospech Limited | 4% | 0% | -3% | -47% | 0.028 | $2,472,361 |
| CPM | Coopermetalslimited | 3% | 30% | -40% | -44% | 0.3 | $11,485,600 |
| KAL | Kalgoorliegoldmining | 3% | -11% | -47% | -55% | 0.072 | $5,575,291 |
| AAR | Astral Resources NL | 3% | -4% | 0% | -31% | 0.075 | $49,905,748 |
| A8G | Australasian Metals | 3% | -5% | -26% | -63% | 0.195 | $8,028,246 |
| CBY | Canterbury Resources | 3% | 3% | -7% | -45% | 0.041 | $5,904,965 |
| A1G | African Gold Ltd. | 2% | -8% | 15% | -55% | 0.089 | $13,659,515 |
| ZNC | Zenith Minerals Ltd | 2% | -8% | -26% | -35% | 0.23 | $80,892,390 |
| CYL | Catalyst Metals | 2% | 3% | -1% | -27% | 1.38 | $139,315,449 |
| AUT | Auteco Minerals | 2% | -27% | 0% | -45% | 0.046 | $96,871,961 |
| BYH | Bryah Resources Ltd | 2% | -2% | -13% | -55% | 0.0245 | $7,031,337 |
| OBM | Ora Banda Mining Ltd | 2% | 6% | 54% | 95% | 0.1 | $141,153,431 |
| IDA | Indiana Resources | 2% | -8% | -10% | -3% | 0.056 | $28,056,270 |
| BRB | Breaker Res NL | 2% | -11% | 29% | 16% | 0.29 | $93,097,036 |
| AZS | Azure Minerals | 2% | 5% | 26% | -23% | 0.315 | $103,512,024 |
| RND | Rand Mining Ltd | 1% | -3% | -6% | -1% | 1.4125 | $80,337,295 |
| NWM | Norwest Minerals | 1% | -2% | 32% | 17% | 0.0645 | $14,214,873 |
| NPM | Newpeak Metals | 0% | 0% | 0% | 0% | 0.001 | $9,145,132 |
| FFX | Firefinch Ltd | 0% | 0% | 0% | -15% | 0.2 | $236,569,315 |
| GED | Golden Deeps | 0% | 0% | -35% | -9% | 0.01 | $11,552,267 |
| TMX | Terrain Minerals | 0% | 8% | -13% | -19% | 0.0065 | $7,040,795 |
| SKY | SKY Metals Ltd | 0% | 0% | -19% | -44% | 0.05 | $18,839,174 |
| AAU | Antilles Gold Ltd | 0% | -10% | -27% | -56% | 0.038 | $18,517,804 |
| CWX | Carawine Resources | 0% | -8% | 0% | -31% | 0.11 | $21,649,921 |
| GMR | Golden Rim Resources | 0% | -9% | -33% | -68% | 0.032 | $18,834,828 |
| SRN | Surefire Rescs NL | 0% | -13% | -13% | -7% | 0.014 | $23,720,452 |
| WCN | White Cliff Min Ltd | 0% | -20% | 0% | -63% | 0.012 | $9,016,626 |
| ASR | Asra Minerals Ltd | 0% | -30% | -20% | -50% | 0.014 | $22,006,780 |
| MHC | Manhattan Corp Ltd | 0% | 17% | -30% | -56% | 0.007 | $12,282,630 |
| TRY | Troy Resources Ltd | 0% | 0% | 0% | 0% | 0.0295 | $62,920,961 |
| CGN | Crater Gold Min Ltd | 0% | 0% | 0% | 0% | 0.017 | $21,063,474 |
| GUL | Gullewa Limited | 0% | -13% | -15% | -28% | 0.052 | $10,180,201 |
| G50 | Gold50Limited | 0% | -21% | 6% | -34% | 0.19 | $10,819,170 |
| ADV | Ardiden Ltd | 0% | -13% | -22% | -46% | 0.007 | $18,818,347 |
| VKA | Viking Mines Ltd | 0% | 50% | 50% | -14% | 0.012 | $12,303,101 |
| RML | Resolution Minerals | 0% | -17% | -17% | -56% | 0.0075 | $8,637,970 |
| TBA | Tombola Gold Ltd | 0% | 0% | -24% | -16% | 0.026 | $33,129,243 |
| HRN | Horizon Gold Ltd | 0% | -3% | -11% | -20% | 0.34 | $42,561,758 |
| RDN | Raiden Resources Ltd | 0% | -17% | -44% | -72% | 0.005 | $8,272,912 |
| ANX | Anax Metals Ltd | 0% | 2% | -13% | -28% | 0.066 | $27,429,453 |
| SI6 | SI6 Metals Limited | 0% | -17% | -29% | -50% | 0.005 | $8,972,368 |
| RVR | Red River Resources | 0% | 0% | -50% | -67% | 0.073 | $37,847,908 |
| WMC | Wiluna Mining Corp | 0% | 0% | 0% | -78% | 0.205 | $74,238,031 |
| CDR | Codrus Minerals Ltd | 0% | -17% | 69% | 0% | 0.12 | $4,851,600 |
| BAT | Battery Minerals Ltd | 0% | -20% | -33% | -60% | 0.004 | $11,740,969 |
| POL | Polymetals Resources | 0% | -5% | 27% | 41% | 0.19 | $8,584,711 |
| RDS | Redstone Resources | 0% | 11% | 0% | -17% | 0.01 | $7,368,324 |
| HRZ | Horizon | 0% | 2% | -17% | -52% | 0.062 | $39,239,312 |
| CDT | Castle Minerals | 0% | -4% | -30% | -59% | 0.023 | $22,988,339 |
| RDT | Red Dirt Metals Ltd | 0% | -5% | 0% | -20% | 0.45 | $202,432,908 |
| ALY | Alchemy Resource Ltd | 0% | -11% | -16% | 45% | 0.016 | $20,027,296 |
| LCY | Legacy Iron Ore | 0% | -11% | -20% | -16% | 0.016 | $96,102,393 |
| SAU | Southern Gold | 0% | -17% | -35% | -61% | 0.024 | $7,206,847 |
| LRL | Labyrinth Resources | 0% | -15% | -41% | -60% | 0.017 | $16,311,285 |
| XAM | Xanadu Mines Ltd | 0% | 3% | 0% | 7% | 0.03 | $45,219,950 |
| KTA | Krakatoa Resources | 0% | 2% | -29% | -6% | 0.044 | $15,511,946 |
| TAR | Taruga Minerals | 0% | -32% | -37% | -50% | 0.017 | $12,708,482 |
| S2R | S2 Resources | 0% | -13% | -3% | -21% | 0.15 | $55,315,603 |
| PKO | Peako Limited | 0% | -13% | -33% | -30% | 0.014 | $5,309,014 |
| ICG | Inca Minerals Ltd | 0% | -22% | -60% | -81% | 0.021 | $10,139,921 |
| OAU | Ora Gold Limited | 0% | 0% | -27% | -50% | 0.005 | $5,905,388 |
| GNM | Great Northern | 0% | 0% | -20% | -33% | 0.004 | $6,836,204 |
| BTR | Brightstar Resources | 0% | -14% | -10% | -37% | 0.019 | $17,411,705 |
| M24 | Mamba Exploration | 0% | -13% | 90% | 0% | 0.2 | $11,281,918 |
| DEX | Duke Exploration | 0% | 0% | -28% | -68% | 0.053 | $5,587,240 |
| ANL | Amani Gold Ltd | 0% | -33% | 0% | 0% | 0.001 | $24,693,441 |
| GCY | Gascoyne Res Ltd | 0% | 0% | -43% | -24% | 0.195 | $83,082,880 |
| HAV | Havilah Resources | 0% | -4% | 1% | 106% | 0.35 | $115,573,312 |
| GCY | Gascoyne Res Ltd | 0% | 0% | -43% | -24% | 0.195 | $83,082,880 |
| PNT | Panthermetalsltd | 0% | -5% | -19% | -21% | 0.19 | $5,842,500 |
| MTC | Metalstech Ltd | -1% | 5% | 41% | 87% | 0.495 | $86,830,249 |
| CHZ | Chesser Resources | -1% | -8% | -1% | -23% | 0.089 | $52,974,121 |
| ASO | Aston Minerals Ltd | -1% | 10% | -2% | -43% | 0.088 | $97,990,722 |
| STN | Saturn Metals | -1% | -11% | -42% | -59% | 0.17 | $25,763,249 |
| WRM | White Rock Min Ltd | -2% | -10% | -33% | -70% | 0.064 | $17,328,884 |
| SPQ | Superior Resources | -2% | -6% | 13% | 43% | 0.063 | $102,073,225 |
| EMR | Emerald Res NL | -2% | 9% | 29% | 41% | 1.505 | $893,670,479 |
| AGC | AGC Ltd | -2% | -11% | -24% | -39% | 0.058 | $5,700,000 |
| TTM | Titan Minerals | -2% | -16% | 14% | -44% | 0.0675 | $97,377,850 |
| DTM | Dart Mining NL | -2% | -25% | -44% | -48% | 0.045 | $6,847,305 |
| BGD | Bartongoldholdings | -2% | -10% | 22% | -20% | 0.225 | $18,973,307 |
| AQI | Alicanto Min Ltd | -2% | -13% | -15% | -55% | 0.045 | $20,079,613 |
| EMC | Everest Metals Corp | -2% | -20% | -16% | -37% | 0.088 | $9,472,547 |
| MEU | Marmota Limited | -2% | -4% | -15% | 0% | 0.044 | $47,116,626 |
| GSM | Golden State Mining | -2% | -19% | -32% | -53% | 0.043 | $5,031,611 |
| MKR | Manuka Resources. | -2% | -15% | -41% | -74% | 0.085 | $43,743,733 |
| MKG | Mako Gold | -2% | -9% | -41% | -53% | 0.041 | $18,866,054 |
| SFR | Sandfire Resources | -2% | 0% | 27% | -14% | 6.26 | $2,873,850,227 |
| KCN | Kingsgate Consolid. | -3% | -18% | -15% | 7% | 1.5 | $335,300,486 |
| TBR | Tribune Res Ltd | -3% | -10% | -5% | -24% | 3.6 | $188,885,077 |
| QML | Qmines Limited | -3% | -5% | 13% | -38% | 0.175 | $16,237,626 |
| BGL | Bellevue Gold Ltd | -3% | -17% | 29% | 26% | 1.1225 | $1,275,910,992 |
| OKR | Okapi Resources | -3% | -6% | -13% | -42% | 0.17 | $25,117,921 |
| GRL | Godolphin Resources | -3% | -5% | -1% | -32% | 0.0845 | $10,653,250 |
| TGM | Theta Gold Mines Ltd | -3% | -12% | -12% | -56% | 0.066 | $40,854,599 |
| LM8 | Lunnonmetalslimited | -3% | -1% | 2% | 9% | 0.95 | $104,382,321 |
| NVA | Nova Minerals Ltd | -3% | -11% | -30% | -32% | 0.605 | $129,183,291 |
| TSO | Tesoro Gold Ltd | -3% | -19% | -26% | -58% | 0.03 | $30,827,419 |
| GWR | GWR Group Ltd | -3% | -8% | -36% | -64% | 0.057 | $18,309,349 |
| MM8 | Medallion Metals. | -3% | -10% | -33% | -34% | 0.14 | $19,593,708 |
| E2M | E2 Metals | -4% | -16% | -18% | -43% | 0.135 | $26,882,864 |
| GSR | Greenstone Resources | -4% | -16% | -62% | -32% | 0.026 | $27,970,253 |
| MEI | Meteoric Resources | -4% | 108% | 862% | 681% | 0.125 | $198,480,217 |
| ERM | Emmerson Resources | -4% | -13% | -33% | -36% | 0.074 | $40,308,524 |
| PNM | Pacific Nickel Mines | -4% | -19% | 4% | -30% | 0.073 | $27,452,478 |
| CST | Castile Resources | -4% | -4% | -23% | -47% | 0.096 | $23,222,633 |
| LEX | Lefroy Exploration | -4% | -4% | -16% | -25% | 0.24 | $38,509,920 |
| SMS | Starmineralslimited | -4% | -4% | -25% | -67% | 0.07 | $2,070,600 |
| X64 | Ten Sixty Four Ltd | -4% | -17% | -10% | -24% | 0.565 | $132,468,115 |
| AM7 | Arcadia Minerals | -4% | 0% | 22% | -6% | 0.22 | $10,273,536 |
| KAI | Kairos Minerals Ltd | -4% | -8% | -27% | -15% | 0.022 | $41,245,963 |
| BEZ | Besragoldinc | -4% | -19% | 39% | -55% | 0.044 | $15,569,923 |
| LYN | Lycaonresources | -4% | -12% | -9% | -33% | 0.2675 | $8,805,766 |
| G88 | Golden Mile Res Ltd | -5% | -5% | -30% | -61% | 0.021 | $4,296,385 |
| MVL | Marvel Gold Limited | -5% | -16% | -30% | -60% | 0.021 | $14,794,382 |
| TG1 | Techgen Metals Ltd | -5% | -12% | -42% | -27% | 0.084 | $4,621,615 |
| AVM | Advance Metals Ltd | -5% | -23% | 0% | -41% | 0.01 | $5,220,397 |
| MI6 | Minerals260Limited | -5% | -10% | -14% | -44% | 0.3 | $66,000,000 |
| IVR | Investigator Res Ltd | -5% | -13% | -15% | -34% | 0.039 | $56,049,383 |
| KWR | Kingwest Resources | -5% | -5% | -40% | -81% | 0.039 | $10,987,346 |
| TAM | Tanami Gold NL | -5% | -11% | -17% | -37% | 0.039 | $47,003,882 |
| SBM | St Barbara Limited | -5% | -27% | -39% | -56% | 0.6325 | $522,586,653 |
| IPT | Impact Minerals | -5% | 19% | 6% | -25% | 0.0095 | $23,573,020 |
| GML | Gateway Mining | -5% | -19% | -39% | -54% | 0.055 | $14,461,824 |
| BC8 | Black Cat Syndicate | -5% | -20% | -4% | -38% | 0.36 | $97,145,463 |
| AGG | AngloGold Ashanti | -5% | -18% | 22% | -8% | 5.35 | $479,045,698 |
| YRL | Yandal Resources | -5% | -11% | -45% | -73% | 0.088 | $13,886,671 |
| AME | Alto Metals Limited | -6% | -3% | -11% | -22% | 0.068 | $41,671,453 |
| HXG | Hexagon Energy | -6% | -6% | -6% | -69% | 0.017 | $8,719,570 |
| KIN | KIN Min NL | -6% | -21% | -44% | -50% | 0.05 | $60,085,678 |
| RSG | Resolute Mining | -6% | 0% | -6% | -9% | 0.245 | $521,606,609 |
| PDI | Predictive Disc Ltd | -6% | -18% | -24% | -30% | 0.16 | $294,612,786 |
| GAL | Galileo Mining Ltd | -6% | -22% | -32% | 300% | 0.8 | $159,088,066 |
| KRM | Kingsrose Mining Ltd | -6% | -17% | 9% | -15% | 0.063 | $50,419,277 |
| CHN | Chalice Mining Ltd | -6% | -10% | 28% | -18% | 6.11 | $2,364,088,378 |
| HCH | Hot Chili Ltd | -6% | -19% | 9% | -42% | 0.855 | $102,722,877 |
| TLM | Talisman Mining | -6% | -9% | 0% | -9% | 0.155 | $29,099,622 |
| ADT | Adriatic Metals | -6% | -9% | 48% | 38% | 3.19 | $709,551,885 |
| FG1 | Flynngold | -6% | -5% | -1% | -41% | 0.091 | $8,949,998 |
| FEG | Far East Gold | -6% | -22% | -20% | 0% | 0.37 | $53,344,043 |
| ADN | Andromeda Metals Ltd | -7% | -26% | -57% | -77% | 0.043 | $130,620,354 |
| NCM | Newcrest Mining | -7% | 2% | 23% | 0% | 23.555 | $21,359,640,846 |
| BCN | Beacon Minerals | -7% | -3% | 0% | -20% | 0.028 | $101,432,741 |
| CEL | Challenger Exp Ltd | -7% | -20% | -30% | -54% | 0.14 | $146,414,105 |
| GBZ | GBM Rsources Ltd | -7% | -21% | -34% | -67% | 0.041 | $20,822,326 |
| CAI | Calidus Resources | -7% | -40% | -66% | -66% | 0.2325 | $105,492,202 |
| REZ | Resourc & En Grp Ltd | -7% | -13% | -41% | -72% | 0.013 | $6,497,475 |
| RRL | Regis Resources | -7% | -17% | 8% | -2% | 1.9025 | $1,457,200,035 |
| LCL | Los Cerros Limited | -7% | -17% | 0% | -68% | 0.038 | $28,101,823 |
| GOR | Gold Road Res Ltd | -7% | -21% | 3% | 2% | 1.445 | $1,565,760,353 |
| NXM | Nexus Minerals Ltd | -8% | -23% | -24% | -50% | 0.185 | $63,463,395 |
| MXR | Maximus Resources | -8% | -14% | -34% | -46% | 0.037 | $11,805,063 |
| AUC | Ausgold Limited | -8% | -23% | -4% | 7% | 0.049 | $99,444,253 |
| MEK | Meeka Metals Limited | -8% | -16% | -33% | -8% | 0.049 | $55,515,664 |
| GIB | Gibb River Diamonds | -8% | -5% | 2% | 2% | 0.061 | $12,902,076 |
| TIE | Tietto Minerals | -8% | -18% | 34% | 12% | 0.67 | $723,205,781 |
| M2R | Miramar | -8% | -9% | -27% | -63% | 0.073 | $5,513,176 |
| PRU | Perseus Mining Ltd | -8% | -19% | 11% | 22% | 1.885 | $2,577,667,968 |
| MGV | Musgrave Minerals | -8% | -23% | -33% | -41% | 0.18 | $109,373,471 |
| SLR | Silver Lake Resource | -8% | -26% | -26% | -36% | 1.08 | $1,032,016,210 |
| KCC | Kincora Copper | -8% | 0% | 13% | -46% | 0.07 | $7,288,923 |
| GMD | Genesis Minerals | -8% | -14% | -13% | -35% | 1.14 | $473,280,532 |
| SXG | Southern Cross Gold | -8% | -8% | 51% | 0% | 0.67 | $61,979,916 |
| RMX | Red Mount Min Ltd | -8% | 10% | -8% | -45% | 0.0055 | $11,508,001 |
| WAF | West African Res Ltd | -9% | -30% | -33% | -24% | 0.91 | $977,433,109 |
| MRR | Minrex Resources Ltd | -9% | -16% | -46% | -53% | 0.032 | $33,630,893 |
| NST | Northern Star | -9% | -9% | 40% | 25% | 11.325 | $13,086,379,335 |
| IGO | IGO Limited | -9% | -9% | 9% | 10% | 13.38 | $10,639,612,773 |
| GBR | Greatbould Resources | -9% | -6% | -24% | -44% | 0.084 | $36,675,987 |
| HMX | Hammer Metals Ltd | -9% | 7% | 11% | -10% | 0.073 | $61,605,551 |
| DEG | De Grey Mining | -9% | -14% | 29% | 12% | 1.33 | $2,123,187,004 |
| GTR | Gti Energy Ltd | -9% | -9% | -41% | -52% | 0.01 | $15,054,836 |
| AWV | Anova Metals Ltd | -9% | 18% | 33% | 11% | 0.2 | $81,901,174 |
| GMN | Gold Mountain Ltd | -9% | -17% | -17% | -67% | 0.005 | $9,849,163 |
| MDI | Middle Island Res | -9% | 0% | -38% | -63% | 0.05 | $6,120,911 |
| ARL | Ardea Resources Ltd | -9% | -22% | -40% | -14% | 0.64 | $109,761,774 |
| CMM | Capricorn Metals | -10% | -24% | -6% | 8% | 3.9 | $1,488,002,373 |
| MOH | Moho Resources | -10% | -14% | -30% | -65% | 0.019 | $4,153,244 |
| STK | Strickland Metals | -10% | -19% | -39% | -45% | 0.0325 | $49,757,720 |
| SPD | Southernpalladium | -10% | -19% | -14% | 0% | 0.65 | $28,000,913 |
| BNZ | Benzmining | -10% | 14% | -9% | -29% | 0.46 | $33,733,602 |
| DRE | Dreadnought Resources Ltd | -10% | -9% | 2% | 114% | 0.09 | $303,022,996 |
| MZZ | Matador Mining Ltd | -10% | -31% | -28% | -70% | 0.09 | $29,630,570 |
| MOM | Moab Minerals Ltd | -10% | 0% | -67% | -67% | 0.009 | $6,137,671 |
| WGX | Westgold Resources. | -10% | -20% | -21% | -52% | 0.98 | $475,990,844 |
| ALK | Alkane Resources Ltd | -10% | -17% | -23% | -26% | 0.62 | $380,233,296 |
| DCN | Dacian Gold Ltd | -10% | -15% | -15% | -53% | 0.094 | $116,812,890 |
| RED | Red 5 Limited | -11% | -35% | -42% | -45% | 0.17 | $474,778,841 |
| FAU | First Au Ltd | -11% | -11% | -43% | -60% | 0.004 | $3,807,973 |
| SSR | SSR Mining Inc. | -11% | -20% | -8% | -18% | 20.25 | $378,062,291 |
| EVN | Evolution Mining Ltd | -11% | -14% | 7% | -29% | 2.855 | $5,449,998,467 |
| NML | Navarre Minerals Ltd | -11% | -19% | -34% | -59% | 0.035 | $54,639,408 |
| RMS | Ramelius Resources | -11% | -25% | -18% | -42% | 0.8325 | $742,261,370 |
| AMI | Aurelia Metals Ltd | -12% | -23% | -59% | -74% | 0.115 | $142,305,280 |
| MAU | Magnetic Resources | -12% | -14% | -31% | -52% | 0.7 | $158,363,543 |
| GSN | Great Southern | -12% | -27% | -35% | -58% | 0.022 | $14,597,154 |
| BMR | Ballymore Resources | -12% | -6% | -26% | -15% | 0.145 | $13,966,031 |
| MRZ | Mont Royal Resources | -12% | 19% | -26% | -28% | 0.215 | $14,723,774 |
| PGD | Peregrine Gold | -12% | -15% | -53% | -31% | 0.43 | $16,668,042 |
| NAE | New Age Exploration | -13% | -22% | 17% | -53% | 0.007 | $10,051,292 |
| WWI | West Wits Mining Ltd | -13% | -36% | -26% | -67% | 0.014 | $30,130,527 |
| AL8 | Alderan Resource Ltd | -13% | -13% | -36% | -70% | 0.007 | $4,047,863 |
| ARV | Artemis Resources | -13% | -16% | -53% | -70% | 0.021 | $29,219,786 |
| ZAG | Zuleika Gold Ltd | -13% | -18% | -28% | -54% | 0.0165 | $8,630,335 |
| AAJ | Aruma Resources Ltd | -14% | -21% | -20% | -39% | 0.064 | $10,359,459 |
| AWJ | Auric Mining | -14% | -8% | -40% | -44% | 0.055 | $8,244,154 |
| MTH | Mithril Resources | -14% | -25% | -50% | -77% | 0.003 | $9,789,271 |
| MLS | Metals Australia | -15% | -2% | -24% | 12% | 0.047 | $30,958,846 |
| KZR | Kalamazoo Resources | -15% | -17% | -36% | -49% | 0.175 | $26,043,390 |
| NMR | Native Mineral Res | -15% | -30% | -28% | -75% | 0.068 | $8,169,434 |
| CAZ | Cazaly Resources | -15% | -18% | -33% | -35% | 0.028 | $11,154,654 |
| ENR | Encounter Resources | -15% | -20% | -15% | -3% | 0.14 | $53,328,867 |
| EM2 | Eagle Mountain | -15% | -11% | -22% | -68% | 0.195 | $60,993,373 |
| BNR | Bulletin Res Ltd | -15% | 5% | -21% | -4% | 0.11 | $33,762,977 |
| FML | Focus Minerals Ltd | -16% | -24% | 10% | -43% | 0.16 | $51,580,556 |
| RGL | Riversgold | -16% | -25% | -45% | 10% | 0.021 | $20,800,290 |
| SNG | Siren Gold | -16% | -28% | -41% | -49% | 0.13 | $16,782,351 |
| CTO | Citigold Corp Ltd | -17% | -29% | -17% | -38% | 0.005 | $14,168,295 |
| SVY | Stavely Minerals Ltd | -17% | -2% | 44% | -47% | 0.245 | $83,167,923 |
| SBR | Sabre Resources | -17% | -29% | -38% | -32% | 0.034 | $9,910,530 |
| BM8 | Battery Age Minerals | -18% | -2% | -2% | 26% | 0.49 | $37,109,082 |
| SLZ | Sultan Resources Ltd | -18% | -44% | -64% | -69% | 0.051 | $4,830,495 |
| OZM | Ozaurum Resources | -18% | -11% | -47% | -42% | 0.067 | $9,144,000 |
| RXL | Rox Resources | -19% | -27% | -44% | -64% | 0.15 | $34,751,656 |
| VRC | Volt Resources Ltd | -19% | -30% | -46% | -50% | 0.0105 | $46,553,087 |
| ARN | Aldoro Resources | -20% | -23% | -29% | -53% | 0.185 | $22,017,902 |
| SVL | Silver Mines Limited | -21% | -26% | -14% | -23% | 0.155 | $210,602,946 |
| TUL | Tulla Resources | -23% | -25% | -50% | -54% | 0.265 | $60,661,809 |
| MBK | Metal Bank Ltd | -24% | -36% | -44% | -58% | 0.025 | $6,359,167 |
| NES | Nelson Resources. | -25% | -25% | -41% | -70% | 0.006 | $3,531,566 |
| AYM | Australia United Min | -25% | -40% | -50% | -57% | 0.003 | $7,370,310 |
| CY5 | Cygnus Metals Ltd | -27% | -9% | 46% | 112% | 0.35 | $61,597,861 |
| PNR | Pantoro Limited | -31% | -42% | -69% | -81% | 0.061 | $104,950,414 |
| CLZ | Classic Min Ltd | -36% | -55% | -80% | -97% | 0.0045 | $5,756,635 |
| AQX | Alice Queen Ltd | -50% | -50% | -67% | -88% | 0.001 | $3,795,431 |
| SIH | Sihayo Gold Limited | -50% | -50% | -67% | -86% | 0.001 | $6,102,128 |
| TMZ | Thomson Res Ltd | -59% | -67% | -74% | -90% | 0.007 | $6,959,608 |
Weekly Small Cap Standouts
FALCON METALS (ASX:FAL)
The Chalice Mining (ASX:CHN) spinout has reported multiple high grade gold hits at Ironbark East, part of the flagship Pyramid Hill project in Victoria.
Highlights include 12m @ 6.18g/t gold from 74m, including 1m @ 52.9g/t from 77m – the highest-grade gold intercept to date at Pyramid Hill.
The drill program was focused on infilling around last year’s program which hit 40m @ 2.8g/t Au from 50m, including several 1m intercepts above 10g/t.
FAL has now defined high grade gold over 400m at Ironbark East. A program of more than 50,000m across the wider project remains on track to complete in May.
“Intersecting high-grade mineralisation at Ironbark East over a 400m strike length is a great result and provides us with encouragement ahead of the commencement of our diamond drilling program later this month,” FAL managing director Tim Markwell says.
“The results at Ironbark confirm the potential of diorite to host economic zones of mineralisation, especially with the intersection of a new zone at Ironbark Central announced earlier this month.
“Our success to date gives us the confidence to further ramp up our activity at Pyramid Hill and we look forward to putting out more updates over coming weeks.”
Pyramid Hill was CHN’s No 1 focus before it hit the motherlode at Julimar, and is highly prospective for high-grade gold deposits like the nearby, world-class Fosterville mine.
According to the Victorian government there’s 32Moz of undiscovered gold in the North Bendigo zone where FAL has a dominant landholding.
FAL is notably chaired by Mark Bennett, discoverer of the Nova nickel discovery.
The $46m capped stock had a massive $23m in the bank at the end of December.
MATSA RESOURCES (ASX:MAT)
The industrious explorer keeps hitting thick gold at the Fortitude North discovery, a stone’s throw from the company’s 489,000oz Fortitude gold mine in WA.
New highlights include 19m at 3.77g/t gold from 100m, incl. 14m at 4.59g/t.
A 1.6km-long system has been defined so far, and it remains open to the north.
This suggests that the remaining 1,792m of drilling, to be completed in March, “will unveil additional thick, high-grade shoots not yet defined by existing drilling”.
MAT says Fortitude North already looks bigger and better than the Fortitude mine.
“These results continue to support our view that Fortitude North is a bigger system than the Fortitude gold mine where Matsa has an established resource of 489,000oz and a 2021 mining study that indicates a positive cash flow of AUD$95m,” MAT boss Paul Poli says.
“The thicker intercepts in the high-grade shoots provide substantial volumes of gold not seen in previous drilling and certainly eclipse what we have seen at Fortitude gold mine.
“What is really exciting, is that the drilling previously completed to the north appears to have completely missed the orientation of these high-grade shoots.
“This new drilling emphatically indicates the system remains open to the north, potentially due to simple fault offset.”
MAT is increasingly confident of achieving its near-term goal of defining 1Moz at the wider Lake Carey project, Poli says.
The overall resource is currently 886,000oz at an ore grade of 2.4g/t.
“I want to reinforce that this year, we have set out a clear key objective for Matsa,” he says.
“We aim to deliver a maiden resource at Fortitude North and take our total Lake Carey gold project resource base to over 1 million ounces before mid-year. Never have I been more confident that we can deliver on this objective.”
Related Topics

Related Stories


UNLOCK INSIGHTS
Discover the untold stories of emerging ASX stocks.
Daily news and expert analysis, it's free to subscribe.
By proceeding, you confirm you understand that we handle personal information in accordance with our Privacy Policy.


