Gold Digger: Investors, precious metals could be your ‘golden ticket’ to gains in 2023

Pic: Via Getty
- Gold prices have historically outperformed during recessions
- ANZ research raises end of 2023 gold price target to $US1,900/oz
- Weekly small cap standouts: Peregrine Gold (ASX:PGD), Ora Gold (ASX:OAU)
Our Gold Digger column wraps all the news driving ASX stocks with exposure to precious metals.
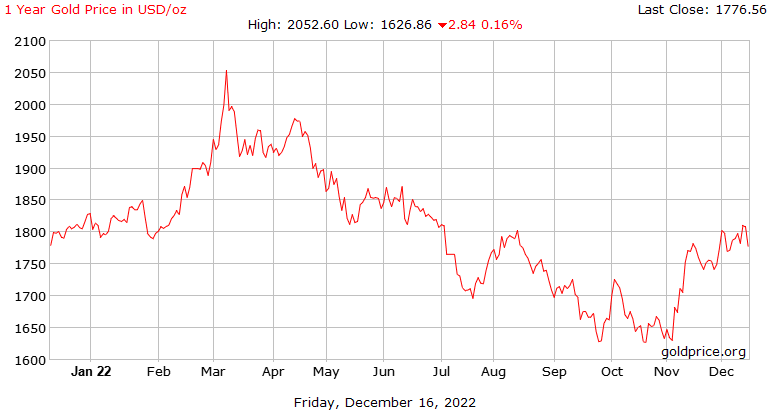
It’s been a rollercoaster ride for gold in 2022, but the consensus seems to be that a recession-hit 2023 will be a lot more positive for the precious metal.
Gold prices tend to come under pressure ahead of recessions, but then outperform other markets (such as equities) during them, according to ANZ research.
“Short term, we see scope for some retracement of gold’s recent gains, but we expect safe haven buying to raise prices,” write ANZ commodity strategists Daniel Hynes and Soni Kumari.
“We have subsequently raised our end of 2023 target to USD1,900/oz.”
That falls short of Saxo’s “outrageous” $US3,000oz 2023 prediction but hey – still a win for gold.
The global economy is at an inflection point, with tighter monetary policies amid high inflation likely to slow economic growth in 2023, Hynes and Kumari say.
This backdrop is typically positive for gold.
“Although we expect the US fed funds rate to peak at 5%, a pause in rate hiking should turn market sentiment in favour of gold,” they say.
“This comes as we approach the end of US dollar dominance, and a depreciation in the currency would add further support to investor demand.”
History tells us that gold performs well during recessions
Gold price returns over the six months before a recession average just 2%, Hynes and Kumari say.
“It then tends to outperform equities during recessions, with average returns of 16%,” the say.
“For the six months after a recession, gold continues to deliver decent gains.”
The 1980s recession had “striking similarities” to the current situation, according to the pair.
“Following the Iranian Revolution in 1979, oil supply was disrupted causing an energy crisis that pushed up already high inflation,” they say.
“Central banks tightened monetary policy, and most countries experienced double-dip recessions.
“Gold rallied from USD230/oz to reach USD835/oz in early 1980 but trended lower into early 1982.
“In late 1982, a second period of weak economic growth lifted the gold price more than 50%.”
Something similar, but different, happened during the Global Financial Crisis.
“Gold rallied for much of the period leading into the Great Financial Crisis of 2008,” Hynes and Kumari say.
“As the magnitude of the crisis became clear, the gold bullion market experienced an increasingly disorderly selloff.
“Prices fell to their lowest value for the year, USD692/oz, in the wake of the Lehman Brothers collapse in September 2008.
“As the world entered a deep and sharp correction in growth, gold rebounded more than 65% to end 2009 just under USD1,200/oz.”
How long will it take for the band-wagoners to return to gold?
Says it all, really.
Is it time for all those gold explorers who just switched to lithium to switch back to gold already?
— Stockrocker (@Stockrocker_ASX) December 15, 2022
Winners & Losers
Here’s how ASX-listed precious metals stocks are performing:
Scroll or swipe to reveal table. Click headings to sort. Best viewed on a laptop.
Stocks missing from this list? Email [email protected]
| CODE | COMPANY | 1 WEEK RETURN % | 1 MONTH RETURN % | 6 MONTH RETURN % | 1 YEAR RETURN % | PRICE | MARKET CAP |
|---|---|---|---|---|---|---|---|
| MEI | Meteoric Resources | 81% | 107% | 123% | 81% | 0.029 | $24,420,758 |
| PGD | Peregrine Gold | 53% | 23% | 53% | 57% | 0.58 | $18,794,666 |
| ANL | Amani Gold | 50% | 0% | 50% | 50% | 0.0015 | $35,540,162 |
| PUR | Pursuit Minerals | 33% | 45% | -11% | -43% | 0.016 | $15,970,867 |
| OAU | Ora Gold | 33% | 0% | -11% | -43% | 0.008 | $6,889,619 |
| NSM | Northstaw | 28% | 19% | -34% | -59% | 0.125 | $15,015,875 |
| SRN | Surefire Rescs | 27% | 8% | -33% | 27% | 0.014 | $22,139,089 |
| AQX | Alice Queen | 25% | 0% | -44% | -75% | 0.0025 | $5,500,625 |
| MEG | Megado Minerals | 23% | -11% | -46% | -46% | 0.049 | $6,737,500 |
| SLZ | Sultan Resources | 17% | -13% | -25% | -48% | 0.083 | $6,912,604 |
| BMR | Ballymore Resources | 14% | -9% | -14% | -32% | 0.16 | $15,410,793 |
| SMS | Starminerals | 14% | 0% | -41% | -65% | 0.074 | $2,188,920 |
| GRL | Godolphin Resources | 14% | 11% | 18% | -23% | 0.1 | $11,836,945 |
| FG1 | Flynngold | 13% | 0% | 0% | -35% | 0.11 | $7,482,021 |
| ASR | Asra Minerals | 13% | -10% | -44% | -10% | 0.018 | $24,892,446 |
| ADV | Ardiden | 13% | 0% | 13% | -18% | 0.009 | $24,195,018 |
| PNM | Pacific Nickel Mines | 11% | 11% | -1% | -7% | 0.079 | $28,618,382 |
| GML | Gateway Mining | 11% | 8% | -13% | -50% | 0.07 | $15,820,767 |
| PNT | Panthermetals | 11% | 5% | 5% | 8% | 0.2 | $6,150,000 |
| XTC | Xantippe Res | 10% | -27% | -39% | 10% | 0.0055 | $46,909,526 |
| SI6 | SI6 Metals | 10% | -8% | -21% | -39% | 0.0055 | $8,224,670 |
| EMC | Everest Metals Corp | 10% | -9% | -13% | -35% | 0.091 | $9,791,846 |
| SBM | St Barbara | 8% | 9% | -37% | -54% | 0.6925 | $571,579,152 |
| GIB | Gibb River Diamonds | 8% | 16% | 40% | -20% | 0.067 | $14,171,133 |
| KZR | Kalamazoo Resources | 7% | -12% | -2% | -42% | 0.225 | $32,740,262 |
| WWI | West Wits Mining | 7% | -6% | -27% | -52% | 0.016 | $32,720,603 |
| CHZ | Chesser Resources | 7% | 7% | -2% | -24% | 0.08 | $47,049,849 |
| MBK | Metal Bank | 6% | 20% | -28% | -40% | 0.036 | $9,953,479 |
| GBZ | GBM Rsources | 5% | -16% | -45% | -64% | 0.041 | $23,636,154 |
| TRM | Truscott Mining Corp | 5% | 21% | -24% | 28% | 0.041 | $6,853,439 |
| ZAG | Zuleika Gold | 5% | 5% | -30% | 11% | 0.021 | $10,984,063 |
| BRB | Breaker Res NL | 5% | 10% | 56% | 10% | 0.32 | $105,996,963 |
| MTC | Metalstech | 5% | 5% | 18% | 53% | 0.435 | $75,407,293 |
| FAL | Falconmetals | 4% | 2% | 9% | 0% | 0.245 | $43,365,000 |
| OZM | Ozaurum Resources | 4% | 7% | -55% | -40% | 0.075 | $5,228,700 |
| ERM | Emmerson Resources | 4% | -13% | -19% | -45% | 0.077 | $41,942,654 |
| MVL | Marvel Gold | 4% | 4% | -16% | -60% | 0.026 | $18,316,854 |
| MDI | Middle Island Res | 4% | -19% | -61% | -46% | 0.052 | $6,365,748 |
| ZNC | Zenith Minerals | 4% | -7% | -15% | 26% | 0.265 | $89,585,217 |
| AWJ | Auric Mining | 4% | 11% | -2% | -27% | 0.08 | $7,507,570 |
| ARV | Artemis Resources | 4% | -18% | -4% | -60% | 0.027 | $37,568,296 |
| EMR | Emerald Res NL | 4% | 4% | -1% | 9% | 1.17 | $694,600,900 |
| DRE | Dreadnought Resources | 3% | -9% | 146% | 153% | 0.091 | $282,781,463 |
| RXL | Rox Resources | 3% | -8% | -41% | -55% | 0.165 | $38,009,623 |
| HMG | Hamelingold | 3% | -6% | 43% | 18% | 0.165 | $18,150,000 |
| HMG | Hamelingold | 3% | -6% | 43% | 18% | 0.165 | $18,150,000 |
| CLA | Celsius Resource | 3% | 50% | -13% | -3% | 0.0165 | $24,045,265 |
| RXL | Rox Resources | 3% | -8% | -41% | -55% | 0.165 | $38,009,623 |
| NAG | Nagambie Resources | 3% | -8% | 55% | 3% | 0.068 | $36,819,122 |
| KWR | Kingwest Resources | 3% | -5% | -64% | -81% | 0.035 | $9,860,439 |
| S2R | S2 Resources | 3% | 13% | 13% | 0% | 0.175 | $60,668,725 |
| GMD | Genesis Minerals | 3% | -7% | -10% | -21% | 1.225 | $525,062,022 |
| FML | Focus Minerals | 3% | -12% | 16% | -31% | 0.18 | $51,580,556 |
| NML | Navarre Minerals | 3% | -21% | -22% | -42% | 0.038 | $54,639,408 |
| TAM | Tanami Gold NL | 3% | -5% | -28% | -42% | 0.038 | $44,653,688 |
| MGV | Musgrave Minerals | 3% | -19% | -30% | -43% | 0.195 | $116,124,590 |
| AGG | AngloGold Ashanti | 2% | 9% | 24% | 6% | 5.69 | $501,347,639 |
| CWX | Carawine Resources | 2% | 9% | -22% | -49% | 0.094 | $18,500,842 |
| TCG | Turaco Gold | 2% | -13% | -18% | -58% | 0.053 | $22,668,983 |
| X64 | Ten Sixty Four | 2% | 1% | -24% | -19% | 0.57 | $130,184,182 |
| AGC | AGC | 2% | -2% | -21% | -30% | 0.064 | $4,334,546 |
| HAV | Havilah Resources | 2% | 5% | 14% | 91% | 0.325 | $102,907,743 |
| MEK | Meeka Metals | 1% | 6% | 35% | 67% | 0.07 | $75,800,234 |
| TBR | Tribune Res | 1% | 28% | 8% | -20% | 4.02 | $210,921,670 |
| NPM | Newpeak Metals | 0% | 0% | 0% | -50% | 0.001 | $9,145,132 |
| ASO | Aston Minerals | 0% | 27% | -10% | -22% | 0.09 | $99,104,253 |
| FFX | Firefinch | 0% | 0% | -11% | -18% | 0.2 | $236,248,644 |
| GED | Golden Deeps | 0% | 0% | -29% | -17% | 0.01 | $11,552,267 |
| DCX | Discovex Res | 0% | 0% | -37% | -30% | 0.003 | $9,907,704 |
| PNX | PNX Metals | 0% | 11% | 25% | -26% | 0.005 | $22,220,289 |
| FAU | First Au | 0% | 0% | -67% | -60% | 0.004 | $3,807,973 |
| GTR | Gti Energy | 0% | -21% | -27% | -54% | 0.011 | $16,560,319 |
| IPT | Impact Minerals | 0% | 0% | -13% | -44% | 0.007 | $17,369,594 |
| PUA | Peak Minerals | 0% | -17% | -55% | -60% | 0.005 | $5,206,854 |
| SIH | Sihayo Gold | 0% | 0% | -20% | -71% | 0.002 | $12,204,256 |
| AWV | Anova Metals | 0% | 0% | 55% | -6% | 0.017 | $27,167,601 |
| MCT | Metalicity | 0% | 17% | 17% | -64% | 0.0035 | $12,222,138 |
| CTO | Citigold Corp | 0% | -14% | 0% | -25% | 0.006 | $17,001,955 |
| TRY | Troy Resources | 0% | 0% | 0% | 0% | 0.0295 | $62,920,961 |
| CGN | Crater Gold Min | 0% | 0% | 0% | 0% | 0.017 | $21,063,474 |
| GUL | Gullewa | 0% | -2% | -12% | -12% | 0.06 | $11,722,386 |
| G50 | Gold50 | 0% | 25% | 43% | -4% | 0.25 | $14,235,750 |
| NAE | New Age Exploration | 0% | 13% | 50% | -10% | 0.009 | $12,923,090 |
| VKA | Viking Mines | 0% | 38% | 83% | -39% | 0.011 | $11,277,843 |
| RMX | Red Mount Min | 0% | 11% | 0% | -38% | 0.005 | $9,941,744 |
| MAU | Magnetic Resources | 0% | 4% | -35% | -48% | 0.8 | $183,609,905 |
| BC8 | Black Cat Syndicate | 0% | -17% | -10% | -41% | 0.315 | $68,780,536 |
| MEU | Marmota | 0% | 0% | -16% | 5% | 0.046 | $49,763,627 |
| RML | Resolution Minerals | 0% | -11% | -11% | -50% | 0.008 | $8,557,970 |
| TBA | Tombola Gold | 0% | 8% | -47% | -7% | 0.027 | $34,403,445 |
| PF1 | Pathfinder Resources | 0% | 0% | 0% | 79% | 0.5 | $28,984,082 |
| GSR | Greenstone Resources | 0% | 16% | -36% | 4% | 0.029 | $31,162,790 |
| SFM | Santa Fe Minerals | 0% | -8% | -24% | -30% | 0.08 | $5,825,503 |
| BGD | Bartongoldholdings | 0% | 11% | 11% | 3% | 0.2 | $17,248,461 |
| RVR | Red River Resources | 0% | 0% | -53% | -59% | 0.073 | $37,847,908 |
| RGL | Riversgold | 0% | -31% | -3% | 78% | 0.029 | $29,309,499 |
| WMC | Wiluna Mining Corp | 0% | 0% | -58% | -76% | 0.205 | $74,238,031 |
| THR | Thor Mining PLC | 0% | -33% | -40% | -54% | 0.006 | $8,653,277 |
| CDR | Codrus Minerals | 0% | 64% | 50% | -14% | 0.12 | $4,851,600 |
| VAN | Vango Mining | 0% | 8% | -5% | -34% | 0.039 | $49,137,568 |
| AVW | Avira Resources | 0% | 0% | -25% | -40% | 0.003 | $6,401,370 |
| LRL | Labyrinth Resources | 0% | 6% | -18% | -50% | 0.018 | $15,912,302 |
| A8G | Australasian Metals | 0% | -6% | 13% | -42% | 0.225 | $9,263,361 |
| NES | Nelson Resources. | 0% | 17% | -40% | -69% | 0.007 | $4,120,160 |
| GNM | Great Northern | 0% | 0% | 0% | -43% | 0.004 | $6,836,204 |
| BTR | Brightstar Resources | 0% | -25% | -21% | -68% | 0.015 | $11,722,061 |
| DEX | Duke Exploration | 0% | 0% | -41% | -67% | 0.053 | $5,587,240 |
| SNG | Siren Gold | 0% | 3% | -33% | -40% | 0.175 | $20,461,958 |
| AYM | Australia United Min | 0% | 0% | 0% | -43% | 0.004 | $7,370,310 |
| GCY | Gascoyne Res | 0% | 0% | -20% | -33% | 0.195 | $83,082,880 |
| GCY | Gascoyne Res | 0% | 0% | -20% | -33% | 0.195 | $83,082,880 |
| CHN | Chalice Mining | -1% | 30% | 62% | -27% | 6.265 | $2,355,620,434 |
| SFR | Sandfire Resources | -1% | 17% | 6% | -13% | 5.37 | $2,535,750,200 |
| CYL | Catalyst Metals | -1% | -12% | -21% | -42% | 1.19 | $117,162,816 |
| KCN | Kingsgate Consolid. | -1% | -15% | 18% | -5% | 1.655 | $370,711,759 |
| KCN | Kingsgate Consolid. | -1% | -15% | 18% | -5% | 1.655 | $370,711,759 |
| RRL | Regis Resources | -1% | 7% | 16% | 11% | 2.015 | $1,562,903,665 |
| WAF | West African Res | -1% | -8% | -8% | -17% | 1.11 | $1,174,589,926 |
| AAJ | Aruma Resources | -1% | -10% | -7% | -1% | 0.066 | $10,673,382 |
| IDA | Indiana Resources | -2% | -11% | -2% | -18% | 0.051 | $25,417,851 |
| MLS | Metals Australia | -2% | 28% | 4% | 25% | 0.05 | $30,351,810 |
| NWM | Norwest Minerals | -2% | -32% | 60% | -31% | 0.048 | $11,105,369 |
| AM7 | Arcadia Minerals | -2% | -11% | 24% | 12% | 0.235 | $10,974,005 |
| AUC | Ausgold | -2% | -4% | 4% | -2% | 0.047 | $95,385,303 |
| MXR | Maximus Resources | -2% | -5% | -15% | -36% | 0.041 | $12,756,231 |
| MKG | Mako Gold | -3% | -11% | -49% | -66% | 0.039 | $18,394,403 |
| CBY | Canterbury Resources | -3% | 0% | -15% | -53% | 0.039 | $5,226,918 |
| MAT | Matsa Resources | -3% | -13% | -9% | -33% | 0.039 | $16,068,180 |
| RED | Red 5 | -3% | -3% | -45% | -35% | 0.18 | $502,707,008 |
| NXM | Nexus Minerals | -3% | -3% | -8% | -69% | 0.175 | $56,954,329 |
| SVG | Savannah Goldfields | -3% | -19% | 9% | -24% | 0.175 | $30,204,727 |
| RND | Rand Mining | -3% | -9% | -4% | -6% | 1.36 | $77,351,307 |
| ENR | Encounter Resources | -3% | -22% | 14% | 14% | 0.16 | $56,884,125 |
| HRN | Horizon Gold | -3% | -3% | -6% | -17% | 0.31 | $40,684,033 |
| ADT | Adriatic Metals | -3% | 2% | 50% | 23% | 3.09 | $693,566,237 |
| MZZ | Matador Mining | -3% | 17% | -13% | -57% | 0.14 | $45,705,571 |
| TG1 | Techgen Metals | -4% | -18% | -34% | -47% | 0.082 | $4,489,414 |
| TLM | Talisman Mining | -4% | 4% | -10% | -10% | 0.135 | $25,344,832 |
| VMC | Venus Metals Cor | -4% | -10% | -13% | -21% | 0.13 | $24,040,622 |
| NST | Northern Star | -4% | 4% | 32% | 18% | 10.51 | $12,589,967,244 |
| BCN | Beacon Minerals | -4% | -7% | -11% | -24% | 0.025 | $93,919,204 |
| SAU | Southern Gold | -4% | -14% | -34% | -54% | 0.025 | $6,666,522 |
| SKY | SKY Metals | -4% | -4% | -29% | -52% | 0.048 | $17,332,040 |
| POL | Polymetals Resources | -4% | 9% | 167% | 71% | 0.24 | $9,883,846 |
| HMX | Hammer Metals | -4% | 8% | 48% | 54% | 0.071 | $59,889,736 |
| SSR | SSR Mining Inc. | -4% | 0% | -19% | -6% | 21.89 | $404,388,367 |
| MOH | Moho Resources | -4% | -4% | -21% | -61% | 0.023 | $4,776,231 |
| DCN | Dacian Gold | -4% | -28% | -32% | -28% | 0.115 | $152,100,117 |
| CDT | Castle Minerals | -4% | 0% | -4% | -8% | 0.023 | $22,988,339 |
| M2R | Miramar | -4% | -9% | -18% | -59% | 0.09 | $6,361,357 |
| IGO | IGO | -4% | -7% | 33% | 34% | 14.24 | $10,844,075,082 |
| AAR | Astral Resources NL | -4% | 8% | -15% | -24% | 0.065 | $43,251,649 |
| NVA | Nova Minerals | -4% | -24% | 16% | -43% | 0.65 | $135,231,521 |
| GWR | GWR Group | -5% | 2% | -35% | -45% | 0.063 | $20,557,866 |
| KRM | Kingsrose Mining | -5% | 7% | 19% | -21% | 0.063 | $47,409,171 |
| TIE | Tietto Minerals | -5% | -2% | 109% | 74% | 0.73 | $798,850,343 |
| NCM | Newcrest Mining | -5% | 4% | -13% | -11% | 20.21 | $18,651,703,115 |
| DTR | Dateline Resources | -5% | -47% | -63% | -54% | 0.039 | $22,042,196 |
| KAL | Kalgoorliegoldmining | -5% | -10% | -10% | -32% | 0.095 | $7,433,722 |
| LM8 | Lunnonmetals | -5% | 18% | 35% | 141% | 0.94 | $103,283,559 |
| ANX | Anax Metals | -5% | 2% | -38% | -37% | 0.056 | $22,926,110 |
| EVN | Evolution Mining | -5% | 3% | -19% | -27% | 2.75 | $5,229,796,509 |
| LCY | Legacy Iron Ore | -5% | 13% | -5% | -18% | 0.018 | $115,322,872 |
| TGM | Theta Gold Mines | -5% | -8% | -13% | -55% | 0.07 | $43,949,644 |
| BBX | BBX Minerals | -5% | -27% | -43% | -57% | 0.069 | $33,583,782 |
| PRU | Perseus Mining | -6% | -3% | 21% | 41% | 2.145 | $3,008,418,849 |
| AME | Alto Metals | -6% | -4% | -13% | -34% | 0.066 | $40,519,087 |
| TSO | Tesoro Gold | -6% | -10% | -39% | -57% | 0.033 | $36,332,315 |
| OKR | Okapi Resources | -6% | -15% | -23% | -50% | 0.165 | $24,310,852 |
| CEL | Challenger Exp | -6% | 0% | -20% | -40% | 0.165 | $177,634,913 |
| MI6 | Minerals260 | -6% | 17% | 35% | -17% | 0.405 | $92,400,000 |
| HCH | Hot Chili | -6% | -3% | -4% | -50% | 0.885 | $102,125,651 |
| HXG | Hexagon Energy | -6% | 7% | -33% | -77% | 0.016 | $8,206,654 |
| CPM | Coopermetals | -6% | -18% | -32% | 38% | 0.235 | $9,434,600 |
| CAZ | Cazaly Resources | -6% | 3% | -14% | -28% | 0.031 | $11,526,476 |
| BGL | Bellevue Gold | -6% | 21% | 36% | 30% | 1.08 | $1,231,707,286 |
| ARL | Ardea Resources | -6% | -9% | -4% | 76% | 0.845 | $144,062,328 |
| GSM | Golden State Mining | -6% | 0% | -2% | -45% | 0.046 | $5,382,653 |
| DTM | Dart Mining NL | -6% | -9% | 5% | -24% | 0.061 | $9,470,870 |
| ADN | Andromeda Metals | -6% | -8% | -32% | -74% | 0.045 | $139,950,379 |
| EM2 | Eagle Mountain | -6% | -17% | -47% | -71% | 0.15 | $42,967,032 |
| VRC | Volt Resources | -6% | -12% | -12% | -38% | 0.015 | $54,311,934 |
| GBR | Greatbould Resources | -6% | -10% | 24% | -35% | 0.088 | $37,102,452 |
| PGO | Pacgold | -6% | -25% | -40% | -24% | 0.365 | $20,061,062 |
| WCN | White Cliff Min | -7% | -22% | -7% | -7% | 0.014 | $9,792,707 |
| XAM | Xanadu Mines | -7% | 4% | 22% | -3% | 0.028 | $39,543,286 |
| AXE | Archer Materials | -7% | -5% | 10% | -42% | 0.625 | $155,604,504 |
| SMI | Santana Minerals | -7% | 8% | 12% | 123% | 0.67 | $106,375,983 |
| SVL | Silver Mines | -7% | 3% | 21% | 3% | 0.2 | $264,825,589 |
| SPQ | Superior Resources | -7% | 0% | 51% | 141% | 0.053 | $98,670,784 |
| AMI | Aurelia Metals | -7% | 8% | -54% | -68% | 0.13 | $167,054,024 |
| ADG | Adelong Gold | -7% | -19% | -78% | -84% | 0.0065 | $2,880,715 |
| FEG | Far East Gold | -7% | -17% | 75% | 0% | 0.515 | $66,280,310 |
| KSN | Kingston Resources | -7% | -4% | -5% | -45% | 0.09 | $37,824,483 |
| BYH | Bryah Resources | -7% | 0% | -19% | -51% | 0.025 | $7,031,337 |
| DEG | De Grey Mining | -8% | -10% | 23% | 2% | 1.17 | $1,896,817,802 |
| GAL | Galileo Mining | -8% | -27% | -47% | 307% | 0.855 | $176,874,310 |
| WGX | Westgold Resources. | -8% | -18% | -40% | -62% | 0.73 | $355,217,048 |
| HAW | Hawthorn Resources | -8% | 40% | 33% | 36% | 0.12 | $40,021,874 |
| MRZ | Mont Royal Resources | -8% | -8% | -40% | -51% | 0.175 | $11,984,467 |
| AAU | Antilles Gold | -8% | -20% | -53% | -50% | 0.035 | $14,875,510 |
| ALK | Alkane Resources | -8% | -14% | -33% | -29% | 0.58 | $353,287,629 |
| G88 | Golden Mile Res | -8% | -4% | -46% | -56% | 0.022 | $4,500,975 |
| PRX | Prodigy Gold NL | -8% | -8% | -18% | -63% | 0.011 | $19,226,711 |
| MHC | Manhattan Corp | -8% | -8% | -39% | -54% | 0.0055 | $7,631,393 |
| BNZ | Benzmining | -9% | -15% | -17% | -28% | 0.43 | $30,650,074 |
| KNB | Koonenberrygold | -9% | 1% | -18% | -56% | 0.075 | $5,681,733 |
| AZS | Azure Minerals | -9% | -19% | -24% | -35% | 0.21 | $68,690,134 |
| YRL | Yandal Resources | -9% | -13% | -47% | -74% | 0.1 | $15,780,308 |
| GMR | Golden Rim Resources | -9% | -17% | -49% | -70% | 0.03 | $9,417,402 |
| AUT | Auteco Minerals | -9% | -17% | 14% | -28% | 0.05 | $103,391,815 |
| HRZ | Horizon | -9% | -12% | -43% | -48% | 0.06 | $38,616,465 |
| KTA | Krakatoa Resources | -9% | -18% | -9% | 2% | 0.05 | $17,235,496 |
| GOR | Gold Road Res | -9% | -3% | 36% | 10% | 1.6175 | $1,796,806,938 |
| PKO | Peako | -10% | -7% | -7% | -33% | 0.014 | $5,309,014 |
| CMM | Capricorn Metals | -10% | 2% | 27% | 38% | 4.38 | $1,701,061,615 |
| IVR | Investigator Res | -10% | -20% | -2% | -31% | 0.045 | $61,509,528 |
| GMN | Gold Mountain | -10% | -10% | 50% | -40% | 0.009 | $14,203,343 |
| STN | Saturn Metals | -10% | -5% | -48% | -55% | 0.18 | $25,330,340 |
| CLZ | Classic Min | -10% | -25% | -94% | -94% | 0.009 | $7,188,805 |
| KCC | Kincora Copper | -10% | -11% | -11% | -44% | 0.062 | $4,981,806 |
| RMS | Ramelius Resources | -10% | 4% | -18% | -39% | 0.885 | $802,512,587 |
| MOM | Moab Minerals | -11% | -15% | -69% | -69% | 0.0085 | $5,796,690 |
| LCL | Los Cerros | -11% | 40% | 0% | -63% | 0.042 | $31,491,405 |
| KIN | KIN Min NL | -11% | -15% | -16% | -36% | 0.067 | $71,299,463 |
| STK | Strickland Metals | -11% | -5% | -25% | -37% | 0.041 | $57,476,080 |
| AVM | Advance Metals | -11% | -33% | -27% | -53% | 0.008 | $5,800,441 |
| RDS | Redstone Resources | -11% | 33% | 33% | -38% | 0.008 | $5,894,659 |
| SBRDA | Sabre Resources | -11% | 0% | -20% | -20% | 0.04 | $11,659,424 |
| E2M | E2 Metals | -11% | 19% | 14% | -41% | 0.16 | $33,852,495 |
| KAU | Kaiser Reef | -11% | -11% | -6% | -14% | 0.155 | $20,189,860 |
| KAI | Kairos Minerals | -12% | -26% | 15% | -12% | 0.023 | $45,174,150 |
| ALY | Alchemy Resource | -12% | -21% | 35% | 109% | 0.023 | $27,095,754 |
| SLR | Silver Lake Resource | -12% | -5% | -20% | -26% | 1.185 | $1,162,180,416 |
| BEZ | Besragoldinc | -12% | 34% | -9% | -53% | 0.053 | $13,362,028 |
| BNR | Bulletin Res | -12% | -34% | -23% | 30% | 0.092 | $27,503,563 |
| TMX | Terrain Minerals | -13% | 8% | -13% | -13% | 0.007 | $5,405,327 |
| EMU | EMU NL | -13% | 27% | -30% | -61% | 0.007 | $4,810,877 |
| RDT | Red Dirt Metals | -14% | -29% | 8% | -31% | 0.415 | $172,692,217 |
| A1G | African Gold . | -14% | -2% | 5% | -45% | 0.082 | $12,278,216 |
| QML | Qmines | -14% | -34% | -24% | -52% | 0.155 | $13,531,355 |
| LEX | Lefroy Exploration | -14% | -11% | -9% | -21% | 0.24 | $36,468,667 |
| MTH | Mithril Resources | -14% | -40% | -40% | -80% | 0.003 | $9,789,271 |
| TMZ | Thomson Res | -14% | -5% | -31% | -70% | 0.018 | $14,729,119 |
| RSG | Resolute Mining | -14% | -3% | -16% | -44% | 0.18 | $404,501,665 |
| SVY | Stavely Minerals | -15% | 9% | -40% | -65% | 0.175 | $59,746,611 |
| PDI | Predictive Disc | -15% | -13% | -8% | -22% | 0.175 | $322,002,431 |
| PRS | Prospech | -15% | -31% | -19% | -61% | 0.029 | $2,648,958 |
| MM8 | Medallion Metals. | -15% | -19% | -43% | -30% | 0.145 | $20,993,259 |
| LYN | Lycaonresources | -15% | -29% | -15% | -17% | 0.29 | $10,040,219 |
| NMR | Native Mineral Res | -15% | -44% | -21% | -50% | 0.115 | $13,299,733 |
| ARN | Aldoro Resources | -15% | -40% | 59% | -39% | 0.23 | $25,969,833 |
| REZ | Resourc & En Grp | -16% | -11% | -36% | -68% | 0.016 | $7,996,893 |
| OBM | Ora Banda Mining | -17% | -25% | 176% | 18% | 0.069 | $94,929,664 |
| GSN | Great Southern | -18% | -31% | -18% | -43% | 0.033 | $19,150,838 |
| M24 | Mamba Exploration | -18% | 8% | 69% | -33% | 0.135 | $5,693,625 |
| ICL | Iceni Gold | -18% | 61% | -11% | -48% | 0.098 | $12,563,250 |
| MRR | Minrex Resources | -18% | -31% | -6% | -18% | 0.031 | $33,630,893 |
| TTM | Titan Minerals | -19% | -21% | 14% | -20% | 0.079 | $131,248,406 |
| BMO | Bastion Minerals | -20% | -30% | -70% | -80% | 0.044 | $4,616,330 |
| CY5 | Cygnus Gold | -20% | -26% | 129% | 117% | 0.39 | $70,419,267 |
| PNR | Pantoro | -22% | -30% | -53% | -72% | 0.098 | $177,882,057 |
| AQI | Alicanto Min | -22% | -20% | -13% | -59% | 0.047 | $22,680,394 |
| AL8 | Alderan Resource | -22% | 0% | -53% | -80% | 0.007 | $4,047,863 |
| CXU | Cauldron Energy | -22% | -28% | -20% | -71% | 0.007 | $4,890,732 |
| ICG | Inca Minerals | -22% | -22% | -77% | -79% | 0.021 | $11,816,946 |
| TUL | Tulla Resources | -23% | -22% | -37% | -41% | 0.305 | $61,180,784 |
| RDN | Raiden Resources | -23% | -41% | -44% | -76% | 0.005 | $8,272,912 |
| BAT | Battery Minerals | -25% | -25% | -40% | -79% | 0.003 | $11,700,969 |
| SXG | Southern Cross Gold | -25% | 2% | 25% | 0% | 0.635 | $57,009,275 |
| TAR | Taruga Minerals | -26% | -18% | 47% | -26% | 0.028 | $18,845,759 |
| CST | Castile Resources | -27% | -18% | -43% | -48% | 0.099 | $23,948,340 |
| WRM | White Rock Min | -32% | -33% | -52% | -73% | 0.063 | $13,610,975 |
| CAI | Calidus Resources | -33% | -43% | -64% | -60% | 0.235 | $111,672,585 |
| MKR | Manuka Resources. | -37% | -49% | -59% | -74% | 0.082 | $37,962,611 |
Weekly Small Cap Standouts
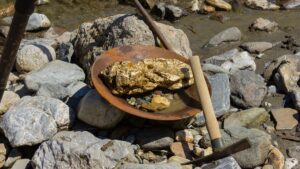
PEREGRINE GOLD (ASX:PGD)
It’s early days, but PGD appears to be into something very interesting at its Newman gold project in WA.
Yesterday, it announced that a rock sampling program has returned grades of up to 122,497g/t gold and 23,234g/t silver at Birdsnest, part of PGD Newman project in WA.
Yep, you read right. That’s equivalent to 120kg of gold for every tonne of dirt moved.
This style of mineralisation requires “precise surgical diamond drilling to resolve continuity in 3D or down plunge”, technical director George Merhi says.
It’s the latest in a string of impressive gold hits at Newman, which include this spectacular chunk in drill core at its Peninsula prospect:
Diamond drilling at both Birdsnest and Peninsula will start in Q1 2023.
ORA GOLD (ASX:OAU)
OAU also dropped some solid results this week, boasting (among other highlights) a return of 7m @ 15.75g/t Au from 30m incl. 6m @ 38.06g/t Au from 41m.
That’s thick, shallow, and high grade.
Later in the day, the company released a correction which usually signals that something’s been overstated.
But, in OAU’s case the typo in the original release downplayed the above result – it was meant to be 17m @ 15.75g/t.
Related Topics

Related Stories

UNLOCK INSIGHTS
Discover the untold stories of emerging ASX stocks.
Daily news and expert analysis, it's free to subscribe.
By proceeding, you confirm you understand that we handle personal information in accordance with our Privacy Policy.


