Pic: Via Getty
Gold Digger: ‘A panic move into gold’ is coming, veteran investor Doug Casey says
Mining
Pic: Via Getty
Mining
Our Gold Digger column wraps all the news driving ASX stocks with exposure to precious metals.
A panic move into gold stocks is imminent, according to author and veteran investor Doug Casey, who says the flow of money will be like “trying to get the contents of Hoover Dam through a garden hose”.
In a recent chat with Kerry Stevenson of the Gold News Channel Casey said gold equities, relative to other stocks, “are about the cheapest level they have been at in history”.
“Why do I like them? Because all in sustaining costs amongst worldwide producers are roughly $US1,000/oz ($1,360/oz),” he says.
“They are printing money [at current prices] but fund managers don’t care.
“That is going to change. I am heavy in gold stocks right now. Now is the time to buy.”
Central banks around the world are printing money like it going out of style, Casey says, which is driving up inflation.
Gold is widely regarded as a hedge against inflation, increasing in value as the purchasing power of money falls.
“The US government officially states that inflation is running at 7.8%, or some ridiculous number. Point of fact: retail prices in the US are rising well over 15%, on their way to 20% and even more,” Casey says.
“I think there is going to be a panic into gold.
“It is going to be fear, greed and oddly, prudence, which is going to drive a lot of money into gold stocks.
“[Gold equities] are just a tiny portion of the market, so when money really starts flowing it is going to be like trying to get the contents of Hoover Dam through a garden hose.
“Potentially explosive on the upside.”
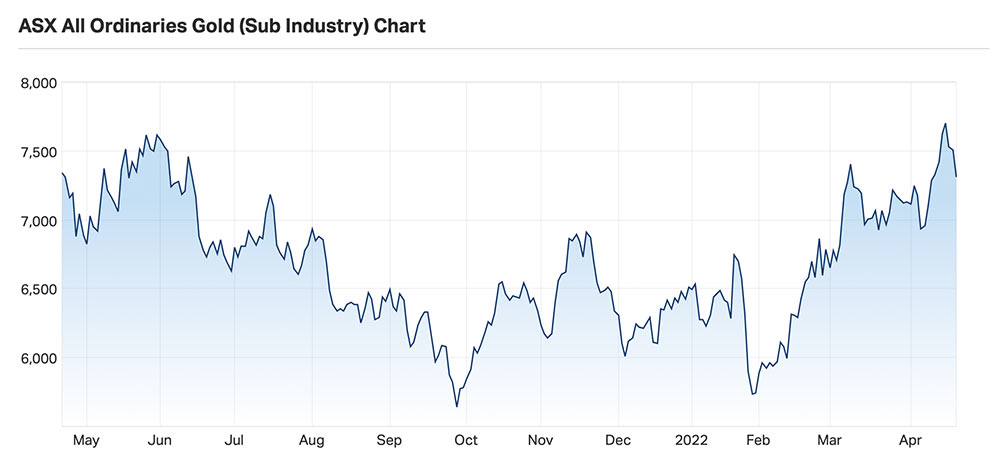
On 14 April, the ASX All Ordinaries Gold index peaked at 7,620 points – its highest level since November 2020.
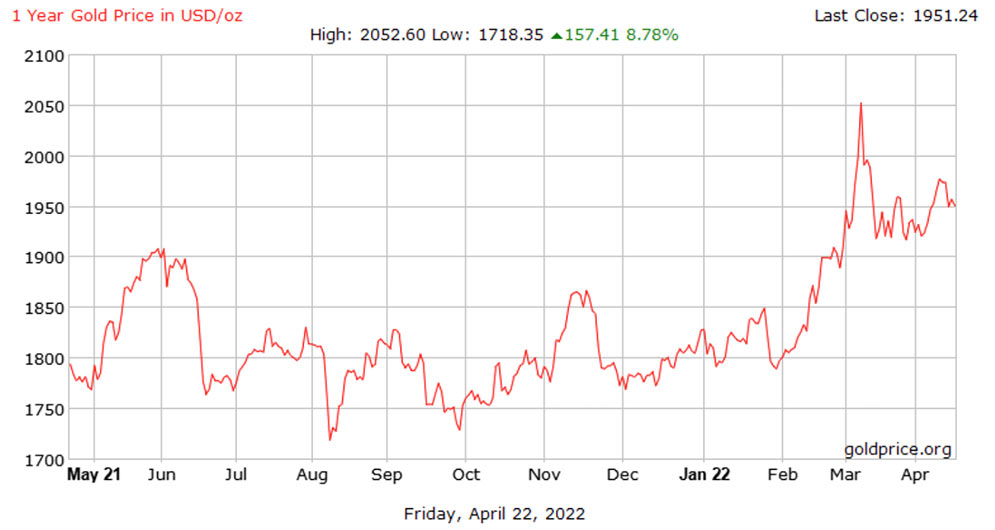
This coincided with a gold price spike to $US1,980.
The index – a benchmark for Australian gold companies – is currently up ~27% on its late January lows.
Gold price movements continue to confuse, senior market analyst at OANDA Jeffrey Halley said Friday afternoon.
“Overnight it retreated intraday to test support at $US1940 an ounce, but as US yields and the US Dollar rallied, it also reclaimed its intraday losses, finishing just 0.30% lower at $US1951.50 an ounce.
“It is unchanged in Asia.
“Either gold markets are walking into a huge bullish trap as the US Dollar and US yields continue to power higher, or gold markets are warning us that inflation is more entrenched than expected, or that the world is much more dangerous than markets are believing.”
Any of these scenarios could prove correct, Halley says.
“That said, from a technical perspective, gold still looks vulnerable to a failure of the $US1940 support which could see more speculative long positions getting culled,” he says.
“Gold would potentially target $US1915 an ounce and then critical support at $US1880.”
On the upside, gold has resistance at $US1980 and $US2000 an ounce, Halley says.
“I believe option-related selling at $US2000 will be a strong barrier. However, if $US2000 fails, gold could quickly gap higher to $US2020, and potentially, retest of $US2080 an ounce.”
Here’s how ASX-listed gold & silver stocks are performing:
Scroll or swipe to reveal table. Click headings to sort. Best viewed on a laptop
> Stocks missing from this list? Email [email protected]
| CODE | COMPANY | 1 WEEK RETURN % | 1 MONTH RETURN % | 6 MONTH RETURN % | 1 YEAR RETURN % | PRICE | MARKET CAP |
|---|---|---|---|---|---|---|---|
| OZM | Ozaurum Resources | 57% | 55% | 3% | -11% | 0.155 | $10,871,040.00 |
| ALY | Alchemy Resource Ltd | 56% | 115% | 100% | 68% | 0.028 | $18,094,552.91 |
| MCT | Metalicity Limited | 33% | 33% | -20% | -43% | 0.008 | $20,444,208.05 |
| SMI | Santana Minerals Ltd | 33% | 37% | 204% | 485% | 0.76 | $96,825,220.24 |
| SRN | Surefire Rescs NL | 30% | 100% | 79% | 0% | 0.026 | $25,988,686.91 |
| XAM | Xanadu Mines Ltd | 29% | 24% | 20% | -51% | 0.036 | $45,837,367.74 |
| ICL | Iceni Gold | 27% | 22% | -48% | -40% | 0.14 | $19,870,446.34 |
| HAW | Hawthorn Resources | 25% | 111% | 219% | 185% | 0.1625 | $56,697,654.21 |
| BRV | Big River Gold Ltd | 23% | 11% | 57% | -17% | 0.345 | $76,026,102.68 |
| TMX | Terrain Minerals | 22% | 57% | 38% | 0% | 0.011 | $8,093,371.10 |
| VAN | Vango Mining Ltd | 20% | 57% | -14% | -29% | 0.055 | $68,036,632.13 |
| MOH | Moho Resources | 18% | 20% | 3% | -16% | 0.065 | $8,328,236.42 |
| YRL | Yandal Resources | 17% | 19% | -38% | -38% | 0.28 | $33,086,092.61 |
| TBA | Tombola Gold Ltd | 16% | 58% | 33% | 12% | 0.057 | $47,571,231.23 |
| BMO | Bastion Minerals | 15% | 18% | -26% | -7% | 0.195 | $12,528,327.90 |
| AQX | Alice Queen Ltd | 14% | 0% | -20% | -60% | 0.008 | $12,262,784.08 |
| VKA | Viking Mines Ltd | 14% | 14% | -40% | -66% | 0.0125 | $13,328,359.60 |
| ANX | Anax Metals Ltd | 14% | 51% | 25% | 64% | 0.125 | $50,053,520.00 |
| SKY | SKY Metals Ltd | 13% | 18% | 0% | -34% | 0.105 | $39,562,264.35 |
| TSC | Twenty Seven Co. Ltd | 13% | 50% | -10% | -25% | 0.0045 | $10,643,255.62 |
| CPM | Coopermetalslimited | 13% | 17% | 0% | 0% | 0.45 | $12,159,000.00 |
| KTA | Krakatoa Resources | 13% | 176% | 129% | 125% | 0.135 | $38,312,289.21 |
| PRS | Prospech Limited | 12% | 15% | -27% | -54% | 0.055 | $3,193,869.25 |
| TRN | Torrens Mining | 12% | 4% | -18% | 0% | 0.14 | $10,637,240.70 |
| PKO | Peako Limited | 12% | 19% | -17% | -46% | 0.019 | $5,552,173.82 |
| LRL | Labyrinth Resources | 11% | 20% | 44% | -13% | 0.049 | $42,794,971.00 |
| ZNC | Zenith Minerals Ltd | 11% | 39% | 71% | 102% | 0.445 | $154,756,869.75 |
| AM7 | Arcadia Minerals | 11% | 30% | 36% | 0% | 0.3 | $10,497,750.00 |
| PUR | Pursuit Minerals | 10% | 60% | -3% | -58% | 0.032 | $31,203,123.40 |
| GWR | GWR Group Ltd | 10% | 11% | 6% | -45% | 0.17 | $54,606,831.35 |
| PRX | Prodigy Gold NL | 10% | -12% | -34% | -49% | 0.023 | $13,400,434.94 |
| AME | Alto Metals Limited | 10% | -4% | -12% | -6% | 0.092 | $48,579,451.10 |
| LNY | Laneway Res Ltd | 9% | 9% | 25% | 4% | 0.006 | $36,521,672.20 |
| VRC | Volt Resources Ltd | 8% | 117% | -13% | 24% | 0.026 | $80,242,673.06 |
| GML | Gateway Mining | 8% | 8% | -28% | -55% | 0.013 | $29,381,382.77 |
| NML | Navarre Minerals Ltd | 8% | -4% | -3% | -31% | 0.093 | $122,820,493.68 |
| MDI | Middle Island Res | 8% | 12% | 27% | 0% | 0.14 | $18,362,733.30 |
| BNZ | Benzmining | 8% | 15% | -1% | -9% | 0.71 | $35,018,311.07 |
| SPQ | Superior Resources | 8% | -17% | 231% | 258% | 0.043 | $68,048,816.72 |
| TNR | Torian Resources Ltd | 7% | 12% | -2% | -37% | 0.029 | $37,519,322.96 |
| M24 | Mamba Exploration | 7% | -6% | -28% | -43% | 0.145 | $5,904,500.42 |
| IPT | Impact Minerals | 7% | 36% | 0% | -17% | 0.015 | $35,047,385.38 |
| GRL | Godolphin Resources | 7% | 7% | 0% | -25% | 0.15 | $12,616,705.65 |
| ADV | Ardiden Ltd | 7% | 25% | 36% | -6% | 0.015 | $37,248,992.98 |
| KZR | Kalamazoo Resources | 7% | 57% | 12% | 5% | 0.455 | $64,611,496.43 |
| AGC | AGC Ltd | 7% | 8% | -22% | -43% | 0.097 | $6,569,546.55 |
| AGC | AGC Ltd | 7% | 8% | -22% | -43% | 0.097 | $6,569,546.55 |
| GUL | Gullewa Limited | 7% | 19% | 0% | -9% | 0.081 | $15,420,221.10 |
| CST | Castile Resources | 6% | 0% | -35% | -28% | 0.17 | $33,950,720.57 |
| MEI | Meteoric Resources | 6% | 21% | -32% | -69% | 0.017 | $25,947,055.31 |
| CY5 | Cygnus Gold Limited | 6% | 0% | 26% | 6% | 0.17 | $20,057,503.55 |
| OKU | Oklo Resources Ltd | 6% | 9% | -28% | -34% | 0.094 | $47,422,669.03 |
| GED | Golden Deeps | 6% | 90% | 58% | 58% | 0.019 | $23,103,186.92 |
| M2R | Miramar | 5% | 15% | 8% | -15% | 0.195 | $9,713,928.90 |
| ARN | Aldoro Resources | 5% | -9% | -31% | -20% | 0.295 | $26,554,008.76 |
| AWJ | Auric Mining | 5% | -3% | -39% | -52% | 0.086 | $4,821,964.70 |
| GIB | Gibb River Diamonds | 5% | 14% | -22% | -4% | 0.065 | $13,748,113.93 |
| BNR | Bulletin Res Ltd | 5% | 48% | 203% | 251% | 0.23 | $62,368,486.56 |
| BBX | BBX Minerals Ltd | 4% | -19% | -34% | -48% | 0.125 | $57,502,684.38 |
| PGD | Peregrine Gold | 4% | 9% | 11% | 85% | 0.5 | $19,526,201.19 |
| CLA | Celsius Resource Ltd | 4% | 4% | -10% | -38% | 0.026 | $31,758,109.97 |
| MZZ | Matador Mining Ltd | 4% | -4% | -35% | -18% | 0.265 | $58,595,266.35 |
| NAE | New Age Exploration | 4% | 17% | 27% | -30% | 0.014 | $20,102,584.74 |
| GSN | Great Southern | 4% | 18% | -22% | 2% | 0.059 | $31,942,025.16 |
| TAM | Tanami Gold NL | 3% | 7% | -15% | -16% | 0.062 | $72,856,016.85 |
| ENR | Encounter Resources | 3% | 3% | -20% | 11% | 0.16 | $50,690,692.16 |
| STK | Strickland Metals | 3% | 27% | -25% | 230% | 0.066 | $85,749,246.50 |
| AGS | Alliance Resources | 3% | -3% | -6% | 5% | 0.175 | $40,953,448.03 |
| TLM | Talisman Mining | 3% | 0% | 24% | 24% | 0.18 | $33,793,109.46 |
| HRN | Horizon Gold Ltd | 2% | -1% | 0% | 5% | 0.43 | $45,344,106.80 |
| MVL | Marvel Gold Limited | 2% | 2% | -29% | -3% | 0.046 | $32,398,691.02 |
| MEU | Marmota Limited | 2% | 12% | 9% | 9% | 0.048 | $47,043,903.17 |
| SAU | Southern Gold | 2% | -7% | -25% | -45% | 0.051 | $10,879,766.56 |
| BYH | Bryah Resources Ltd | 2% | 19% | 2% | -19% | 0.057 | $13,120,016.15 |
| NSM | Northstaw | 2% | 0% | -12% | -23% | 0.29 | $11,436,195.00 |
| ASO | Aston Minerals Ltd | 2% | 2% | 13% | 37% | 0.1575 | $169,657,639.79 |
| AAU | Antilles Gold Ltd | 2% | -7% | -12% | -24% | 0.067 | $23,678,132.39 |
| BGL | Bellevue Gold Ltd | 2% | 6% | 19% | 2% | 1.015 | $1,021,061,355.93 |
| MAT | Matsa Resources | 1% | 11% | 15% | -15% | 0.07 | $25,485,778.02 |
| SNG | Siren Gold | 1% | 48% | 8% | 15% | 0.415 | $34,198,168.82 |
| MKG | Mako Gold | 1% | -1% | -13% | -2% | 0.089 | $32,490,536.17 |
| KNB | Koonenberrygold | 1% | -2% | -42% | 0% | 0.096 | $7,379,935.40 |
| EMR | Emerald Res NL | 1% | 17% | 23% | 43% | 1.24 | $706,604,367.50 |
| RND | Rand Mining Ltd | 1% | 0% | -2% | -1% | 1.58 | $89,864,018.38 |
| MAU | Magnetic Resources | 0% | -1% | -10% | -10% | 1.44 | $323,053,659.36 |
| NPM | Newpeak Metals | 0% | 0% | -50% | -50% | 0.001 | $8,849,750.03 |
| DCX | Discovex Res Ltd | 0% | -11% | 60% | 14% | 0.008 | $20,549,312.61 |
| FAU | First Au Ltd | 0% | 67% | 36% | -6% | 0.015 | $12,133,664.24 |
| SMS | Starmineralslimited | 0% | 0% | 0% | 0% | 0.2 | $5,250,000.00 |
| CWX | Carawine Resources | 0% | 0% | -2% | -16% | 0.21 | $28,945,212.87 |
| LEX | Lefroy Exploration | 0% | 0% | -25% | -74% | 0.33 | $49,597,387.12 |
| AWV | Anova Metals Ltd | 0% | -13% | -43% | -43% | 0.013 | $19,475,224.60 |
| PAK | Pacific American Hld | 0% | 13% | 0% | -17% | 0.017 | $8,123,915.83 |
| MHC | Manhattan Corp Ltd | 0% | 0% | 17% | 0% | 0.014 | $22,894,180.40 |
| TRY | Troy Resources Ltd | 0% | 0% | 0% | -48% | 0.037 | $31,631,563.33 |
| KGM | Kalnorth Gold Ltd | 0% | 0% | 0% | 0% | 0.013 | $11,625,120.78 |
| CGN | Crater Gold Min Ltd | 0% | 0% | 0% | -6% | 0.017 | $21,063,473.65 |
| G50 | Gold50Limited | 0% | 0% | 4% | 0% | 0.25 | $14,004,500.25 |
| VMC | Venus Metals Cor Ltd | 0% | 14% | 8% | 5% | 0.2 | $30,215,736.60 |
| DDD | 3D Resources Limited | 0% | 0% | -13% | -30% | 0.0035 | $14,631,302.32 |
| RMX | Red Mount Min Ltd | 0% | 13% | 0% | -18% | 0.009 | $15,602,456.65 |
| XTC | Xantippe Res Ltd | 0% | 133% | 367% | 600% | 0.014 | $107,242,857.69 |
| TTM | Titan Minerals | 0% | 5% | -20% | 0% | 0.1 | $140,972,053.30 |
| BCN | Beacon Minerals | 0% | -3% | 6% | 3% | 0.035 | $131,085,175.00 |
| WWI | West Wits Mining Ltd | 0% | -6% | -22% | -61% | 0.033 | $64,338,136.14 |
| GMN | Gold Mountain Ltd | 0% | -11% | -60% | -80% | 0.008 | $9,545,193.36 |
| HMG | Hamelingoldlimited | 0% | 3% | 0% | 0% | 0.16 | $17,050,000.00 |
| HMG | Hamelingoldlimited | 0% | 3% | 0% | 0% | 0.16 | $17,050,000.00 |
| PF1 | Pathfinder Resources | 0% | 27% | 39% | 100% | 0.5 | $26,560,505.00 |
| TCG | Turaco Gold Limited | 0% | -9% | -25% | 62% | 0.105 | $44,910,250.25 |
| GBZ | GBM Rsources Ltd | 0% | 0% | -14% | 0% | 0.12 | $62,042,452.20 |
| SFM | Santa Fe Minerals | 0% | -25% | 50% | 20% | 0.12 | $8,010,066.79 |
| SI6 | SI6 Metals Limited | 0% | 0% | -17% | -33% | 0.01 | $14,281,439.85 |
| BGD | Bartongoldholdings | 0% | -6% | 39% | 0% | 0.25 | $21,459,999.00 |
| KWR | Kingwest Resources | 0% | 13% | 40% | 40% | 0.175 | $43,735,144.50 |
| THR | Thor Mining PLC | 0% | 14% | -16% | 14% | 0.016 | $16,222,261.30 |
| BAT | Battery Minerals Ltd | 0% | -10% | -36% | -50% | 0.009 | $21,127,181.14 |
| NAG | Nagambie Resources | 0% | -11% | -33% | -36% | 0.05 | $25,657,307.90 |
| HRZ | Horizon | 0% | 14% | -4% | 4% | 0.125 | $73,836,776.00 |
| CAI | Calidus Resources | 0% | 9% | 70% | 143% | 1.02 | $402,297,008.00 |
| CXU | Cauldron Energy Ltd | 0% | 6% | -39% | -56% | 0.017 | $8,031,169.16 |
| AVW | Avira Resources Ltd | 0% | 0% | -14% | -14% | 0.006 | $12,712,740.00 |
| BDC | Bardoc Gold Ltd | 0% | -5% | 42% | 22% | 0.52 | $154,075,451.40 |
| TG1 | Techgen Metals Ltd | 0% | 22% | -33% | -48% | 0.14 | $6,095,903.24 |
| GNM | Great Northern | 0% | 20% | -25% | -40% | 0.006 | $10,254,305.86 |
| DEX | Duke Exploration | 0% | -14% | -23% | -56% | 0.155 | $13,982,728.56 |
| DLC | Delecta Limited | 0% | 0% | -21% | 57% | 0.011 | $13,253,995.76 |
| AZS | Azure Minerals | 0% | -1% | -8% | 6% | 0.35 | $107,203,823.75 |
| ANL | Amani Gold Ltd | 0% | 0% | -33% | 100% | 0.002 | $46,586,882.25 |
| MEK | Meeka Gold Limited | 0% | 0% | -4% | -6% | 0.048 | $46,019,263.25 |
| RMS | Ramelius Resources | 0% | -1% | -2% | -14% | 1.5025 | $1,318,425,365.68 |
| NCM | Newcrest Mining | 0% | 12% | 13% | 1% | 28.28 | $25,721,949,513.60 |
| CYL | Catalyst Metals | -1% | -7% | -12% | -18% | 1.85 | $186,081,741.72 |
| TIE | Tietto Minerals | -1% | -10% | 20% | 82% | 0.52 | $423,422,064.42 |
| AQI | Alicanto Min Ltd | -1% | 2% | -29% | -6% | 0.099 | $38,271,361.70 |
| DRE | Dreadnought Resources Ltd | -1% | 9% | 12% | 129% | 0.0435 | $124,902,076.24 |
| TBR | Tribune Res Ltd | -1% | 7% | -8% | -10% | 4.87 | $256,568,896.53 |
| PDI | Predictive Disc Ltd | -1% | -6% | 13% | 123% | 0.2025 | $288,655,148.04 |
| ARL | Ardea Resources Ltd | -1% | 53% | 277% | 284% | 1.85 | $318,731,011.36 |
| RGL | Riversgold | -1% | 127% | 240% | 57% | 0.074 | $38,434,804.63 |
| MRR | Minrex Resources Ltd | -1% | 24% | 306% | 217% | 0.073 | $64,846,871.50 |
| AMI | Aurelia Metals Ltd | -2% | 1% | 23% | 5% | 0.4725 | $593,787,099.36 |
| PNR | Pantoro Limited | -2% | 3% | 50% | 50% | 0.315 | $496,083,937.23 |
| MKR | Manuka Resources. | -2% | 4% | -25% | -30% | 0.295 | $34,856,530.94 |
| QML | Qmines Limited | -2% | 14% | -30% | 0% | 0.28 | $19,291,286.91 |
| MM8 | Medallion Metals. | -2% | 12% | 28% | 4% | 0.275 | $29,691,103.68 |
| MXR | Maximus Resources | -2% | 31% | -4% | -14% | 0.0825 | $26,068,272.98 |
| CDT | Castle Minerals | -2% | -4% | 218% | 350% | 0.054 | $55,971,607.10 |
| OBM | Ora Banda Mining Ltd | -2% | 0% | -45% | -79% | 0.049 | $70,073,352.45 |
| RVR | Red River Resources | -2% | 4% | 9% | 12% | 0.24 | $132,208,444.44 |
| GBR | Greatbould Resources | -2% | -27% | -37% | 224% | 0.12 | $50,624,660.76 |
| REZ | Resourc & En Grp Ltd | -2% | 15% | -6% | 21% | 0.046 | $22,991,066.29 |
| AXE | Archer Materials | -2% | -4% | -41% | 2% | 0.89 | $226,798,494.41 |
| OGC | OceanaGold Corp. | -2% | 15% | 39% | 48% | 3.44 | $248,897,141.58 |
| WRM | White Rock Min Ltd | -2% | 0% | -41% | -63% | 0.205 | $32,326,478.91 |
| HCH | Hot Chili Ltd | -2% | 22% | -33% | -23% | 1.58 | $177,762,345.95 |
| AUT | Auteco Minerals | -3% | 7% | -3% | -17% | 0.078 | $157,114,964.77 |
| GCY | Gascoyne Res Ltd | -3% | -15% | -25% | -47% | 0.2925 | $124,015,233.49 |
| GCY | Gascoyne Res Ltd | -3% | -15% | -25% | -47% | 0.2925 | $124,015,233.49 |
| GSR | Greenstone Resources | -3% | -10% | 30% | 75% | 0.035 | $32,075,879.12 |
| NXM | Nexus Minerals Ltd | -3% | -16% | -24% | 282% | 0.34 | $101,386,435.85 |
| A8G | Australasian Metals | -3% | 2% | -32% | 0% | 0.5 | $20,286,099.47 |
| CEL | Challenger Exp Ltd | -3% | 0% | 20% | 6% | 0.33 | $334,618,369.34 |
| PRU | Perseus Mining Ltd | -3% | 1% | 17% | 49% | 1.93 | $2,437,285,182.83 |
| ADT | Adriatic Metals | -3% | 14% | -10% | 13% | 2.52 | $542,108,515.00 |
| SLZ | Sultan Resources Ltd | -3% | 0% | -14% | -18% | 0.155 | $12,909,080.30 |
| SFR | Sandfire Resources | -3% | 1% | -4% | -4% | 5.41 | $2,304,098,238.66 |
| WMC | Wiluna Mining Corp | -3% | -2% | -13% | -9% | 0.9 | $196,522,898.85 |
| DEG | De Grey Mining | -3% | 9% | 8% | 0% | 1.31 | $1,908,982,976.38 |
| LYN | Lycaonresources | -3% | 4% | 0% | 0% | 0.435 | $13,280,625.00 |
| WAF | West African Res Ltd | -3% | 3% | -3% | 32% | 1.3425 | $1,393,705,599.20 |
| MTC | Metalstech Ltd | -3% | 10% | -34% | 178% | 0.28 | $49,166,054.05 |
| FFX | Firefinch Ltd | -4% | 33% | 67% | 266% | 1.08 | $1,263,930,246.47 |
| AL8 | Alderan Resource Ltd | -4% | 44% | -40% | -62% | 0.026 | $11,064,718.08 |
| KRM | Kingsrose Mining Ltd | -4% | 1% | 53% | 44% | 0.078 | $59,962,121.52 |
| PNT | Panthermetalsltd | -4% | 22% | 0% | 0% | 0.25 | $7,280,000.00 |
| ERM | Emmerson Resources | -4% | -8% | 74% | 58% | 0.12 | $61,166,514.90 |
| MGV | Musgrave Minerals | -4% | 9% | -6% | -1% | 0.36 | $201,439,855.88 |
| FML | Focus Minerals Ltd | -4% | -4% | -14% | -23% | 0.24 | $70,206,868.03 |
| TRM | Truscott Mining Corp | -4% | 50% | 45% | 129% | 0.048 | $7,293,194.11 |
| GOR | Gold Road Res Ltd | -4% | -3% | 22% | 26% | 1.62 | $1,465,006,730.50 |
| POL | Polymetals Resources | -4% | -4% | -12% | 0% | 0.115 | $4,005,656.60 |
| NES | Nelson Resources. | -4% | -4% | -45% | -72% | 0.023 | $7,063,131.94 |
| E2M | E2 Metals | -4% | -21% | 0% | -34% | 0.23 | $40,685,995.09 |
| SLR | Silver Lake Resource | -4% | -1% | 33% | 19% | 2.115 | $1,990,561,555.14 |
| CMM | Capricorn Metals | -4% | 19% | 76% | 149% | 4.45 | $1,716,701,600.46 |
| SSR | SSR Mining Inc. | -4% | 8% | 47% | 50% | 31.24 | $639,587,852.37 |
| TAR | Taruga Minerals | -4% | -21% | -55% | -61% | 0.022 | $12,717,061.28 |
| RED | Red 5 Limited | -4% | 20% | 55% | 118% | 0.425 | $1,001,453,277.10 |
| KCC | Kincora Copper | -5% | -19% | -34% | -65% | 0.105 | $7,689,740.00 |
| PNM | Pacific Nickel Mines | -5% | -13% | -16% | 133% | 0.105 | $32,553,102.72 |
| NMR | Native Mineral Res | -5% | -7% | -8% | -27% | 0.205 | $9,046,330.20 |
| KAU | Kaiser Reef | -5% | -2% | -11% | -35% | 0.205 | $26,541,496.37 |
| BEZ | Besragoldinc | -5% | -17% | -63% | 0% | 0.06 | $10,310,997.60 |
| KAI | Kairos Minerals Ltd | -5% | 13% | -5% | -5% | 0.0295 | $58,862,804.73 |
| CAZ | Cazaly Resources | -5% | -7% | -17% | -13% | 0.039 | $14,462,049.93 |
| TSO | Tesoro Resources Ltd | -5% | -3% | -22% | -55% | 0.078 | $52,137,990.53 |
| MML | Medusa Mining Ltd | -5% | -4% | 15% | 4% | 0.865 | $205,160,670.90 |
| HAV | Havilah Resources | -5% | 9% | -8% | -12% | 0.185 | $57,314,250.05 |
| KSN | Kingston Resources | -5% | 16% | -14% | -18% | 0.18 | $74,298,499.02 |
| HXG | Hexagon Energy | -5% | -15% | -48% | -56% | 0.044 | $19,642,446.25 |
| EM2 | Eagle Mountain | -6% | -11% | -44% | -57% | 0.425 | $111,401,184.72 |
| SBM | St Barbara Limited | -6% | -4% | -6% | -31% | 1.445 | $1,195,051,435.12 |
| CHN | Chalice Mining Ltd | -6% | -3% | 6% | 17% | 6.89 | $2,573,920,186.50 |
| ARV | Artemis Resources | -6% | 5% | -33% | -25% | 0.067 | $93,018,175.93 |
| A1G | African Gold Ltd. | -6% | -13% | -21% | -31% | 0.165 | $20,896,807.40 |
| RDT | Red Dirt Metals Ltd | -6% | 3% | -20% | 265% | 0.565 | $176,860,052.59 |
| PUA | Peak Minerals Ltd | -6% | 28% | 0% | -22% | 0.016 | $16,661,932.02 |
| CTO | Citigold Corp Ltd | -6% | 0% | -24% | -38% | 0.008 | $22,669,272.73 |
| RML | Resolution Minerals | -6% | -11% | -24% | -45% | 0.016 | $10,645,865.58 |
| IDA | Indiana Resources | -6% | 8% | 7% | -20% | 0.064 | $29,014,314.19 |
| ZAG | Zuleika Gold Ltd | -6% | 3% | 52% | -20% | 0.032 | $15,646,518.75 |
| S2R | S2 Resources | -6% | -11% | 84% | -6% | 0.16 | $58,801,851.08 |
| OAU | Ora Gold Limited | -6% | 7% | 6% | -23% | 0.016 | $16,701,574.67 |
| SVY | Stavely Minerals Ltd | -6% | 0% | -13% | -33% | 0.39 | $100,470,159.02 |
| CDR | Codrus Minerals Ltd | -6% | -9% | -37% | 0% | 0.091 | $3,800,000.00 |
| GTR | Gti Resources | -6% | -20% | -36% | 16% | 0.0225 | $30,134,244.16 |
| KAL | Kalgoorliegoldmining | -6% | -6% | 0% | 0% | 0.15 | $11,227,363.00 |
| NST | Northern Star | -6% | 3% | 14% | -2% | 10.725 | $13,072,716,210.84 |
| STN | Saturn Metals | -6% | 5% | -5% | -2% | 0.4025 | $53,908,158.46 |
| AGG | AngloGold Ashanti | -6% | -7% | 20% | 3% | 6 | $548,627,754.75 |
| LCY | Legacy Iron Ore | -6% | 53% | 93% | 38% | 0.029 | $198,611,612.17 |
| DGO | DGO Gold Limited | -7% | 28% | 24% | 2% | 3.45 | $292,169,892.00 |
| WGX | Westgold Resources. | -7% | -12% | -10% | -22% | 1.76 | $868,865,464.61 |
| ADN | Andromeda Metals Ltd | -7% | -47% | -52% | -62% | 0.1025 | $325,944,685.40 |
| LCL | Los Cerros Limited | -7% | -2% | -24% | -40% | 0.1025 | $68,093,692.28 |
| DTM | Dart Mining NL | -7% | -6% | -39% | -42% | 0.076 | $9,710,292.54 |
| G88 | Golden Mile Res Ltd | -8% | -5% | 17% | -35% | 0.061 | $12,445,422.07 |
| MEG | Megado | -8% | 122% | 80% | 9% | 0.18 | $7,748,783.64 |
| GSM | Golden State Mining | -8% | 8% | -20% | -35% | 0.084 | $8,305,172.16 |
| MBK | Metal Bank Ltd | -8% | -14% | -37% | -43% | 0.006 | $16,950,818.04 |
| SVL | Silver Mines Limited | -8% | -4% | 7% | 4% | 0.235 | $316,498,875.04 |
| CHZ | Chesser Resources | -8% | 0% | -12% | -4% | 0.115 | $67,289,157.65 |
| NWM | Norwest Minerals | -8% | -10% | -33% | -20% | 0.055 | $10,114,013.67 |
| RDS | Redstone Resources | -8% | 10% | -15% | -8% | 0.011 | $8,105,156.36 |
| KCN | Kingsgate Consolid. | -9% | 13% | 0% | 84% | 1.66 | $377,351,372.37 |
| MLS | Metals Australia | -9% | 108% | 300% | 300% | 0.16 | $63,274,741.53 |
| FG1 | Flynngold | -9% | 15% | 0% | 0% | 0.155 | $10,249,768.00 |
| RSG | Resolute Mining | -9% | 11% | -18% | -31% | 0.36 | $397,415,347.20 |
| AAR | Anglo Australian | -9% | -17% | 11% | -17% | 0.091 | $56,637,027.71 |
| ALK | Alkane Resources Ltd | -9% | 5% | 24% | 51% | 1.155 | $714,700,104.00 |
| PNX | PNX Metals Limited | -9% | 0% | -31% | -35% | 0.005 | $26,664,346.84 |
| HMX | Hammer Metals Ltd | -9% | -5% | 54% | -9% | 0.1 | $81,499,462.30 |
| BTR | Brightstar Resources | -9% | 7% | -39% | -14% | 0.03 | $19,405,826.07 |
| AUC | Ausgold Limited | -10% | 50% | 67% | 50% | 0.075 | $154,798,488.74 |
| EVN | Evolution Mining Ltd | -10% | -5% | 12% | -11% | 4.21 | $7,955,253,344.22 |
| LM8 | Lunnonmetalslimited | -10% | 26% | 167% | 0% | 1.12 | $84,603,688.67 |
| MRZ | Mont Royal Resources | -10% | 30% | 3% | 23% | 0.37 | $23,434,301.87 |
| BMR | Ballymore Resources | -10% | 3% | -27% | 0% | 0.18 | $13,960,835.39 |
| MTH | Mithril Resources | -10% | -25% | -40% | -50% | 0.009 | $25,802,330.41 |
| BRB | Breaker Res NL | -10% | 10% | -21% | 13% | 0.27 | $91,235,460.12 |
| DCN | Dacian Gold Ltd | -10% | 6% | 13% | -34% | 0.265 | $303,821,577.64 |
| RRL | Regis Resources | -10% | 3% | -3% | -22% | 2.145 | $1,698,246,670.50 |
| DTR | Dateline Resources | -11% | 29% | 34% | 25% | 0.125 | $56,931,128.15 |
| NVA | Nova Minerals Ltd | -11% | 12% | -52% | -49% | 0.77 | $142,359,805.15 |
| RXL | Rox Resources | -12% | 3% | 7% | -27% | 0.405 | $68,421,083.54 |
| IVR | Investigator Res Ltd | -12% | -3% | -10% | -21% | 0.066 | $90,597,328.68 |
| GMR | Golden Rim Resources | -12% | -3% | -19% | -56% | 0.073 | $23,062,433.02 |
| EMU | EMU NL | -13% | 11% | -30% | -54% | 0.021 | $11,821,011.41 |
| RDN | Raiden Resources Ltd | -13% | 18% | -43% | -46% | 0.013 | $17,879,254.95 |
| CBY | Canterbury Resources | -14% | -25% | -44% | -49% | 0.056 | $7,638,308.86 |
| BC8 | Black Cat Syndicate | -14% | 4% | 6% | -22% | 0.585 | $83,224,108.49 |
| SBR | Sabre Resources | -14% | 20% | 20% | 0% | 0.006 | $19,524,153.98 |
| AYM | Australia United Min | -14% | 0% | -45% | -40% | 0.006 | $12,898,042.40 |
| WCN | White Cliff Min Ltd | -15% | 0% | 87% | 40% | 0.028 | $20,261,704.22 |
| TMZ | Thomson Res Ltd | -16% | -22% | -53% | -61% | 0.043 | $26,079,388.24 |
| AAJ | Aruma Resources Ltd | -18% | 17% | 34% | 64% | 0.115 | $18,835,380.36 |
| ICG | Inca Minerals Ltd | -18% | -7% | -25% | -30% | 0.098 | $50,563,792.34 |
| OKR | Okapi Resources | -19% | 21% | -39% | 94% | 0.35 | $44,512,885.74 |
| SIH | Sihayo Gold Limited | -40% | -50% | -70% | -79% | 0.003 | $11,056,384.24 |


Get the latest Stockhead news delivered free to your inbox.