Pic: Kevin Frayer/Getty Images
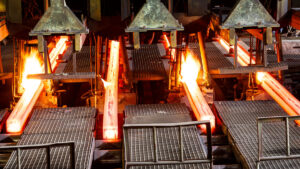
Bulk Buys: Iron, or? What commodity wins from China’s 5% growth target?
Mining
Pic: Kevin Frayer/Getty Images
Mining
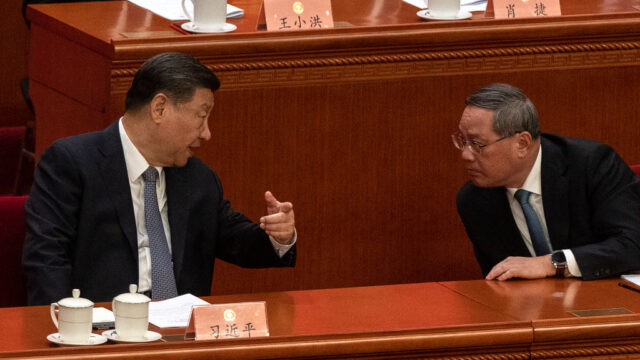
One of the most significant events of the year for bulk commodity markets is upon us, with around 3000 delegates of the National People’s Congress gathering in Beijing to theoretically debate but really just find out what the people actually running the show — Xi Jinping — have to say.
It’s a big deal though for iron ore and met coal markets, as well as broader steel pricing, because it will give a sense of how far China is willing to take stimulus measures to 1) meet its 5% GDP growth target, confirmed yesterday, and 2) inject capital into beaten down areas of the economy which consume steel like construction, real estate and manufacturing.
China’s wayward economy and high youth unemployment levels are among the biggest challenges facing the heavily autocratic rule of Xi Jinping.
Timing wise it’s an important juncture as well, given the country is moving into what is generally considered the peak construction season following the exit of the lull period during the Lunar New Year holiday.
Iron ore entered 2024 at unexpectedly strong levels, paying in excess of US$140/t.
But hopes for ‘bazooka style’ stimulus measures have waned, forcing sentiment to the downside. Singapore futures now sit at US$114.45/t.
RBC’s Australian analysts, led by Kaan Peker, see support for iron ore over the first half of 2024.
They’ve previously noted around 10-15Mt of expected supply was at risk of exiting the market, with shipments up to mid-February at Port Hedland down 15% amid a Fortescue (ASX:FMG) train derailment and wet weather and Sino Iron lopping 7Mt of its production forecasts due to land disputes with the tenaciously litigious billionaire and former parliamentarian Clive Palmer.
But it remains to be seen if the CCP can actually patch up its economic boat without letting more water into the ship.
“Conscious of its high debt levels, Beijing is expected to support its pro-growth stance via increased fiscal spend, while keeping credit growth in check,” RBC’s Peker, Paul Wiggers de Vries and Alexander Barkley said.
“While we don’t expect the NPC to fix what ails its economy, we expect policy to support a cyclical upturn and improvements in key areas of the economy, but possibly reverse later in 2024 as the benefit of policy fades (2H24 commodity demand will increasingly depend on normalisation of global growth/RoW loosening monetary policy).
“Near-term, the most upside potential we see is for copper prices, which we forecast to be in a deficit this year exacerbated by low inventory levels.
“We also expect iron ore to be supported over 1H24, with a pickup in blast furnace utilisation post CNY.”
The NPC and the Chinese People’s Political Consultative Conference tend to have a direct impact on commodity demand.
China is the world’s largest processor and refiner of a host of commodities and comfortably its largest steelmaker.
Steel output in China accounts for almost 60% of global production and around 75-80% of iron ore exports, largely sourced from Australia and Brazil.
In a previous note, RBC suggested prices would average US$130/t in the first quarter before slipping to US$95/t in the fourth quarter — a consequence of a second half weighted 32Mt surplus.
But China has surprised before. Last year its iron ore port stockpiles hit multi-year lows as it lightly increased steel production for the first time since hitting a peak of 1.065Bt in 2020.
That was supported by strong exports despite weak pricing at home. China’s steel sector has continued to add capacity in recent years, putting pressure on margins.
Yet it remains heavily reliant on Australian and Brazilian iron ore to operate. S&P Global says EAF plants — which used scrap steel and are cleaner than blast furnaces — could boast 17.6% of China’s steelmaking capacity after 2024.
Some gains have been seen coming out of Lunar New year, with SteelHome reporting the China Iron and Steel Association saw output from its member mills lift 1.5% in the period from February 11-26.
Despite the 5% growth target, Peker et. al. said RBC did not expect to see a massive wave of stimulus measures.
“In 2018, Beijing (in the GWR) opted to give implicit guidance by abandoning targets for money supply growth. Instead, Beijing committed that money supply would expand in-line with GDP,” they said.
“Although a more accommodating approach could be announced, as evidenced in 2020, which called for significantly higher money supply growth compared to the prior year; however, we think this scenario is unlikely.
“We note that recent communications/messaging suggests that Beijing is focused on targeted spending rather than substantial increases in lending.”
Among the headline numbers was a 7.2% increase (on par with 2023) in defence spending to US$262b announced by Premier Li Qiang yesterday. It dovetails with continued support for the One China policy and repudiation of US involvement in the status of Taiwan.
There was little large scale stimulus announced though. The Dalian exchange’s response showed the ho-hum nature of Li Qiang’s presentation for iron ore investors.
Its most traded contract for May softened in the afternoon to a 0.68% gain, fetching the equivalent of US$122.25/t at 6.30pm AEDT.
Scroll or swipe to reveal table. Click headings to sort.
| CODE | COMPANY | PRICE | WEEK RETURN % | MONTH RETURN % | 6 MONTH RETURN % | YEAR RETURN % | MARKET CAP |
|---|---|---|---|---|---|---|---|
| ACS | Accent Resources NL | 0.01 | 0% | 43% | 25% | -60% | $ 4,731,272.83 |
| ADY | Admiralty Resources. | 0.006 | -14% | -40% | 0% | -14% | $ 7,821,474.92 |
| AKO | Akora Resources | 0.155 | -3% | 11% | -16% | 11% | $ 14,722,336.17 |
| BCK | Brockman Mining Ltd | 0.028 | 4% | 17% | 6% | 8% | $ 259,846,499.67 |
| BHP | BHP Group Limited | 44.63 | 2% | -6% | -3% | -8% | $ 224,190,360,779.01 |
| CIA | Champion Iron Ltd | 7.74 | -2% | -10% | 22% | -3% | $ 4,039,785,562.80 |
| CZR | CZR Resources Ltd | 0.255 | -7% | -18% | 70% | 28% | $ 63,648,354.42 |
| DRE | Dreadnought Resources Ltd | 0.018 | -10% | -5% | -67% | -77% | $ 66,149,886.24 |
| EFE | Eastern Resources | 0.008 | 14% | 0% | -11% | -50% | $ 9,935,571.69 |
| CUF | Cufe Ltd | 0.013 | -7% | -28% | 0% | -35% | $ 14,899,460.75 |
| FEX | Fenix Resources Ltd | 0.245 | 0% | -6% | 4% | -2% | $ 163,235,211.20 |
| FMG | Fortescue Ltd | 25.84 | -7% | -13% | 28% | 14% | $ 78,082,550,320.48 |
| RHK | Red Hawk Mining Ltd | 0.65 | 0% | -7% | -16% | 38% | $ 115,854,280.32 |
| GEN | Genmin | 0.160002 | 0% | 0% | 0% | -13% | $ 79,339,701.97 |
| GRR | Grange Resources. | 0.455 | 6% | -3% | -2% | -54% | $ 520,802,414.10 |
| GWR | GWR Group Ltd | 0.092 | -3% | -3% | 6% | 48% | $ 30,194,365.57 |
| HAV | Havilah Resources | 0.15 | 0% | -12% | -42% | -58% | $ 47,495,881.50 |
| HAW | Hawthorn Resources | 0.075 | -10% | -9% | -35% | -25% | $ 25,796,202.20 |
| HIO | Hawsons Iron Ltd | 0.034 | 0% | 0% | 3% | -51% | $ 33,086,558.12 |
| IRD | Iron Road Ltd | 0.059 | -6% | -2% | -30% | -41% | $ 48,522,968.45 |
| JNO | Juno | 0.071 | -7% | -16% | 0% | -9% | $ 12,190,332.42 |
| LCY | Legacy Iron Ore | 0.015 | 0% | -12% | -6% | -17% | $ 89,695,566.79 |
| MAG | Magmatic Resrce Ltd | 0.044 | 19% | 26% | -27% | -52% | $ 13,450,483.11 |
| MDX | Mindax Limited | 0.04 | 0% | -15% | -20% | -38% | $ 81,822,351.20 |
| MGT | Magnetite Mines | 0.28 | 8% | 4% | -25% | -55% | $ 29,530,357.50 |
| MGU | Magnum Mining & Exp | 0.016 | -16% | -11% | -61% | -16% | $ 12,949,782.45 |
| MGX | Mount Gibson Iron | 0.45 | -7% | -15% | 2% | -25% | $ 564,920,935.85 |
| MIN | Mineral Resources. | 64 | 0% | 8% | -13% | -28% | $ 12,960,378,819.20 |
| MIO | Macarthur Minerals | 0.125 | 4% | -4% | -42% | -11% | $ 20,781,686.00 |
| PFE | Panteraminerals | 0.054 | 10% | -13% | -21% | -51% | $ 13,261,783.65 |
| PLG | Pearlgullironlimited | 0.029 | -22% | -12% | 26% | -24% | $ 5,727,170.12 |
| RHI | Red Hill Minerals | 5.75 | 10% | 16% | 37% | 26% | $ 334,214,625.10 |
| RIO | Rio Tinto Limited | 124.77 | 2% | -5% | 7% | -1% | $ 45,811,792,969.74 |
| RLC | Reedy Lagoon Corp. | 0.004 | 0% | 0% | -33% | -54% | $ 2,478,162.93 |
| CTN | Catalina Resources | 0.004 | -20% | -20% | 0% | -43% | $ 4,953,947.57 |
| SRK | Strike Resources | 0.05 | 25% | 32% | -7% | -35% | $ 13,620,000.00 |
| SRN | Surefire Rescs NL | 0.011 | 10% | -8% | -27% | -21% | $ 21,594,735.94 |
| TI1 | Tombador Iron | 0.014 | 0% | 0% | -33% | -39% | $ 30,218,753.22 |
| TLM | Talisman Mining | 0.19 | 9% | 0% | 27% | 31% | $ 33,897,662.82 |
| VMS | Venture Minerals | 0.024 | 50% | 200% | 100% | 9% | $ 46,550,273.74 |
| EQN | Equinoxresources | 0.255 | -12% | 2% | 82% | 38% | $ 24,282,000.72 |
| AMD | Arrow Minerals | 0.006 | 50% | 0% | 140% | 0% | $ 43,102,590.58 |
Less sensitive to the whims of the Chinese Government, thermal coal has continued its February gains, with front month futures for Newcastle 6000 kcal product rising back to US$140/t.
Coking coal futures, which are more sensitive to Chinese policy, were up 1% to US$309/t, still fetching an enormous premium they’ve maintained for the past year.
Whether there will be much upside for Aussie coal remains to be seen as stagnant North Asian gas prices make more expensive thermal coal supplies less attractive.
Meanwhile, Tigers Realm Coal (ASX:TIG) faces the prospect of shutting down its operations at the Amaam project in Russia after Federal Court proceedings began this month looking into whether the company is breaking Australian Government sanctions imposed after the Russian invasion of Ukraine.
TIG has made an application seeking a ruling that its operations do not come under the definition of exporting goods from a sanctioned country.
The company reported a net profit of $46.1 million for 2023, sold 1.27Mt of coal last year including both thermal and coking coal cargoes to Chinese and Russian customers.
Its board of directors includes Sirtex Medical founder Dr Bruce Gray, while one of its top shareholders is the Russian Direct Investment Fund.
Scroll or swipe to reveal table. Click headings to sort.
| CODE | COMPANY | PRICE | WEEK RETURN % | MONTH RETURN % | 6 MONTH RETURN % | YEAR RETURN % | MARKET CAP |
|---|---|---|---|---|---|---|---|
| NAE | New Age Exploration | 0.004 | 0% | -11% | -20% | -33% | $ 8,969,494.55 |
| CKA | Cokal Ltd | 0.105 | 5% | 5% | -9% | -36% | $ 104,658,051.06 |
| BCB | Bowen Coal Limited | 0.061 | 5% | -8% | -48% | -76% | $ 176,328,340.88 |
| SVG | Savannah Goldfields | 0.03 | 3% | -21% | -56% | -83% | $ 8,189,455.20 |
| GRX | Greenx Metals Ltd | 1.035 | 4% | 2% | 11% | 39% | $ 290,946,526.76 |
| AKM | Aspire Mining Ltd | 0.19 | 6% | -10% | 90% | 228% | $ 96,451,027.15 |
| AVM | Advance Metals Ltd | 0.039 | 26% | 8% | -68% | -78% | $ 1,563,313.21 |
| YAL | Yancoal Aust Ltd | 6.22 | 9% | 5% | 13% | 0% | $ 8,199,928,903.77 |
| NHC | New Hope Corporation | 4.71 | 6% | -11% | -20% | -18% | $ 3,956,169,971.52 |
| TIG | Tigers Realm Coal | 0.005 | -17% | -9% | -17% | -58% | $ 65,333,511.84 |
| SMR | Stanmore Resources | 3.44 | 0% | -12% | 13% | -7% | $ 3,046,703,722.92 |
| WHC | Whitehaven Coal | 7 | 1% | -15% | 9% | -7% | $ 5,822,741,456.64 |
| BRL | Bathurst Res Ltd. | 0.85 | 2% | -7% | -16% | -22% | $ 160,742,215.20 |
| CRN | Coronado Global Res | 1.38 | 4% | -14% | -17% | -29% | $ 2,330,270,684.70 |
| JAL | Jameson Resources | 0.031 | 3% | -3% | -39% | -57% | $ 13,507,732.98 |
| TER | Terracom Ltd | 0.24 | -11% | -20% | -55% | -69% | $ 192,231,896.40 |
| ATU | Atrum Coal Ltd | 0.004526 | 0% | 0% | 0% | -29% | $ 11,966,853.96 |
| MCM | Mc Mining Ltd | 0.14 | 0% | 0% | -7% | -35% | $ 57,104,704.16 |
| DBI | Dalrymple Bay | 2.75 | -1% | -2% | 1% | 11% | $ 1,368,302,200.92 |
| AQC | Auspaccoal Ltd | 0.061 | -15% | -38% | -47% | -65% | $ 32,316,958.23 |


Get the latest Stockhead news delivered free to your inbox.