
Mining
Reporting Rodeo Pt. 2: Here's how analysts think another 7 mid-tier ASX miners performed in the March quarter
Mining
Goldman Sachs says big miners are big value with upside in iron ore, coal and copper
Mining

Pic: ValerieE/E+ via Getty Images
Mining
Lin Manuel Miranda’s iconic 2015 musical Hamilton makes much use of the phrase “the world turned upside down” in reference to the American Revolution, in which its protagonist Alexander Hamilton played a starring role.
It is a phrase that could be said for a host of disruptive events in global markets over the past two years.
Covid-19 is an obvious one, the increased drive of governments, especially in the West, to pursue emissions reductions is another, and then there is Russia’s decision to invade Ukraine, which could force the West to cut off one of the world’s largest commodity exporters.
While price spikes in commodities ranging from iron ore, to coal, oil and gas, to base metals are responding with the volatility associated with short term shifts in sentiment, analysts and forecasters are increasingly of the belief these themes will have longer term implications.
Commonwealth Bank’s latest long-term forecasts, released on Monday by metals guru Vivek Dhar, are a case in point.
Cost curve modelling has long been favoured by analysts, basing long term price projections on the marginal cost of production.
In a sense that means how far do prices have to fall before only the powerful major suppliers are commercially viable.
But narratives like decarbonisation and the threat to Russian supply are beginning to creep into long term estimates.
In an update ominously titled “New World Order”, Dhar said Australia’s biggest bank has made “significant revisions” to its forecasts.
They include higher long-term prices for iron ore and coking coal, but lower prices for thermal energy coal.
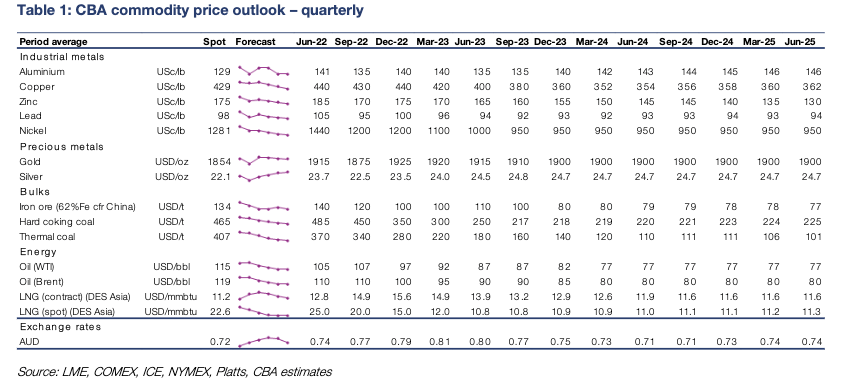
Dhar says iron ore will likely trend down from levels of ~US$137/t over the course of 2022 to US$100/t due to China’s proposal to maintain steel production at a level below 2021 output.
That may seem negative, representing a roughly 30% decline, but CBA’s previous long-term forecast had iron ore falling to just US$70/t by the end of 2023. In its new price deck, 62% iron ore falls to US$80/t by the end of 2023, then holds steady trending slightly lower to US$77/t over the medium and long term.
“The prospect of steel output cuts later this year still looms as a downside risk for iron ore prices after policymakers announced that they were aiming to cut China’s annual steel output again in 2022,” he said.
“Iron ore prices crashed from $US233/t (62% Fe, CFR China) in mid-May to $US87/t (62% Fe, CFRChina) in mid-November as nationwide steel output cuts were enforced.
“For China’s steel output to match production levels from last year, daily steel output will need to average 2.83Mt/day from May to December.
“That’s below April levels and suggests that steel output may have to be restrained later this year, especially if China’s daily steel output remains close to April levels over the next few months.”
That would signal the country’s second straight yearly fall. Iron ore production is already down significantly on the first half of last year, but that masks the unlikely productivity steelmakers have shown so far in 2022.
Steel output has risen significantly on the dire levels seen in the back end of 2021 despite being 10.3% down YTD on 2021 production – when Chinese factories were churning out rebar and hot rolled coil at a record pace.
That relative consistency has come despite Covid lockdowns, including in major steelmaking hubs like Tangshan, emission controls around the Winter Olympics and weak downstream demand from the property market.
With the country planning to exit its recessionary lockdowns with a bang, promising to flood the economy with capital for infrastructure spending, there is upside for iron ore which has held at extremely strong levels above US$100/t all year despite some weak downstream demand signals in the world’s largest steel market.
“We have upgraded our iron ore price forecast to take into account more supportive commodity-intensive policy in China and more subdued iron ore supply growth,” Dhar said.
“We still believe that iron ore prices will track lower this year as China implements steel output cuts to reduce emissions from the steel sector.
“We see upside risks to our outlook if Chinese policymakers enforce the ban not to reduce steel production in H2 2022. That’s increased in likelihood given China’s Government Work Report for 2022 omitted a key emission reduction measure.”
The long run price for coking coal has been upped from US$143 to US$150/t by Commbank, with only long-term plans to decarbonise the steel sector by increasing production from scrap steel and the electric arc furnace route keeping the CBA from lifting forecasts further.
Prices for premium hard coking coal hit US$671/t in mid-March and remain above US$500/t at the moment, levels powering massive profits for local coal miners.
“We have upgraded our coking coal price outlook significantly in the near-term to reflect the surge in buying interest for Australian coking coal to replace Russian coking coal,” he said.
“Prices have already declined significantly from peaks of $US671/t in mid-March as markets start to adjust from the initial shock of the Ukraine conflict and its negative impact on Russia’s coal exports.
“Recovering supply from Australia and Mongolia should also weigh on prices in coming months as Covid-19 linked delays are eventually addressed.”
Dhar says traded coking coal will retain a premium thanks to a lack of investment in new supplies of the key steelmaking ingredient, used to make coke for blast furnace steel mills.
“We’ve also upgraded our coking coal price outlook in the medium and longer term,” he said.
“Given the lack of investment in coking coal production, alongside the absence of Russia’s exports, traded coking coal prices will likely command a premium in coming years.
“As a result, we’ve upgraded our long-term coking coal price forecast from $US143/t (FOB Australia) (real 2022) to $US150/t.”
The downside risk could come from decarbonisation efforts, which could accelerate in response to high coking coal and coke prices, though most iron ore miners and coal producers are suspicious of the ability of new technology to supplant blast furnaces as the dominant process by 2050.
The high price of energy will however, likely weigh on thermal coal prices, with Dhar reducing his long term forecast from US$65/t to US$55/t.
That is a far cry from the almost US$400/t currently being commanded by 6000kcal Newcastle Index coal.
“High thermal coal prices and elevated coal power generation costs in the short to medium term will likely accelerate the transition to a carbon-free grid,” Dhar said.
“With policymakers around the world looking to cut down on coal power generation by reducing funding for it already, we think long-term traded thermal coal demand faces significant downside risks.
“The risk to our outlook is tilted to the downside, particularly if demand erodes faster than we anticipate because of high coal prices.
“A slower energy transition also suggest upside risks to our long-term price outlook.”
Scroll or swipe to reveal table. Click headings to sort.
| CODE | COMPANY | PRICE | 1 WEEK RETURN % | 1 MONTH RETURN % | 6 MONTH RETURN % | 1 YEAR RETURN % | MARKET CAP |
|---|---|---|---|---|---|---|---|
| NAE | New Age Exploration | 0.01 | 0% | -23% | -9% | -38% | $ 14,358,989.10 |
| CKA | Cokal Ltd | 0.14 | -7% | -15% | -5% | 133% | $ 131,452,857.20 |
| NCZ | New Century Resource | 2.18 | 0% | -4% | -3% | -21% | $ 286,869,661.47 |
| BCB | Bowen Coal Limited | 0.38 | 7% | 13% | 153% | 499% | $ 547,383,357.96 |
| LNY | Laneway Res Ltd | 0.005 | 0% | 0% | -13% | 4% | $ 28,359,073.85 |
| GRX | Greenx Metals Ltd | 0.175 | -8% | -8% | -24% | -23% | $ 44,383,581.20 |
| AKM | Aspire Mining Ltd | 0.087 | -2% | -11% | 10% | 9% | $ 44,164,417.70 |
| PAK | Pacific American Hld | 0.013 | 18% | -19% | -28% | -30% | $ 6,212,406.23 |
| AHQ | Allegiance Coal Ltd | 0.54 | 3% | -4% | -2% | 3% | $ 212,451,976.30 |
| YAL | Yancoal Aust Ltd | 5.79 | -1% | 9% | 125% | 191% | $ 7,420,869,635.94 |
| NHC | New Hope Corporation | 3.71 | -6% | 6% | 80% | 152% | $ 2,996,485,495.20 |
| TIG | Tigers Realm Coal | 0.023 | 28% | 44% | -4% | 188% | $ 261,334,047.36 |
| SMR | Stanmore Resources | 2.67 | -3% | 13% | 174% | 322% | $ 2,379,647,682.72 |
| WHC | Whitehaven Coal | 5.28 | 3% | 7% | 118% | 230% | $ 5,180,961,872.70 |
| BRL | Bathurst Res Ltd. | 1.39 | 3% | 19% | 111% | 321% | $ 257,378,904.10 |
| CRN | Coronado Global Res | 2.14 | 2% | 0% | 111% | 234% | $ 3,537,317,370.30 |
| JAL | Jameson Resources | 0.075 | 1% | -11% | -6% | -17% | $ 26,115,248.40 |
| TER | Terracom Ltd | 0.765 | 4% | 34% | 314% | 512% | $ 572,741,798.80 |
| ATU | Atrum Coal Ltd | 0.012 | 0% | 0% | -62% | -74% | $ 7,605,051.70 |
| MCM | Mc Mining Ltd | 0.14 | 4% | -15% | 40% | 33% | $ 27,671,681.80 |
In company news London-listed Alien Metals, which has the killer LSE ticker code UFO, has doubled down in its investment in the Pilbara iron ore industry.
Headed by former Rio Tinto (ASX:RIO) man Bill Brodie Good, Alien has inked a deal with ASX-listed Zenith Minerals (ASX:ZNC) over its unloved Vivash Gorge project.
Vivash Gorge shares a tenement boundary with Fortescue Metals Group’s (ASX:FMG) small Vivash SW deposit, which boasts a resource of 28Mt at 58.8% Fe and where FMG historically hit 70m at 60.5% Fe on the tenement boundary.
It comes on top of Alien’s Brockman (60km north of Vivash) and Hancock projects, the latter of which contains an established inferred JORC resource of 10.5Mt at 60.4% Fe.
“Given the adjacent DSO grade deposits defined by iron ore major Fortescue Metals Group, coupled with what we believe to be the tenement’s highly prospective yet untested geology, Vivash Gorge provides Alien with a third strategically located high grade iron ore project within the Pilbara region,” Good said.
Higher up the chain, Canadian high-grade iron ore producer Champion Iron (ASX:CIA) delivered its annual results last week, posting a 12.5% increase in profit to $522.2 million Canadian buckaroos.
It copped a drop in rating from the analysts at Goldman Sachs however from buy to neutral despite the overall bullish stance of GS on iron ore stocks.
GS analysts Paul Young and Hugo Nicolaci like the look of CIA’s plan to double production to up to 16Mtpa at its Bloom Lake mine in Canada, along with a host of additional expansion options it is studying including a proposal to produce an industry-leading 69% pure iron ore for lower emissions steelmaking processes.
But they have lowered their price target from $8.30 to $7.90 a share (CIA shares are currently worth $7.60) due to its higher market cap to NAV relative to other iron ore stocks like MinRes (ASX:MIN) and Rio, and the impact of crude oil prices on its longer freight route from Canada to Asia.
Scroll or swipe to reveal table. Click headings to sort.
| CODE | COMPANY | PRICE | 1 WEEK RETURN % | 1 MONTH RETURN % | 6 MONTH RETURN % | 1 YEAR RETURN % | MARKET CAP |
|---|---|---|---|---|---|---|---|
| ACS | Accent Resources NL | 0.06 | 0% | 0% | 9% | 58% | $ 27,961,636.98 |
| ADY | Admiralty Resources. | 0.016 | 0% | -11% | 7% | -16% | $ 18,250,108.14 |
| AKO | Akora Resources | 0.26 | 21% | -13% | 0% | -10% | $ 15,542,905.10 |
| BCK | Brockman Mining Ltd | 0.042 | -2% | -11% | 2% | -14% | $ 389,769,749.50 |
| BHP | BHP Group Limited | 47.8 | 5% | -1% | 26% | 0% | $ 242,130,918,177.70 |
| CIA | Champion Iron Ltd | 7.81 | 16% | 4% | 71% | 13% | $ 3,977,911,445.20 |
| CZR | CZR Resources Ltd | 0.014 | 0% | -13% | 100% | -7% | $ 55,781,172.43 |
| DRE | Dreadnought Resources Ltd | 0.042 | 8% | -5% | -11% | 62% | $ 122,063,392.69 |
| EFE | Eastern Resources | 0.036 | -3% | -28% | -51% | 157% | $ 37,788,591.98 |
| CUF | Cufe Ltd | 0.027 | 4% | -16% | -18% | -47% | $ 26,841,146.22 |
| FEX | Fenix Resources Ltd | 0.33 | 16% | -3% | 35% | 3% | $ 154,864,176.00 |
| FMG | Fortescue Metals Grp | 20.77 | 10% | -2% | 20% | -7% | $ 63,765,363,451.78 |
| FMS | Flinders Mines Ltd | 0.42 | -11% | -21% | -36% | -53% | $ 71,760,645.23 |
| GEN | Genmin | 0.2 | 0% | 0% | 25% | -26% | $ 56,657,570.00 |
| GRR | Grange Resources. | 1.69 | 34% | 28% | 236% | 286% | $ 1,851,741,916.80 |
| GWR | GWR Group Ltd | 0.125 | 0% | -24% | 4% | -56% | $ 40,152,081.88 |
| HAV | Havilah Resources | 0.265 | 56% | 43% | 36% | -4% | $ 82,098,790.61 |
| HAW | Hawthorn Resources | 0.12 | 4% | -23% | 35% | 145% | $ 38,354,295.50 |
| HIO | Hawsons Iron Ltd | 0.58 | -14% | -2% | 552% | 490% | $ 429,031,770.00 |
| IRD | Iron Road Ltd | 0.175 | 0% | -3% | -19% | -10% | $ 139,744,728.20 |
| JNO | Juno | 0.115 | 10% | -12% | -12% | -41% | $ 15,600,670.12 |
| LCY | Legacy Iron Ore | 0.024 | 9% | -14% | -11% | 60% | $ 153,763,828.78 |
| MAG | Magmatic Resrce Ltd | 0.072 | 4% | -15% | -27% | -67% | $ 16,796,128.67 |
| MDX | Mindax Limited | 0.059 | 0% | 0% | 23% | -9% | $ 112,672,163.12 |
| MGT | Magnetite Mines | 0.023 | -12% | -26% | 0% | -60% | $ 94,792,406.68 |
| MGU | Magnum Mining & Exp | 0.058 | -6% | -28% | -31% | -66% | $ 31,249,366.34 |
| MGX | Mount Gibson Iron | 0.7 | 10% | 7% | 73% | -22% | $ 853,450,463.27 |
| MIN | Mineral Resources. | 60.63 | 10% | 0% | 37% | 41% | $ 11,283,963,563.88 |
| MIO | Macarthur Minerals | 0.34 | -3% | -26% | -15% | -22% | $ 58,051,255.68 |
| PFE | Panteraminerals | 0.145 | 21% | -17% | -36% | 0% | $ 7,070,000.00 |
| PLG | Pearlgullironlimited | 0.036 | -31% | -55% | -64% | 0% | $ 2,525,506.17 |
| RHI | Red Hill Iron | 3.62 | -1% | 7% | 32% | 419% | $ 231,057,899.38 |
| RIO | Rio Tinto Limited | 110.47 | 6% | -3% | 16% | -10% | $ 40,648,175,433.00 |
| RLC | Reedy Lagoon Corp. | 0.028 | 12% | -20% | -35% | 65% | $ 15,902,359.67 |
| SHH | Shree Minerals Ltd | 0.009 | -10% | -40% | -18% | -44% | $ 12,222,368.92 |
| SRK | Strike Resources | 0.18 | 13% | 29% | 64% | -33% | $ 49,275,000.00 |
| SRN | Surefire Rescs NL | 0.031 | 15% | 3% | 158% | 29% | $ 47,039,960.60 |
| TI1 | Tombador Iron | 0.034 | 6% | -21% | 0% | -68% | $ 38,010,311.49 |
| TLM | Talisman Mining | 0.15 | 0% | -14% | -17% | -29% | $ 27,222,227.07 |
| VMS | Venture Minerals | 0.041 | 0% | -31% | -20% | -61% | $ 71,808,176.46 |
| EQN | Equinoxresources | 0.19 | 31% | -3% | -10% | 0% | $ 8,550,000.19 |
Mining
Mining
Mining


Get the latest Stockhead news delivered free to your inbox.


