
Via Getty
We asked XM’s Peter McGuire… can gold can keep conquering charted territories?
News
Via Getty
News
Last week investors were looking pretty convinced that the US Federal Reserve will about turn and start lowering the cash rates later this year. With US Treasury yields and the greenback subdued, along with simmering fears for a) the US bank sector and b) their debt ceiling, it was all on gold to keep making its lurch at record highs (which it hit on Thursday, before strongly pulling back on Friday).
Will the glittering metal extend its mad rush into new and terrifying heights this week? Or was Friday’s retreat a signal that the uptrend is suffering from hypoxia (running out of oxygen), or possibly on the threshold of some kind of high-altitude cerebral edema (HACE.)
Stockhead got the lowdown from the Mountaineer of Markets, XM CEO Peter McGuire.
Stockhead: After this month’s FOMC decision, US policymakers delivered the broadly anticipated 25bps hike, but they watered down their forward guidance. How does this play out for gold prices?
“Last week the Federal Reserve chair Jerome Powell told everyone something like – We’re done saying ‘that we anticipate’ further interest rate increases, and he even said that was a significant change in the central bank’s monetary policy stance.
“Basically, the Fed’s FOMC removed the bit saying that ‘some additional policy firming’ may be appropriate and instead said that in determining whether more hikes may be needed, they’ll consider the cumulative impact of the monetary tightening they’ve already done – taking into account the lags, or delays with which policy affects the economy and inflation – as well as the incoming economic and financial developments.
“In the US, higher rates have sharply raised borrowing costs, and that’s starting to flow through into those sketchy sectors like housing and has played a lead role in the recent failures of three US banks.
“The softening of the forward guidance pushed the US dollar lower initially, but the currency found some footing during Powell’s press conference, perhaps as he refused to close the door to a June hike… Having said that though, it was all south for the greenback thereafter as market participants were convinced that a pause is the most likely outcome for June.
“Just the next day, gold managed to hit a new all-time high at US$2,072.19, surpassing its previous record hit in August 2020.”
“Now investors are pricing in nearly 65bps worth of rate reductions by the end of the year, with the first quarter-point cut almost fully baked in the cake for September.
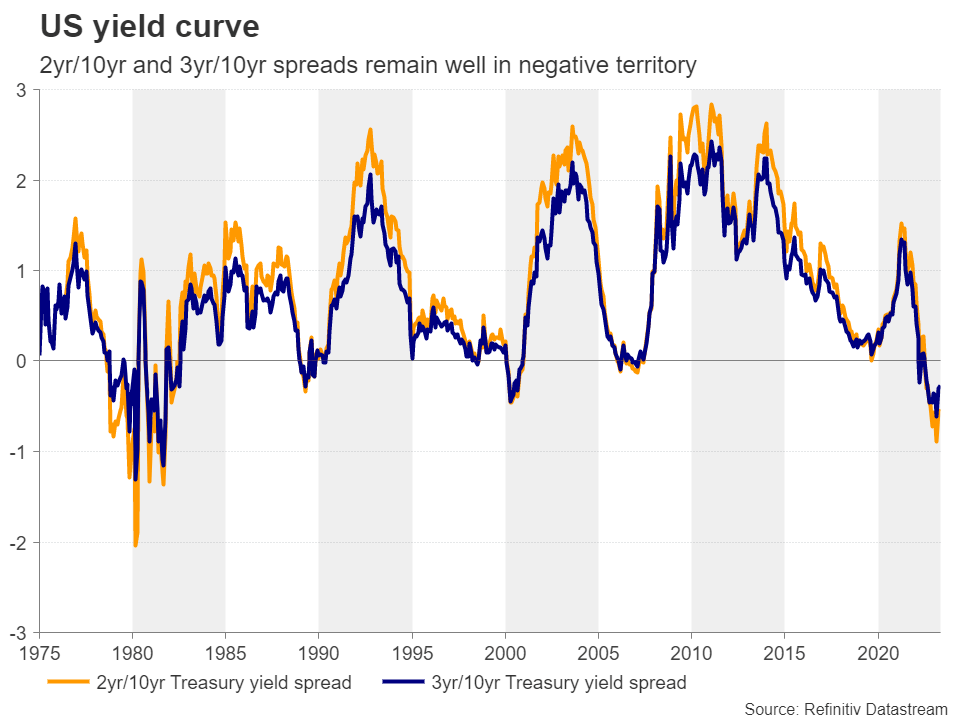
“This suggests that investors remain fearful that the Fed’s aggressive tightening could still throw the US economy into recession, and this is also evident by the inverted yield curve, where both the 2yr/10yr and 3yr/10yr spreads remain well in the negative territory after hitting their lowest levels since 1981.”
Stockhead: Does the gold trajectory tell us anything about the current uncertainty?
“Yes. Equities have remained relatively supported, but this may have been due to expectations of lower interest rates resulting in higher present values for high-growth firms.
“Gold is reflecting investors’ anxiety much better, as the steep rally to a new record high points to more bullish forces than just a weak US dollar. With Treasury yields coming off their October highs due to Fed cut bets, and the BoJ still not deciding on another step towards normalisation, the US dollar and the Japanese yen seem to have forgotten their safe-haven suits in the closet. Currently, the precious metal may be the only choice for those looking for safety.”

Stockhead: How high are we talking here, Peter?
“Well, the big question really should be: For how much longer can the precious metal continue to shine?”
“In its simplest form, the answer is: Until the dynamics that paint the bright picture begin to change.
“For example, even if the market continues to ignore the Fed’s warnings that no cuts are warranted this year, that cannot last forever.
“A June hike and/or keeping interest rates untouched beyond September – when the first cut is expected – could very well upset current expectations and trigger a rally in Treasury yields and the US dollar, which is a negative blend for gold… and if this is accompanied by better-than-expected US data that dismiss recession worries, the precious metal could lose more allure,” Pete warns.

Stockhead: What are the extraneous variables gold fans (and fans of money) should be watching ahead?
“Friday’s employment report for April came in strong and the Fed’s loan survey on Monday eased fears of a credit crunch, but the yield curve inversion is far from suggesting that the concerns about the future of the US economy have totally vanished.
“The ongoing stalemate in the US Congress over raising the debt ceiling is also a viable reason for staying cautious, while traders may be worried regarding other economies as well, like China, where last week’s disappointing PMIs suggested that after the post-reopening boost, the engines of the world’s second largest economy are now struggling to gather momentum.
“Thus, for now the outlook of the precious metal likely remains positive, at least for another month or two.”
Stockhead: Okay. Give us the mathematics, then.
“From a technical standpoint, despite pulling back after hitting a new record high, gold remains above both its 50- and 200-day exponential moving averages (EMAs), as well as above the tentative uptrend line drawn from the low of November 3.”
This keeps the prevailing uptrend intact, Pete says:
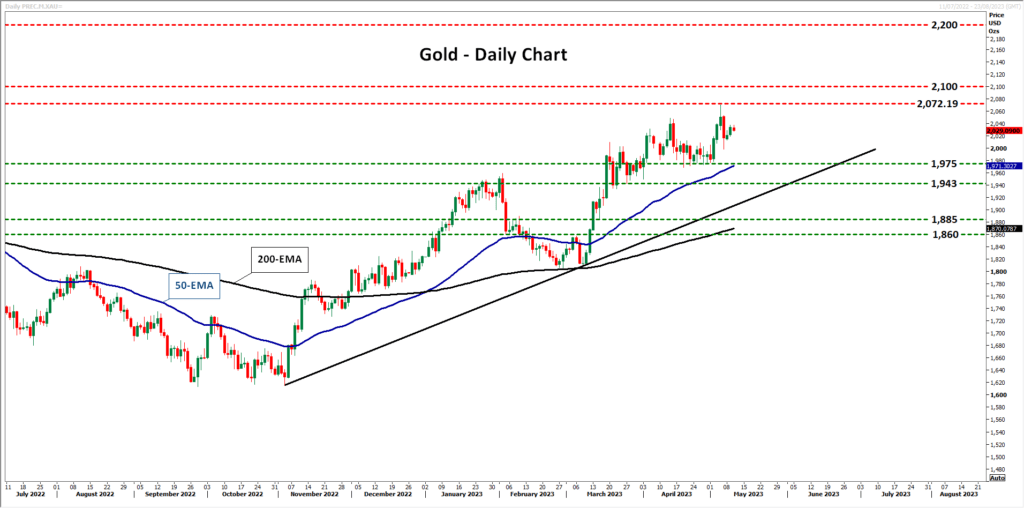
“If the bulls are strong enough to regain control from above the strong support zone of US$1,975, they may be able to reach and breach the record of US$2,072.19, entering uncharted territory.
“With no prior highs or inside swing lows to mark new resistances, a wise choice may be to mark round numbers like US$2,100 and US$2,200.
“On the downside, the move signalling that the bears may have stolen all the bulls’ swords may be a decisive dip below the $1,943 barrier, marked by the low of March 27. Such a slide may also signal the break below the aforementioned uptrend line and perhaps pave the way towards the low of March 15 at $1,885.”

Mining

Mining

Mining


Get the latest Stockhead news delivered free to your inbox.