Pic: DKosig / iStock / Getty Images Plus via Getty Images
Bitcoin is doing better than oil
Coinhead
Pic: DKosig / iStock / Getty Images Plus via Getty Images
Coinhead
Bitcoin’s (BTC) price remained resolute this week as global market indexes reacted to oil futures collapsing below $US0 for the first time in history.
West Texas Intermediate’s (WTI) May futures contract went negative on Tuesday with a closing price of -$37 per barrel. Demand for oil has shrivelled as half the world’s population is under lockdown restrictions.
As people have nowhere to go, less oil is being consumed. As a result, oil storage limits are being reached.
Consequently, the S&P/ASX Small Ordinaries (XSO) index was hit with a 3.6 per cent loss that day.
BTC’s price is becoming increasingly uncorrelated to traditional financial markets. The asset’s value was unhindered by the WTI’s price collapse and knock on effects on global market indexes.
BTC’s price fluctuated this week netting a 1.4 per cent gain. April 16 saw the largest price shift with a 6.3 per cent gain.
BTC dominance is a percentage figure of the assets market capitalisation compared to all alt-coins. It currently sits at 63.4 per cent dominant, down from 64.24 last week.
The slight shift is a result of Ethereum’s (ETH) recent price gains. ETH rallied 19.4 per cent on BTC Markets this week. Its market dominance rose from 8.96 per cent to 9.8.
Total market capitalisation of all digital assets increased $23bn this week.
| Asset | Percentage change April 16th - 23rd | YTD return (Jan 1st - April 23rd) |
|---|---|---|
| Bitcoin (BTC) | 0.0446 | 0.1442 |
| Ethereum (ETH) | 0.0739 | 0.5636 |
| Ripple (XRP) | 0.0063 | 0.0981 |
| Litecoin (LTC) | 0.0108 | 0.1531 |
| Stellar Lumens (XLM) | 0.1278 | 0.374 |
| Enjin Coin (ENJ) (Note: First listed on exchange 16 Jan 2020) | 0.2337 | 0.5279 |
| Chainlink (LINK) (Note: First listed on exchange 16 Jan 2020) | 0.08 | 0.6409 |
| S&P ASX Small Ordinaries (XSO) | -0.0454 | -23.2% |
Source: BTC Markets
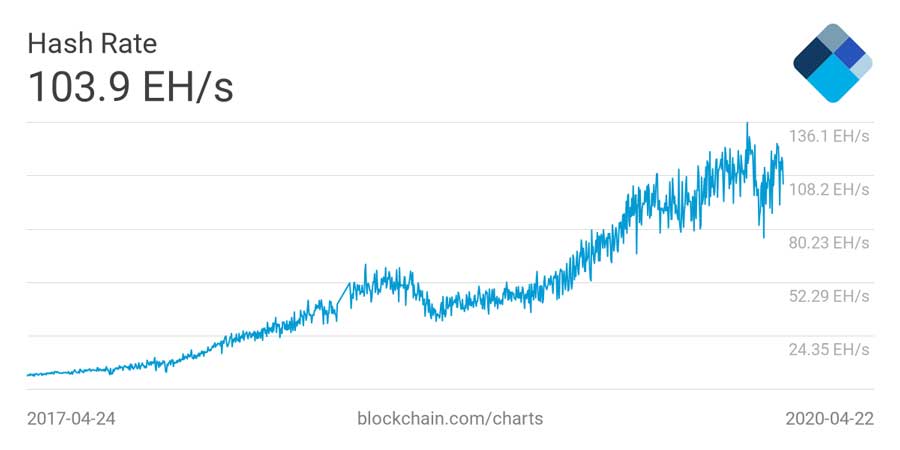
Hash rates refers to the computer processing power of digital asset miners. High powered computers (or miners) crunch complex mathematical problems. This action, known as hashing, verifies transactions that are added to the blockchain network as ‘blocks’.
The overall strength of BTC’s blockchain can be gauged by its total hash rate. A higher rate means increased network activity.
The below chart displays BTC’s hash rate, dated from April 2017 until today.
1 EH/s is equal to one quintillion hashes per second.
The chart clearly shows a sustained increase in network strength. The all-time high activity was recorded in early March.
BTC’s significant 35 per cent price drop on March 12 had a run-on effect on hash rate. However, the rate has made a recovery and continues to climb.
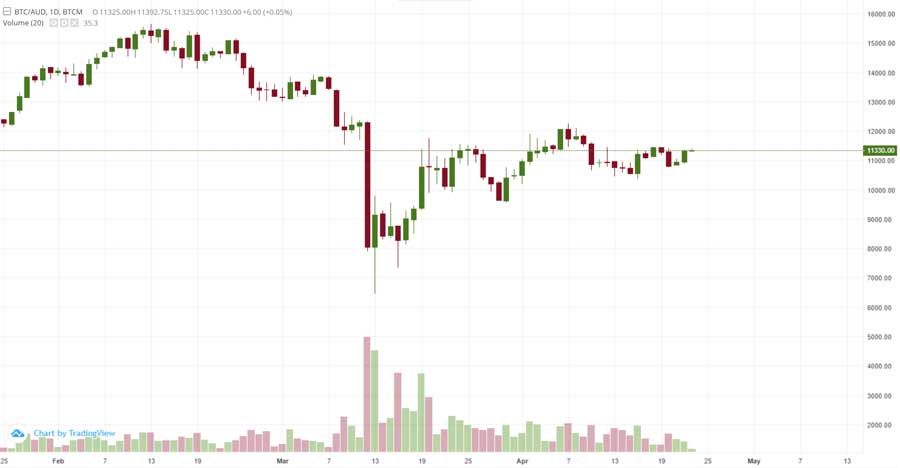
BTC’s price continues to steadily climb while its volume decreases. Despite some attempts for prices to rally higher, the lack of volume brings into question if the uptrend can be sustained.
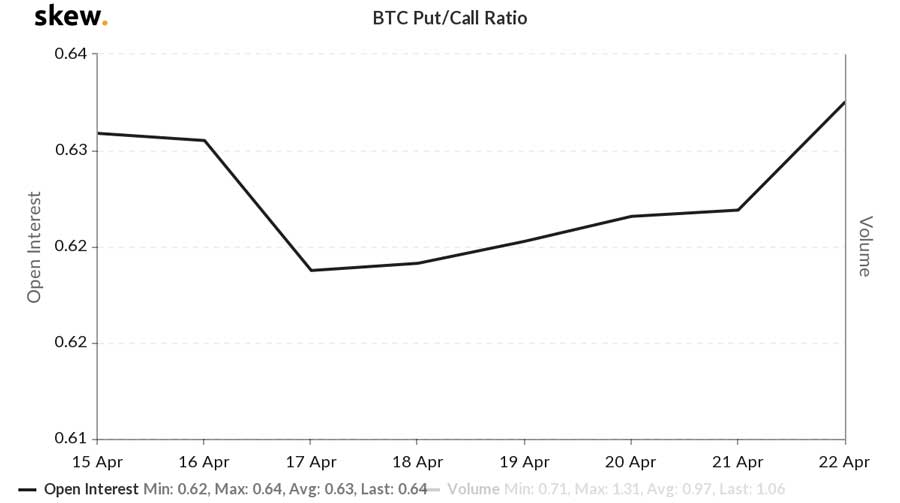
Put:call ratios are used to gauge market mood. A ratio of 0.7 or lower is considered bullish. BTC’s put:call ratio remained steady across the week. It increased from 0.63 to 0.62 after hitting a weekly low of 0.62.
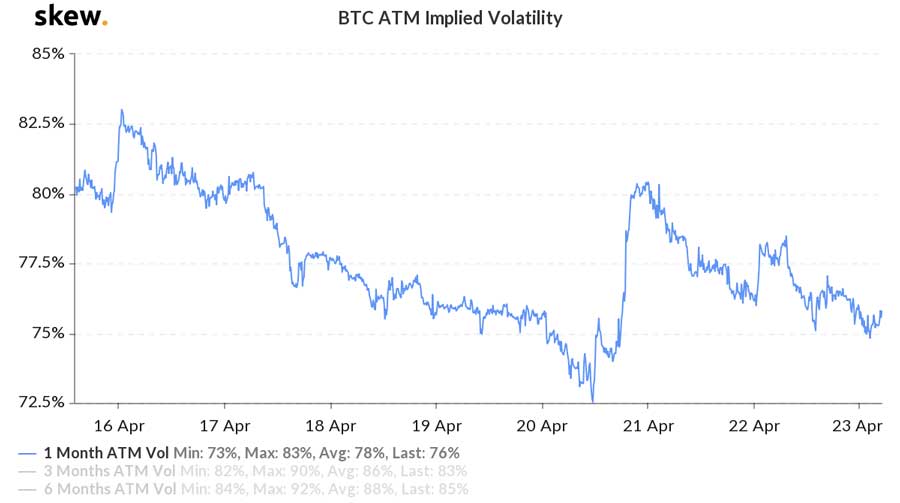
Implied volatility continues to trend down. It spiked on April 20 as BTC’s price dropped $480 across the day, but has since eased back down. It currently sits at 76 per cent.


Get the latest Stockhead news delivered free to your inbox.