

Mining
Up, Up, Down, Down: Everyone's a winner in an astounding April for major metals

Mining
Monsters of Rock: Lithium giant Pilbara Minerals says dividend unlikely, but low costs keep Pilgangoora flying high

Mining

Pic: Getty
Mining
Our High Voltage column wraps all the news driving ASX stocks with exposure to lithium, cobalt, graphite, nickel, rare earths, manganese, magnesium, and vanadium.
In early 2018, countless ASX explorers jumped on the cobalt bandwagon as prices peaked above $US100,000/t (~$US50/lb).
When prices began plummeting, the fair-weather battery metals stocks — which was most of them — moved onto the next hot thing.
Those few that stayed the course are now in the box seat.
After seven straight months of gains, cobalt prices hit US$70,000/t in December; a 119% increase over 12 months, but still shy of all time highs.
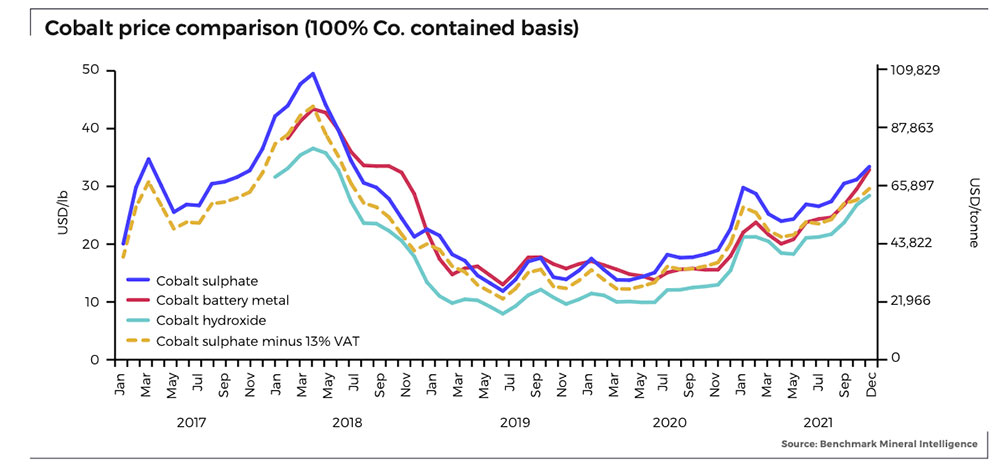
Benchmark Mineral Intelligence says forecasted supply additions will struggle to keep pace with strong demand growth, providing further support to prices in 2022.
Diversified mining company Eurasian Resources Group (ERG) told Fastmarkets that a new record price could be reached very soon.
“The underlying reason behind this is straightforward: while Gigafactories pop up at record speeds, developing industrial-scale mines still takes 10-15 years on average,” chief executive officer Benedikt Sobotka says.
“Importantly, downside risks surround the timely commissioning and ramping up of many existing projects, in view of global shortages of mining equipment and the adoption of the historically troublesome high-pressure acid-leach technology at numerous mine projects in Indonesia.”
The incumbent route to make battery grade nickel and cobalt from ‘laterite’ ore is High Pressure Acid Leach (HPAL) which is very expensive and historically prone to failure.
“While it seems ‘obvious’ to us today that much of the tightness is underscored by stellar demand growth from the EV segment, just a year ago, most of us would have sniggered with disbelief at the prospect of EV sales more than doubling in 2021,” Sobotka says.
“Yet it is now a reality, and the pace of EV adoption shows few signs of losing momentum.
“Even demand from traditional cobalt metal end-use sectors, which account for around one-quarter of overall consumption, looks set to undergo a boom this year, spurred by the recovery of the aerospace sector.”
Argus says large aircraft manufacturer Boeing plans to increase production of the 737 MAX to 31 planes/month in early 2022 from its recent rate of 19 planes/month at the end of the third quarter.
So, how do investors get a ticket to the cobalt show? As we said, there aren’t many quality cobalt stocks left on the ASX. Here’s a handful with significant exposure:
Australian hard rock miner Pilbara Minerals (ASX:PLS) banked record operating cash flows in the December quarter.
That extra $115.5 million in profit pumped its bank balance from $137.3m to $245m.
Average prices for spod concentrate were in the range of US$1750-1800/t, with a record US$2350/t being paid for a parcel sold through its online Battery Material Exchange platform in October.
Pricing records will continue to tumble, PLS says, with spodumene prices of US$2600-3000/t expected in the upcoming March quarter.
That’s a far cry from the $US380/t miners were getting late 2020.
PLS boss Ken Brinsden says analysts underestimate just how tight the lithium market is, and that carmakers will struggle to find the lithium needed to fill EV orders as demand booms.
“I don’t want to be trite, but carmakers have been asleep at the wheel,” he said.
“They haven’t been paying enough attention to the supply base in battery raw materials in the last five years.
“And it’s coming back to haunt them because insufficient incentive was placed in the market when it was really required especially in that period 3-5 years ago to get to where we needed to be today.”
That has created a dearth of new supply Brinsden said “now will take some years” to sort out.
Here’s how a basket of ASX stocks with exposure to lithium, cobalt, graphite, nickel, rare earths, magnesium, manganese, and vanadium are performing>>>
Battery metals stocks missing from our list? Shoot a friendly mail to [email protected]
| CODE | COMPANY | 1 WEEK RETURN % | 1 MONTH RETURN % | 6 MONTH RETURN R% | 1 YEAR RETURN % | PRICE | MARKET CAP |
|---|---|---|---|---|---|---|---|
| MRD | Mount Ridley Mines | 20% | 13% | 125% | 80% | 0.009 | $48,717,290.19 |
| PVW | PVW Res | 17% | 46% | 209% | 260% | 0.54 | $36,021,375.00 |
| GSR | Greenstone Resources | 14% | 18% | 65% | 38% | 0.033 | $37,125,619.69 |
| COB | Cobalt Blue | 13% | 40% | 111% | 61% | 0.58 | $148,168,767.11 |
| GMC | Gulf Manganese Corp | 10% | 10% | 10% | 10% | 0.0055 | $29,718,965.83 |
| ARR | American Rare Earths | 8% | 148% | 377% | 310% | 0.41 | $157,033,552.80 |
| G88 | Golden Mile Res | 6% | 16% | 14% | 27% | 0.057 | $9,342,989.71 |
| WML | Woomera Mining | 5% | 29% | 1% | -31% | 0.022 | $12,377,343.26 |
| AML | Aeon Metals | 4% | 29% | -11% | -61% | 0.049 | $37,229,782.18 |
| ARL | Ardea Resources | 3% | 32% | 38% | 38% | 0.645 | $83,992,282.50 |
| RFR | Rafaella Resources | 3% | 20% | -20% | 7% | 0.078 | $14,305,681.35 |
| NTU | Northern Min | 2% | -2% | 31% | -15% | 0.051 | $242,825,814.95 |
| WKT | Walkabout Resources | 2% | 32% | 29% | 69% | 0.27 | $117,591,529.12 |
| LPI | Lithium Pwr Int | 1% | 64% | 167% | 116% | 0.68 | $219,725,004.24 |
| BHP | BHP Group | 1% | 12% | -12% | 5% | 46.35 | $138,425,795,406.48 |
| OMH | OM Holdings | 1% | 5% | 9% | 2% | 0.885 | $635,216,069.82 |
| EMH | European Metals Hldg | 0% | 14% | -8% | 34% | 1.53 | $201,440,944.78 |
| VIA | Viagold Rare Earth | 0% | 0% | 2339% | 4662% | 2 | $166,624,808.00 |
| PSC | Prospect Res | 0% | 14% | 207% | 353% | 0.86 | $355,674,534.05 |
| HNR | Hannans | 0% | 78% | 724% | 541% | 0.057 | $148,557,474.13 |
| IPT | Impact Minerals | 0% | 0% | 8% | -30% | 0.014 | $28,333,128.87 |
| ARN | Aldoro Resources | 0% | 0% | -15% | 54% | 0.37 | $29,961,927.32 |
| TMT | Technology Metals | 0% | 16% | 1% | -12% | 0.355 | $65,171,644.80 |
| ATM | Aneka Tambang | 0% | 1% | 10% | 10% | 1.1 | $1,434,013.90 |
| RMX | Red Mount Min | 0% | 22% | 16% | -31% | 0.011 | $13,180,124.72 |
| LML | Lincoln Minerals | 0% | 0% | 0% | 0% | 0.008 | $4,599,869.49 |
| NKL | Nickelx | 0% | 26% | -24% | 0% | 0.145 | $7,749,000.00 |
| MLS | Metals Australia | 0% | 0% | 0% | -20% | 0.002 | $10,477,114.72 |
| TSC | Twenty Seven Co. | 0% | 0% | 0% | -33% | 0.004 | $10,643,255.62 |
| WCN | White Cliff Min | 0% | 56% | 79% | 4% | 0.025 | $13,050,320.78 |
| CMO | Cosmometals | 0% | 0% | 0% | 0% | 0.21 | $5,102,000.00 |
| JMS | Jupiter Mines. | 0% | -2% | -23% | -27% | 0.22 | $430,978,027.26 |
| VR8 | Vanadium Resources | -1% | 18% | 45% | 93% | 0.077 | $35,483,428.05 |
| LKE | Lake Resources | -2% | -3% | 127% | 156% | 0.92 | $1,075,624,098.56 |
| AX8 | Accelerate Resources | -2% | 11% | 5% | -32% | 0.041 | $9,884,897.06 |
| VUL | Vulcan Energy | -2% | -11% | 3% | 12% | 9.19 | $1,162,095,090.34 |
| LEL | Lithenergy | -2% | 14% | 101% | 0% | 0.995 | $45,675,000.00 |
| ESS | Essential Metals | -3% | 178% | 285% | 203% | 0.5 | $120,330,672.66 |
| ESR | Estrella Res | -3% | 50% | -23% | -58% | 0.033 | $38,842,443.42 |
| ILU | Iluka Resources | -3% | 6% | 7% | 56% | 10.34 | $4,308,199,841.56 |
| AOU | Auroch Minerals | -4% | -4% | -42% | -61% | 0.11 | $37,910,438.90 |
| BOA | Boadicea Resources | -4% | 5% | -2% | -11% | 0.22 | $15,928,478.48 |
| PLL | Piedmont Lithium Inc | -4% | -13% | -5% | -17% | 0.645 | $356,000,397.00 |
| PAM | Pan Asia Metals | -5% | 33% | 320% | 271% | 0.63 | $42,353,720.30 |
| AVL | Aust Vanadium | -5% | 43% | 67% | 33% | 0.04 | $118,588,676.51 |
| RBX | Resource B | -5% | 8% | 25% | 488% | 0.2 | $7,989,517.00 |
| NIC | Nickel Mines | -5% | -1% | 37% | 16% | 1.43 | $3,621,641,833.44 |
| EGR | Ecograf | -5% | -8% | -10% | 38% | 0.615 | $256,690,071.63 |
| CHN | Chalice Mining | -6% | -12% | 17% | 100% | 7.72 | $2,691,077,932.92 |
| S32 | South32 | -6% | -4% | 31% | 49% | 3.85 | $17,948,732,706.58 |
| CTM | Centaurus Metals | -6% | -3% | 30% | 35% | 1.115 | $395,288,409.80 |
| AVZ | AVZ Minerals | -6% | -1% | 233% | 259% | 0.7 | $2,312,882,263.60 |
| CLA | Celsius Resource | -6% | 58% | -3% | -36% | 0.03 | $31,619,342.43 |
| BKT | Black Rock Mining | -7% | -2% | 48% | 48% | 0.215 | $178,072,339.80 |
| AR3 | Austrare | -7% | 2% | 18% | 0% | 0.89 | $64,420,938.12 |
| ASN | Anson Resources | -7% | 23% | 90% | 8% | 0.135 | $127,674,910.00 |
| HXG | Hexagon Energy | -7% | -11% | -1% | -49% | 0.066 | $28,098,871.10 |
| LRV | Larvottoresources | -7% | 63% | 0% | 0% | 0.195 | $6,147,750.00 |
| AZS | Azure Minerals | -7% | 10% | 64% | -29% | 0.385 | $118,079,573.98 |
| MLX | Metals X | -7% | 9% | 96% | 194% | 0.5 | $453,633,033.50 |
| MRR | Minrex Resources | -7% | 72% | 226% | 158% | 0.062 | $39,444,046.00 |
| VMC | Venus Metals Cor | -8% | 9% | 6% | -20% | 0.185 | $27,949,556.36 |
| STK | Strickland Metals | -8% | -13% | 9% | 71% | 0.06 | $75,506,597.15 |
| FGR | First Graphene | -8% | -12% | -23% | -36% | 0.18 | $90,802,962.69 |
| QEM | QEM | -8% | -3% | 9% | 71% | 0.18 | $20,416,199.94 |
| SYA | Sayona Mining | -8% | -4% | 56% | 148% | 0.12 | $846,795,319.44 |
| ALY | Alchemy Resource | -8% | 9% | -12% | -32% | 0.012 | $12,380,483.57 |
| MMC | Mitremining | -8% | -5% | 0% | 0% | 0.18 | $4,875,318.00 |
| FRB | Firebird Metals | -8% | -12% | -37% | 0% | 0.345 | $16,156,098.56 |
| JRL | Jindalee Resources | -8% | 29% | 6% | 64% | 2.63 | $137,965,113.30 |
| MOH | Moho Resources | -8% | -11% | -12% | -34% | 0.057 | $7,169,197.91 |
| KZR | Kalamazoo Resources | -8% | -7% | -3% | -39% | 0.34 | $47,188,171.55 |
| HYM | Hyperion Metals | -8% | -1% | -12% | 96% | 0.9 | $124,842,199.45 |
| BYH | Bryah Resources | -8% | 17% | -3% | -21% | 0.056 | $12,215,187.45 |
| IGO | IGO | -8% | 4% | 32% | 75% | 11.75 | $8,973,623,584.05 |
| AGY | Argosy Minerals | -8% | 22% | 168% | 86% | 0.335 | $424,711,668.81 |
| GED | Golden Deeps | -8% | -8% | -8% | 0% | 0.011 | $8,146,440.12 |
| GL1 | Globallith | -8% | 90% | 474% | 0% | 1.52 | $210,986,889.70 |
| PNN | PepinNini Minerals | -9% | 19% | 64% | -8% | 0.475 | $28,094,574.98 |
| LEG | Legend Mining | -9% | 22% | -22% | -45% | 0.071 | $187,349,229.03 |
| AS2 | Askarimetals | -9% | 79% | 79% | 0% | 0.35 | $10,899,016.17 |
| QXR | Qx Resources | -9% | 86% | 200% | 39% | 0.039 | $26,456,130.52 |
| MRC | Mineral Commodities | -9% | 46% | -3% | -60% | 0.145 | $77,573,641.93 |
| GME | GME Resources | -10% | -6% | 32% | -22% | 0.066 | $41,579,353.34 |
| BRB | Breaker Res NL | -10% | -21% | 39% | 21% | 0.23 | $71,685,004.38 |
| PRL | Province Resources | -10% | -10% | -4% | 514% | 0.135 | $146,855,775.43 |
| LSR | Lodestar Minerals | -10% | 0% | -10% | -36% | 0.009 | $13,909,373.48 |
| PLS | Pilbara Min | -10% | 8% | 81% | 199% | 3.2 | $9,585,284,784.74 |
| INR | Ioneer | -10% | -11% | 65% | 97% | 0.66 | $1,363,614,685.34 |
| DTM | Dart Mining NL | -10% | 4% | -38% | -54% | 0.0835 | $10,394,992.66 |
| TLG | Talga Group | -10% | -5% | 11% | 1% | 1.46 | $460,103,823.69 |
| MCR | Mincor Resources NL | -10% | -4% | 32% | 58% | 1.625 | $782,220,986.40 |
| QPM | Queensland Pacific | -11% | 0% | 3% | 143% | 0.17 | $254,613,666.62 |
| RNU | Renascor Res | -11% | 75% | 184% | 425% | 0.21 | $397,712,906.85 |
| CXO | Core Lithium | -11% | 40% | 185% | 104% | 0.755 | $1,244,278,008.02 |
| AXE | Archer Materials | -11% | -5% | -31% | 36% | 1.08 | $262,421,239.42 |
| INF | Infinity Lithium | -11% | 0% | 76% | -18% | 0.165 | $70,395,207.52 |
| GLN | Galan Lithium | -11% | -21% | 52% | 165% | 1.525 | $451,226,210.48 |
| LOT | Lotus Resources | -11% | -20% | 58% | 63% | 0.245 | $243,999,736.25 |
| MAN | Mandrake Res | -11% | 0% | -37% | -40% | 0.049 | $23,089,827.36 |
| PAN | Panoramic Resources | -11% | -8% | 48% | 48% | 0.245 | $512,728,501.00 |
| POS | Poseidon Nick | -11% | -2% | -27% | 27% | 0.098 | $294,140,114.50 |
| FRS | Forrestaniaresources | -11% | 28% | 0% | 0% | 0.365 | $10,518,750.00 |
| WR1 | Winsome Resources | -11% | 31% | 0% | 0% | 0.445 | $53,783,997.60 |
| JRV | Jervois Global | -11% | 11% | 28% | 29% | 0.64 | $956,532,693.06 |
| PUR | Pursuit Minerals | -11% | -8% | -60% | -33% | 0.024 | $22,693,180.66 |
| BMM | Balkanminingandmin | -11% | -1% | -13% | 0% | 0.355 | $11,298,750.00 |
| CWX | Carawine Resources | -11% | -11% | -37% | -34% | 0.155 | $22,495,167.26 |
| LIT | Lithium Australia NL | -12% | 0% | 0% | -30% | 0.115 | $118,501,150.74 |
| CNB | Carnaby Resource | -12% | 90% | 338% | 409% | 1.4 | $178,339,657.73 |
| ADV | Ardiden | -12% | 36% | 67% | -40% | 0.015 | $30,356,694.98 |
| PEK | Peak Rare Earths | -12% | -6% | -35% | -25% | 0.75 | $149,364,399.75 |
| EMN | Euromanganese | -12% | 10% | -23% | -33% | 0.48 | $117,714,799.02 |
| SYR | Syrah Resources | -12% | 1% | 17% | 45% | 1.65 | $857,823,723.56 |
| LTR | Liontown Resources | -12% | -8% | 95% | 290% | 1.42 | $3,047,245,888.73 |
| MNS | Magnis Energy Tech | -13% | 8% | 81% | 31% | 0.49 | $476,032,290.53 |
| HAS | Hastings Tech Met | -13% | 2% | 29% | 11% | 0.245 | $443,310,363.83 |
| REE | Rarex | -13% | 5% | 13% | -16% | 0.105 | $47,417,286.42 |
| CNJ | Conico | -13% | 0% | -43% | 6% | 0.035 | $35,007,520.59 |
| LMG | Latrobe Magnesium | -13% | 13% | 483% | 320% | 0.105 | $164,618,264.16 |
| AKE | Allkem | -13% | -8% | 17% | 57% | 9.04 | $5,763,231,297.44 |
| AAJ | Aruma Resources | -13% | 19% | 39% | -1% | 0.082 | $10,580,766.25 |
| NWC | New World Resources | -13% | -9% | -12% | 26% | 0.067 | $110,031,044.72 |
| TON | Triton Min | -13% | -3% | 0% | -42% | 0.033 | $43,496,626.36 |
| IMI | Infinitymining | -13% | 0% | 0% | 0% | 0.165 | $9,200,000.00 |
| LYC | Lynas Rare Earths | -13% | -8% | 28% | 80% | 8.95 | $8,049,511,061.68 |
| ARU | Arafura Resource | -13% | -3% | 44% | -22% | 0.195 | $302,331,379.74 |
| MQR | Marquee Resource | -13% | 18% | 145% | 106% | 0.13 | $26,808,137.75 |
| MIN | Mineral Resources. | -13% | 1% | -9% | 52% | 55.41 | $10,169,583,862.35 |
| CZN | Corazon | -14% | -14% | -20% | -57% | 0.032 | $10,380,797.28 |
| OZL | OZ Minerals | -14% | -14% | 5% | 31% | 24.18 | $8,401,432,220.14 |
| 1MC | Morella Corporation | -14% | 182% | -51% | -51% | 0.031 | $155,286,419.58 |
| VML | Vital Metals | -14% | 0% | 0% | -2% | 0.049 | $212,439,637.28 |
| SRI | Sipa Resources | -14% | -2% | -26% | -31% | 0.042 | $8,816,066.53 |
| CHR | Charger Metals | -14% | 89% | 235% | 0% | 0.72 | $24,824,052.13 |
| AUZ | Australian Mines | -14% | 0% | -18% | -29% | 0.18 | $79,616,173.95 |
| RXL | Rox Resources | -14% | 22% | 1% | -15% | 0.42 | $70,923,426.30 |
| AQD | Ausquest | -14% | 6% | -18% | -10% | 0.018 | $14,010,536.79 |
| S2R | S2 Resources | -14% | -3% | 16% | -5% | 0.18 | $64,147,473.90 |
| EMS | Eastern Metals | -14% | 30% | 0% | 0% | 0.24 | $8,900,000.00 |
| TEM | Tempest Minerals | -14% | 9% | 22% | -17% | 0.024 | $8,753,819.76 |
| AM7 | Arcadia Minerals | -15% | 12% | 31% | 0% | 0.235 | $8,099,844.88 |
| KOR | Korab Resources | -15% | -2% | 88% | 213% | 0.047 | $18,352,500.00 |
| FFX | Firefinch | -15% | -15% | 62% | 246% | 0.64 | $759,897,849.00 |
| IXR | Ionic Rare Earths | -15% | 35% | 107% | 45% | 0.058 | $194,136,272.30 |
| EUR | European Lithium | -15% | 0% | 105% | 49% | 0.115 | $130,678,128.14 |
| TNG | TNG | -15% | -5% | 7% | -30% | 0.074 | $102,742,948.43 |
| DEV | Devex Resources | -15% | -11% | 70% | 102% | 0.425 | $133,528,186.83 |
| A8G | Australasian Metals | -15% | 11% | 263% | 0% | 0.535 | $20,888,656.88 |
| AZL | Arizona Lithium | -15% | 56% | 400% | 159% | 0.14 | $269,381,480.76 |
| RAG | Ragnar Metals | -15% | 34% | -22% | -32% | 0.039 | $14,907,395.56 |
| E25 | Element 25 | -15% | 0% | -34% | -28% | 1.245 | $184,779,546.49 |
| SRL | Sunrise | -15% | -3% | -13% | -32% | 1.735 | $155,800,130.67 |
| GW1 | Greenwing Resources | -16% | 7% | 118% | 45% | 0.435 | $50,318,042.88 |
| BUX | Buxton Resources | -16% | -4% | -38% | 14% | 0.075 | $9,523,880.24 |
| TMB | Tambourahmetals | -16% | 4% | 0% | 0% | 0.24 | $9,680,260.53 |
| FG1 | Flynngold | -16% | -3% | -11% | 0% | 0.155 | $9,673,997.63 |
| SBR | Sabre Resources | -17% | 0% | 25% | -38% | 0.005 | $8,639,068.25 |
| PGM | Platina Resources | -17% | -21% | -37% | -9% | 0.05 | $22,587,881.78 |
| TKL | Traka Resources | -17% | 15% | 7% | -29% | 0.015 | $10,575,834.20 |
| NC1 | Nicoresources | -17% | 0% | 0% | 0% | 0.475 | $36,208,750.83 |
| SLZ | Sultan Resources | -17% | 3% | -8% | -8% | 0.17 | $11,473,174.19 |
| VRC | Volt Resources | -17% | -27% | -39% | 0% | 0.019 | $53,525,543.10 |
| GAL | Galileo Mining | -17% | -10% | -37% | -49% | 0.19 | $31,997,748.95 |
| SGQ | St George Min | -18% | 6% | -1% | -37% | 0.066 | $43,600,129.34 |
| GBR | Greatbould Resources | -18% | 4% | 65% | 211% | 0.14 | $51,799,192.31 |
| NMT | Neometals | -19% | 20% | 145% | 333% | 1.315 | $743,050,016.58 |
| ADD | Adavale Resource | -19% | 14% | -19% | -26% | 0.048 | $17,078,392.45 |
| GRE | Greentechmetals | -19% | 0% | 0% | 0% | 0.3 | $8,272,499.70 |
| BSX | Blackstone | -19% | 6% | 34% | 24% | 0.585 | $267,510,551.18 |
| BEM | Blackearth Minerals | -19% | 9% | 19% | 105% | 0.125 | $27,461,908.38 |
| RLC | Reedy Lagoon Corp. | -20% | 6% | 94% | 74% | 0.033 | $18,079,288.59 |
| EVR | Ev Resources | -20% | 25% | 183% | 38% | 0.065 | $59,945,214.62 |
| CMX | Chemxmaterials | -20% | 0% | 0% | 0% | 0.235 | $11,121,780.24 |
| LPD | Lepidico | -21% | 3% | 131% | 12% | 0.037 | $230,266,059.33 |
| SHH | Shree Minerals | -21% | 22% | -15% | -39% | 0.011 | $12,758,842.70 |
| GSM | Golden State Mining | -23% | 13% | -40% | -36% | 0.093 | $7,477,918.65 |
| CAE | Cannindah Resources | -23% | 41% | 307% | 728% | 0.24 | $123,237,560.49 |
| EFE | Eastern Resources | -23% | 6% | 273% | 500% | 0.056 | $53,862,797.01 |
| BNR | Bulletin Res | -25% | 52% | 84% | 30% | 0.105 | $27,755,757.70 |
| NVA | Nova Minerals | -25% | -30% | -30% | -53% | 0.8 | $161,281,045.08 |
Mining
Mining
Mining

Mining

Mining

Mining


Get the latest Stockhead news delivered free to your inbox.