The Secret Broker: Forget 40 days and 40 nights. Try 30 years in the wilderness!

Pic: DKosig / iStock / Getty Images Plus via Getty Images
After 35 years of stockbroking for some of the biggest houses and investors in Australia and the UK, the Secret Broker is regaling Stockhead readers with his colourful war stories — from the trading floor to the dealer’s desk.
Human Nature is a funny thing. I’m not talking about the boy band founded in 1989, who unfortunately for us lovers of real music is still going, but about how the masses react to situations.
Nothing is more so than in the market.
After the crash of ’87, every anniversary date for the next two years, the market would fall for no specific reason, just the emotion of the dramatic 25 per cent fall that had happened on October 18, 1987.
By the time a few people had observed this fact and gone short in anticipation of this anniversary event in 1990, the market did just the opposite and went up!
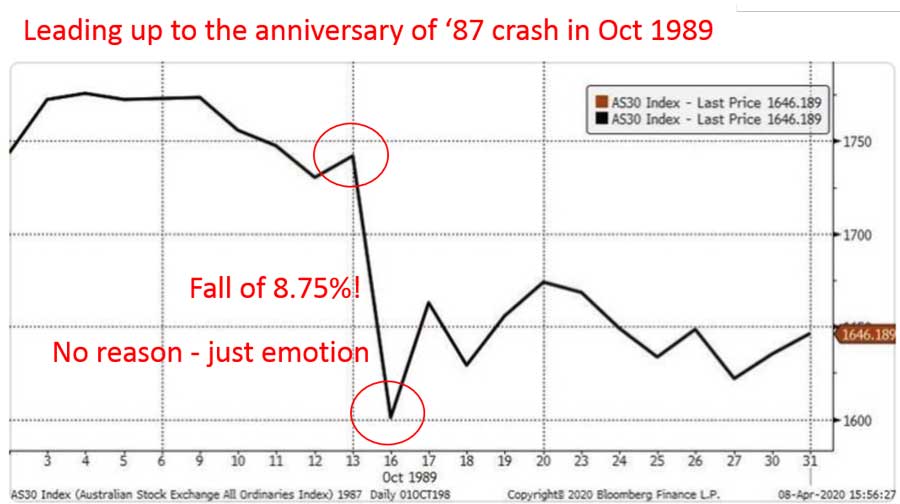
Nothing like the market doing the unexpected and shaking out a few of the ‘Johnny come lately’s’, who were predicting to me what will (or should) happen on the anniversary date.
Around this time, we would pay good coin to have hand drawn graphs produced for us on the commodities, currencies and major market indices we followed. They would be drawn in pencil, on green graph paper, with an ‘X’ to show a downward tick and an ‘O’ represented an upward tick.
The reason we did this was because the person who did it for us, could get a feel for trends by physically putting pencil to paper. In my book, a graph can only show the past and certain trends but not the future.
Once they identified a trend, they would come to us and tell us. “Oil is finding support here and the USD is seeing resistance here,” they would tell us. As they are both collated, we could position ourselves and our clients accordingly.
Nothing like coming up with a presentation which included our bespoke graphs to impress and prise open the cheque book of even the tightest and hardest of all clients on the planet, a Scottish born fund manager. It gave us the edge over everyone else.
These days, every man and his dog can pay for software programs which produce graphs overlayed with all sorts of ‘scientific’ and ‘mathematical’ theories.
If everyone trading can now get the exact same information (which we would hand produce pre-internet) with the push of a button, then the information can no longer produce an edge.
If you want to see what I mean, watch this gung ho chartist trader in action.
This remembers me on this video – nobody want's to be that guy 😀 pic.twitter.com/ORWnBMKQaz
— DeltaMike 🇺🇦 +🇬🇪 =🇪🇺 (@MineDelta1234) March 6, 2020
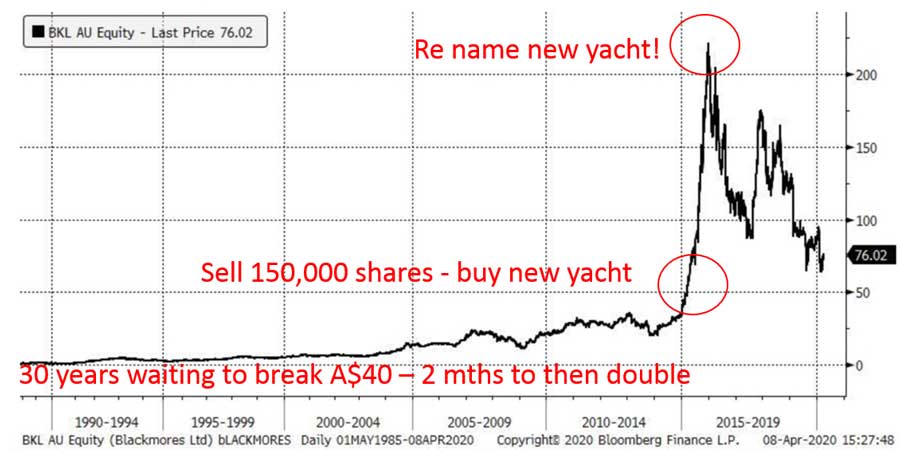
One ASX-listed company which can best demonstrate how the masses react to movements in a single company’s share price, is vitamin producer Blackmores (ASX:BKL).
Founded in 1938, they listed on the ASX in 1985 and for the next 30 years they never really traded over $40 a share.
However, in March 2015, they nudged $50 for the first time and this event nudged the chairman Marcus Blackmore to sell 150,000 of his shares at $47.
We would always advise that you need to leave something on the table for the next person but Marcus left a bit more than something.
His reason for selling was, and I quote, “I wish to advise that I have sold 150,000 Blackmores shares to reduce my level of personal debt and to fund the purchase of a new yacht. It is my intention to remain a significant shareholder in the company.”
The headlines that followed his sale, prompted the masses to delve into the company’s fundamentals a bit more and they liked what they saw.
Within two months the shares were trading at just under $80 each. So, 30 years at under $40 and just two months to get to $80. This meant that out of Marcus trousering a cool $7m, he had in two months, left another $7m on the table.
But it gets worse for him.
After his sale in March the shares went on a massive run, hitting an all-time high of $217 on December 31, 2015 even though nothing had really happened to warrant such a run, otherwise why would Marcus sell when he did?
Human nature dictates that it is illogical to buy something that has not done anything price wise for 30 years and then, once it starts moving up, you have to buy, as the fear of missing out takes over.
Marcus had managed to leave $25m on the table in order to pay off some debt and to buy himself a new yacht.
So, if you see a yacht called ‘Oh Dear’ sailing around Sydney harbour, with a grumpy but healthy glowing captain in charge, I bet I know his name.
The Secret Broker can be found on Twitter here @SecretBrokerAU or on email at [email protected].
Feel free to contact him with your best stock tips and ideas.
READ MORE from The Secret Broker:
When shareholders become divided by the ‘n’ in dividends
Where are the three Amigos when you need them?
Stop the world, I want to get off!
Related Stories


UNLOCK INSIGHTS
Discover the untold stories of emerging ASX stocks.
Daily news and expert analysis, it's free to subscribe.
By proceeding, you confirm you understand that we handle personal information in accordance with our Privacy Policy.


