The Secret Broker: Stop the world, I want to get off!

Pic: Stevica Mrdja / EyeEm / EyeEm via Getty Images
After 35 years of stockbroking for some of the biggest houses and investors in Australia and the UK, the Secret Broker is regaling Stockhead readers with his colourful war stories — from the trading floor to the dealer’s desk.
Well, things are still going crazy, with the Irish having to shut all their pubs on St Patrick’s Day of all days and Bunnings now cancelling the Saturday Sausage Sizzle, things are really starting to hit home.
On top of all of this, the Volatility Index (VIX) has become well, very volatile.
The VIX is used as a measurement of market volatility and it is nicknamed the ‘Fear Index’ because the bigger the swings in the market, the higher the index goes and as we know, with all of this volatility comes the next day’s attention grabbing newspaper headlines and TV news.
When Warren Buffet says, with all the money in the world, he can buy almost anything he wants but he cannot buy time, he means in the real world.
In the financial world you actually can sell time, via instruments known as Exchange Traded Options (ETO) and these instruments happen to have the VIX index built into their valuations.
When we were younger boys about town, we would actually sell time via these ETOs and as this ‘Fear Index’ or VIX is used when calculating option prices, we would short them when we could see some blood on the floor and then wait for normality to come back.
As a rule of thumb, we would sell options when the ‘Fear Index’ started to nudge the 35 level, pony up some margin capital and wait for things to settle down and for the index to fall back to ‘normal historic levels’, which was around the 15 to 20 level.
Once set, we would pray that we had enough funds to cover the margin calls, because if the position went against us and we could not stump up any more margin funds, we would be automatically sold out. Also, the exchanges can squeeze margin ratios against you, to keep confidence in counter party risk.
If you have a look at this graph, you will see what happened to the VIX in 1987 and how it came back down to ‘normal levels’.
As I said last week, the quickness of the ’87 crash meant that it was more of a ‘Wham Bam, thank you Ma’am’ type of move, where as this time around it is death by 1000 cuts.
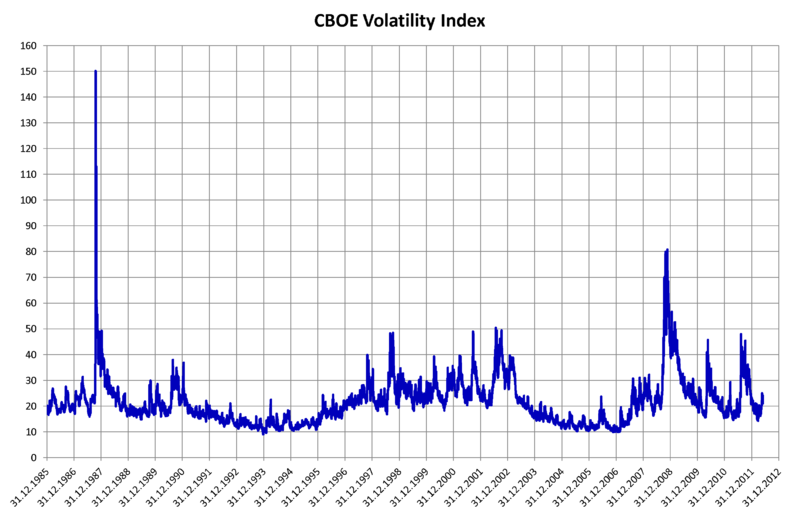
It’s this current seesaw of daily index movements which is prolonging the index coming back down to normality and you can use it, like me, as your gauge to know when things are starting to settle back down. Just Google ‘CBOE VIX’ and you can see its daily movement.
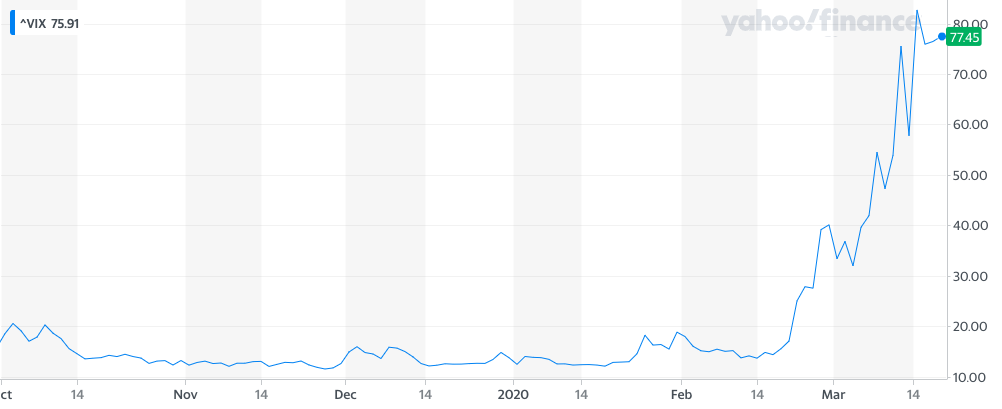
Now compare the above graph to this graph below and you will see how you wish you were going back in time Marty McFly style, as you would now know what to do.
Massive position volatility means massive margin calls and anything that has liquidity, like gold and US 10-year treasury bonds, are being sold down to cover off margin calls.
So, the markets are going to continue with this volatility until the tree is shaken a bit more and a few hedge funds are stopped out of their losing positions.
As for us, in our young buck trading days, we would have been closed out long ago as our lack of margin cash would have had us automatically stopped out and as it has gone up so violently, we would have just been the tip of the iceberg.
More pain to come I’m afraid with the only good news being that ALDI have cans of Guinness on special because the pub closing has caused a glut (without any toilet paper type limitations) and that the price at the petrol pump has fallen.
By the way a VIX at 20 is pricing in a +/- 1 per cent average index movement over 30 days and at 60 it’s +/- 4 per cent average over 30 days.
What a Craic, not.
The Secret Broker can be found on Twitter here @SecretBrokerAU or on email at [email protected].
Feel free to contact him with your best stock tips and ideas.
READ MORE from The Secret Broker:
What my gut feeling tells me this time around
You cannot be Sirius
If a virus doesn’t get your portfolio, Silicon Valley will
Related Stories


UNLOCK INSIGHTS
Discover the untold stories of emerging ASX stocks.
Daily news and expert analysis, it's free to subscribe.
By proceeding, you confirm you understand that we handle personal information in accordance with our Privacy Policy.


