High Voltage: Which battery metal moons next?
Pic: Bloomberg Creative / Bloomberg Creative Photos via Getty Images
Our High Voltage column wraps all the news driving ASX stocks with exposure to lithium, cobalt, graphite, nickel and vanadium.
Last week, ASX lithium stocks went mental. The spark was Pilbara Minerals (ASX:PLS) with its announcement that the first auction of spodumene — a lithium precursor — had gone off at an amazing $US1,250t.
The momentum has carried into the new week, with several explorers mentioned in our ‘Cheapest lithium-facing stocks on the ASX’ yarn making gains on Monday.
But there are other battery metals with huge exposure to the EV thematic. Is there opportunity for graphite, nickel, cobalt, or rare earths stocks to go on a similar run?
Most probably – with sentiment this high, all it would take is a ‘Pilbara Minerals-like’ catalyst.
Let’s look at the current state of play.
GRAPHITE
Demand from the steelmaking and battery sectors is skyrocketing, but a graphite price blowout is being held back by one main thing — high freight prices and substantial shipping delays from major producer and exporter China.
“Whilst industrial and battery end-market demand improved in June, persistently high freight prices and substantial delays continued to place a cap on demand for exported material from China,” Benchmark Mineral Intelligence writes.
“International consumers [are] keen to explore alternative sources and shipping routes rather than face shipping costs and logistical challenges FOB China.
“As a result, there was little room for Chinese producers to negotiate higher prices, despite increased demand.”
Market contacts remarked that, in many cases, freight pricing was still rising. This could begin to impact African graphite sources, which to date have been somewhat sheltered from the highest prices.
There is good news because, regardless of these issues, batteries still need graphite.
Market sources told Benchmark of “improving international market activity as consumers and traders alike have been forced to re-stock inventory regardless of high costs [emphasis ours] after an extended period of disruption”.
COBALT
As the EV sector ramps up in the coming years Benchmark is forecasting the cobalt market to move into structural deficit.
Prices are already responding.
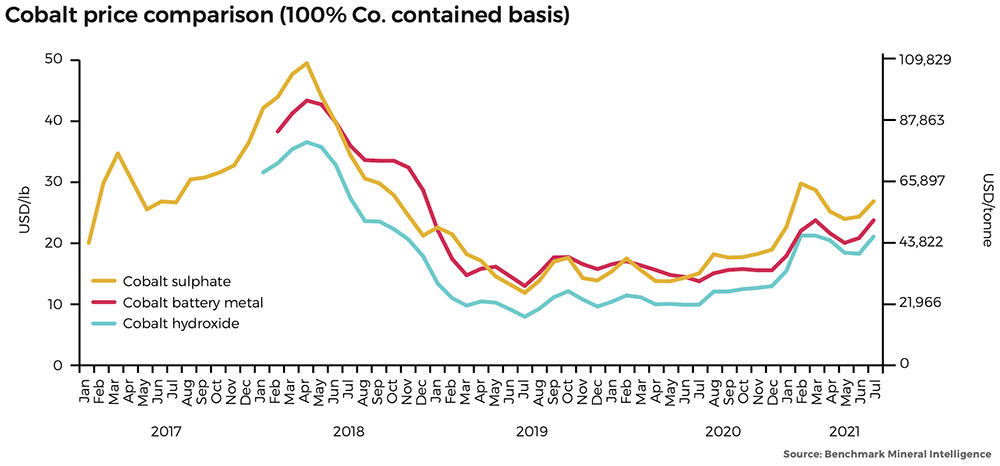
Cobalt hydroxide and cobalt sulphate prices recorded gains of 15.6% and 10.6% respectively in July.
Moving into the second half of the year, the outlook for both battery and industrial demand is set to increase on improving macroeconomic conditions and surging EV sales globally, Benchmark says.
RARE EARTHS
Rare earths are also running hot. In the June quarter Lynas (ASX:LYC) – the only scale producer of separated rare earths outside China – raked in record sales revenue of $185.9m.
This reflected strong market pricing as end users and governments around the world “continue to recognise the need for a diversified supply of responsible rare earth materials” outside China.
“Despite the global shortage of semi-conductors which affects all industries and in particular, the automotive industry, the NdFeB market is experiencing very strong growth, supporting the demand for NdPr and the HRE produced by Lynas,” the company said.
“At the same time, the demand for catalyst from the automotive and the FCC sectors is back to its pre-COVID levels.
“While prices experienced some decrease through the quarter, we perceive this as a normal correction after the sharp and speculative increases seen in the previous months.
“Prices strengthened again in July.”
NICKEL
In March, Chinese nickel giant Tsingshan announced plans to supply 100,000 tonnes of nickel ‘matte’ converted from lower quality nickel pig iron (NPI) to battery midstream majors CNGR and Huayou Cobalt.
News that Tsingshan was about to supply a big chunk of the current and predicted battery nickel shortfall with converted ‘class 2’ nickel — largely avoided due to higher conversion costs and an elevated carbon footprint – was enough to send shockwaves through the red-hot nickel market.
Should nickel investors be worried? Probs not.
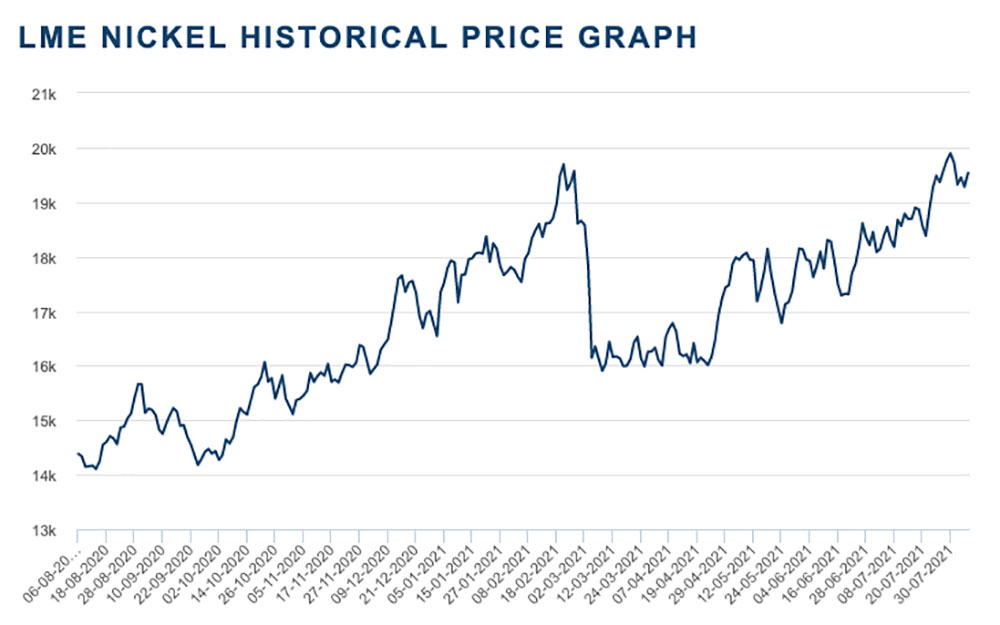
Nickel demand from the lithium-ion battery industry continued to surge in July, as leading automakers boosted mid-to-long term EV commitments.
The most notable example was Tesla’s long-term supply agreement for class 1 nickel with BHP.
This is the first public deal of its kind for a major Western automaker.
“For Tesla, the BHP deal adds to two more nickel supply deals that Tesla has likely secured from 2022 onwards, with Prony Resources and Vale,” Benchmark says.
“Across these three deals, Benchmark estimates Tesla could have secured 55,000tpa of nickel, enough to produce up to 1.25m standard range Model 3 vehicles annually using high nickel NCM technology.
“While concerns over tight nickel supply for the battery industry were seemingly eased in March 2021 — following the announcement Tsingshan would convert some of its nickel pig iron (NPI) output to nickel matte, Tesla’s latest agreement with BHP speaks to Western automakers’ concerns over the ESG credentials of Indonesian nickel.”
The market remains super tight, Benchmark says.
“Industry contacts reported persistent tightness in nickel sulphate supply, amidst burgeoning demand from the battery industry and limited raw material availability, with demand for nickel briquettes remaining particularly robust owing to the continued difficulty in procuring MHP and other intermediates,” it says.
VANADIUM
Vanadium demand is making a comeback as steel consumption soars, in China and overseas.
92% of vanadium consumption is used to strengthen steel. Of the remainder, most is used in aerospace alloys and chemical catalysts, and 1% goes into vanadium redox flow batteries (VRFBs).
Roskill’s base case is that by 2030, 10% of vanadium demand is going to come from batteries.
The market is going to shift into deficit in 2021, Roskill’s steel alloys principal consultant Erik Sardain says.
“Moving forward in the next couple of years, supply is likely to remain tight in 2022 and 2023 until new projects come online from 2024,” he says.
Here’s how a basket of ASX stocks with exposure to lithium, cobalt, graphite, nickel, and vanadium are performing>>>
Scroll or swipe to reveal table. Click headings to sort. Best viewed on a laptop:
| CODE | COMPANY | 1 WEEK RETURN % | 1 MONTH RETURN % | 6 MONTH RETURN % | 1 YEAR RETURN % | SHARE PRICE [INTRADAY MON] | MARKET CAP |
|---|---|---|---|---|---|---|---|
| WKT | Walkabout Resources | 9 | -6 | 60 | 37 | 0.24 | $ 97,843,547.21 |
| VRC | Volt Resources | 4 | -17 | 81 | 61 | 0.029 | $ 61,001,289.63 |
| BOA | Boadicea Resources | 2 | 0 | -11 | 32 | 0.23 | $ 17,093,976.90 |
| GXY | Galaxy Resources | 5 | 30 | 83 | 284 | 4.88 | $ 2,447,440,999.52 |
| GLN | Galan Lithium | 22 | 35 | 148 | 743 | 1.265 | $ 321,346,481.98 |
| ARN | Aldoro Resources | 10 | 23 | 98 | 312 | 0.515 | $ 38,454,755.03 |
| FFX | Firefinch | 6 | 8 | 118 | 183 | 0.425 | $ 391,416,472.38 |
| SGQ | St George Min | 0 | -3 | -32 | -29 | 0.068 | $ 40,064,983.72 |
| VUL | Vulcan Energy | 29 | 61 | 40 | 2227 | 12.68 | $ 1,441,058,247.25 |
| ORE | Orocobre Limited | 4 | 31 | 77 | 161 | 8.55 | $ 2,920,136,522.56 |
| STK | Strickland Metals | -16 | -9 | 41 | 11 | 0.041 | $ 45,384,487.93 |
| MNS | Magnis Energy Tech | 50 | 47 | 23 | 103 | 0.405 | $ 361,230,336.59 |
| PLS | Pilbara Min | 19 | 42 | 113 | 443 | 2.1 | $ 6,064,097,714.40 |
| PRL | Province Resources | 11 | -9 | 650 | 372 | 0.15 | $ 163,256,922.60 |
| QPM | Queensland Pacific | 15 | 27 | 192 | 850 | 0.19 | $ 262,004,560.55 |
| GAL | Galileo Mining | 13 | 31 | -8 | -1 | 0.34 | $ 48,654,409.70 |
| MAN | Mandrake Res | -7 | -43 | -1 | 116 | 0.082 | $ 35,114,377.51 |
| FGR | First Graphene | -16 | -21 | -27 | 78 | 0.205 | $ 115,142,957.79 |
| LIT | Lithium Australia NL | 15 | 20 | -12 | 107 | 0.1325 | $ 129,858,762.20 |
| ADD | Adavale Resource | 17 | -14 | 11 | 360 | 0.069 | $ 19,790,165.66 |
| COB | Cobalt Blue | -10 | -7 | -16 | 145 | 0.27 | $ 76,831,117.16 |
| NMT | Neometals | 13 | 35 | 119 | 314 | 0.745 | $ 394,831,005.12 |
| BKT | Black Rock Mining | 3 | 0 | 7 | 198 | 0.155 | $ 131,699,232.23 |
| CLA | Celsius Resource | -13 | -22 | -48 | 33 | 0.028 | $ 29,322,386.27 |
| MIN | Mineral Resources | -7 | 4 | 68 | 108 | 58.88 | $ 11,125,986,138.90 |
| S2R | S2 Resources | -15 | 4 | -24 | 4 | 0.14 | $ 50,382,588.64 |
| EUR | European Lithium | 15 | 17 | 1 | 51 | 0.068 | $ 63,507,621.07 |
| TKL | Traka Resources | -7 | -19 | -38 | -55 | 0.013 | $ 7,512,617.31 |
| MLX | Metals X Limited | -11 | 11 | 44 | 195 | 0.245 | $ 231,352,847.09 |
| GBR | Greatbould Resources | 6 | 9 | 126 | 95 | 0.093 | $ 34,461,290.88 |
| AQD | Ausquest Limited | -9 | -17 | 0 | -26 | 0.02 | $ 16,463,796.62 |
| SYA | Sayona Mining | 28 | 7 | 164 | 981 | 0.105 | $ 585,859,022.39 |
| GME | GME Resources | 0 | 4 | -33 | 30 | 0.052 | $ 29,513,947.29 |
| CXO | Core Lithium | 31 | 53 | 14 | 700 | 0.36 | $ 422,682,211.44 |
| CWX | Carawine Resources | -6 | -2 | 5 | 10 | 0.225 | $ 24,500,227.95 |
| IGO | IGO Limited | 2 | 17 | 50 | 93 | 9.53 | $ 7,390,933,854.88 |
| MCR | Mincor Resources NL | 1 | 22 | 16 | 60 | 1.245 | $ 544,782,537.18 |
| ARU | Arafura Resource | 2 | 6 | -42 | 61 | 0.1275 | $ 175,031,724.01 |
| NTU | Northern Min | 5 | 24 | -16 | 64 | 0.041 | $ 193,668,518.64 |
| OZL | OZ Minerals | -4 | 0 | 19 | 58 | 22.35 | $ 7,465,197,892.56 |
| ARL | Ardea Resources | 6 | -4 | 19 | -9 | 0.53 | $ 73,158,136.07 |
| BHP | BHP Group Limited | -3 | 6 | 19 | 30 | 51.95 | $ 153,478,857,627.40 |
| LKE | Lake Resources | 32 | 66 | 105 | 1608 | 0.615 | $ 709,023,035.82 |
| DEV | Devex Resources | -15 | -27 | 4 | 21 | 0.235 | $ 76,958,491.75 |
| BUX | Buxton Resources | -19 | -16 | 48 | 38 | 0.105 | $ 14,285,820.36 |
| LYC | Lynas Rare Earths | 4 | 35 | 55 | 211 | 7.61 | $ 6,830,175,628.82 |
| AXE | Archer Materials | -4 | 39 | 71 | 265 | 1.44 | $ 347,252,482.65 |
| BAR | Barra Resources | -5 | 0 | -21 | -21 | 0.019 | $ 13,213,357.97 |
| ESS | Essential Metals | 11 | 41 | 7 | 60 | 0.155 | $ 34,138,941.00 |
| LML | Lincoln Minerals | 0 | 0 | 0 | 14 | 0.008 | $ 4,599,869.49 |
| AJM | Altura Mining | 0 | 0 | 0 | 0 | 0.07 | $ 209,037,029.25 |
| ATM | Aneka Tambang | 0 | 0 | 0 | 0 | 1 | $ 1,303,649.00 |
| GED | Golden Deeps | -15 | -15 | -15 | -8 | 0.011 | $ 9,310,217.28 |
| ADV | Ardiden | 63 | 63 | -46 | 0 | 0.013 | $ 23,642,896.38 |
| HWK | Hawkstone Mng | 32 | 12 | -12 | 106 | 0.037 | $ 58,203,340.13 |
| RFR | Rafaella Resources | 2 | 4 | -1 | 43 | 0.097 | $ 17,012,399.38 |
| INF | Infinity Lithium | 3 | -13 | -57 | 16 | 0.0955 | $ 40,291,455.60 |
| QXR | Qx Resources Limited | 0 | -19 | -28 | -24 | 0.013 | $ 8,662,710.17 |
| AUZ | Australian Mines | -10 | -17 | -22 | -3 | 0.019 | $ 86,071,182.28 |
| RXL | Rox Resources | -2 | -12 | -24 | -56 | 0.41 | $ 66,195,197.88 |
| PAM | Pan Asia Metals | 32 | 37 | -3 | 0.185 | $ 9,121,969.48 | |
| SYR | Syrah Resources | 7 | 48 | 35 | 267 | 1.505 | $ 762,263,553.69 |
| BSX | Blackstone | -12 | 7 | -25 | 0 | 0.38 | $ 131,073,715.05 |
| TMT | Technology Metals | 4 | 16 | 7 | 115 | 0.365 | $ 51,811,429.67 |
| SRI | Sipa Resources | 5 | 7 | -9 | -39 | 0.058 | $ 10,771,335.78 |
| AGY | Argosy Minerals | 21 | 26 | -9 | 184 | 0.145 | $ 181,289,397.08 |
| LPI | Lithium Pwr Int | 17 | 47 | 9 | 62 | 0.315 | $ 97,850,200.18 |
| CHN | Chalice Mining | -7 | -14 | 66 | 520 | 6.79 | $ 2,449,390,969.20 |
| LEG | Legend Mining | 6 | -11 | -19 | -38 | 0.093 | $ 256,227,622.05 |
| HXG | Hexagon Energy | 1 | -15 | -40 | 5 | 0.069 | $ 31,220,967.89 |
| TNG | TNG Limited | 3 | 12 | -26 | 3 | 0.074 | $ 89,963,786.88 |
| EGR | Ecograf Limited | 28 | 56 | 32 | 1286 | 0.915 | $ 427,341,786.05 |
| MOH | Moho Resources | 0 | -11 | -14 | -53 | 0.068 | $ 6,919,451.93 |
| ASN | Anson Resources | 25 | 31 | -2 | 345 | 0.089 | $ 82,271,703.06 |
| HAS | Hastings Tech Met | 8 | 19 | -4 | 79 | 0.215 | $ 356,383,329.53 |
| AVZ | AVZ Minerals | 16 | 43 | 16 | 231 | 0.215 | $ 707,631,322.86 |
| INR | Ioneer | 15 | 25 | 16 | 276 | 0.47 | $ 894,972,543.47 |
| PNN | PepinNini Minerals | 17 | 19 | -30 | 97 | 0.35 | $ 16,810,752.75 |
| BEM | Blackearth Minerals | 29 | 29 | 52 | 207 | 0.135 | $ 27,944,101.51 |
| CNJ | Conico | 28 | 181 | 97 | 462 | 0.073 | $ 63,229,325.83 |
| AZS | Azure Minerals | -2 | -6 | -51 | 44 | 0.245 | $ 75,762,751.65 |
| AVL | Aust Vanadium | 8 | 24 | 4 | 136 | 0.026 | $ 70,347,811.54 |
| LPD | Lepidico | 40 | 62 | -25 | 200 | 0.021 | $ 141,497,896.26 |
| CTM | Centaurus Metals | 2 | 17 | 11 | 82 | 0.945 | $ 326,542,599.40 |
| LTR | Liontown Resources | -1 | 12 | 129 | 632 | 0.915 | $ 1,779,225,749.40 |
| POS | Poseidon Nick | -22 | 14 | 40 | 133 | 0.105 | $ 309,035,633.72 |
| VMC | Venus Metals Cor | 0 | -10 | -23 | -29 | 0.18 | $ 26,438,769.53 |
| JRV | Jervois Mining | -5 | -14 | 1 | 98 | 0.46 | $ 516,093,112.83 |
| NIC | Nickel Mines Limited | -2 | 4 | -13 | 77 | 1.0775 | $ 2,753,956,810.85 |
| AOU | Auroch Minerals | -6 | 14 | -28 | 168 | 0.1875 | $ 53,721,258.49 |
| REE | Rarex Limited | -1 | 32 | -21 | 55 | 0.099 | $ 43,534,320.40 |
| VML | Vital Metals Limited | 27 | 15 | 41 | 417 | 0.062 | $ 240,945,518.87 |
| ARR | American Rare Earths | 41 | 43 | 21 | 380 | 0.12 | $ 36,152,374.23 |
| EMH | European Metals Hldg | -5 | 3 | 38 | 472 | 1.66 | $ 208,147,144.00 |
| PSC | Prospect Res | 11 | 39 | 97 | 154 | 0.355 | $ 139,986,090.28 |
| RLC | Reedy Lagoon Corp. | 25 | 18 | 11 | 100 | 0.02 | $ 8,460,470.99 |
| AML | Aeon Metals . | 0 | -21 | -50 | -61 | 0.057 | $ 44,299,044.25 |
| G88 | Golden Mile Res | 4 | -5 | 17 | -16 | 0.054 | $ 7,701,008.04 |
| JRL | Jindalee Resources | 28 | 29 | 61 | 825 | 3.14 | $ 166,620,373.92 |
| PGM | Platina Resources | 1 | -5 | 53 | 56 | 0.081 | $ 37,791,263.75 |
| PAN | Panoramic Resources | -3 | 13 | 9 | 140 | 0.175 | $ 348,655,380.68 |
| TLG | Talga Group | -1 | 3 | -8 | 154 | 1.335 | $ 409,360,373.10 |
| IXR | Ionic Rare Earths | 0 | -6 | -17 | 186 | 0.03 | $ 94,987,186.39 |
| VR8 | Vanadium Resources | 4 | -13 | 38 | 116 | 0.054 | $ 20,922,205.25 |
| PLL | Piedmont Lithium Inc | 7 | -23 | 19 | 735 | 0.785 | $ 454,131,974.00 |
| ESR | Estrella Res | -11 | -15 | -51 | 225 | 0.039 | $ 45,319,705.86 |
| GW1 | Greenwing Resources | 4 | 11 | -17 | 67 | 0.25 | $ 21,003,548.94 |
| ALY | Alchemy Resource | 7 | 0 | -17 | -19 | 0.015 | $ 10,083,651.80 |
| HNR | Hannans | 14 | 14 | 0 | 14 | 0.008 | $ 16,519,840.34 |
| TON | Triton Min | 3 | -6 | -43 | -39 | 0.033 | $ 37,437,446.21 |
| IPT | Impact Minerals | -13 | -7 | -35 | -38 | 0.013 | $ 27,321,231.41 |
| SLZ | Sultan Resources | -3 | -10 | -10 | 3 | 0.18 | $ 12,516,190.02 |
| RNU | Renascor Res | 34 | 43 | 168 | 519 | 0.099 | $ 172,841,471.98 |
| PUR | Pursuit Minerals | 0 | -12 | 88 | 258 | 0.06 | $ 56,547,848.88 |
| SBR | Sabre Resources | 0 | -11 | -43 | 33 | 0.004 | $ 6,732,254.60 |
| SRL | Sunrise | 6 | 18 | -22 | 34 | 2.095 | $ 190,280,979.09 |
| MLS | Metals Australia | 33 | 0 | 0 | -33 | 0.002 | $ 8,454,376.09 |
| CZN | Corazon | -7 | 2 | -30 | 5 | 0.042 | $ 8,325,219.90 |
| MRC | Mineral Commodities | -6 | -21 | -63 | -39 | 0.145 | $ 78,248,795.70 |
| GL1 | Globallith | 13 | 15 | 0.315 | $ 26,247,889.32 | ||
| NKL | Nickelx | 3 | 11 | 0.195 | $ 10,165,000.00 | ||
| PEK | Peak Resources | -20 | -8 | -16 | 163 | 0.092 | $ 149,892,160.67 |
| NWC | New World Resources | -5 | -13 | 55 | 153 | 0.076 | $ 115,772,231.73 |
| BMM | Balkanminingandmin | 50 | 0.63 | $ 19,825,000.00 | |||
| BRB | Breaker Res NL | -3 | -6 | -24 | -42 | 0.155 | $ 52,134,548.64 |
| ARN | Aldoro Resources | 10 | 23 | 98 | 312 | 0.515 | $ 38,454,755.03 |
| NMT | Neometals | 13 | 35 | 119 | 314 | 0.745 | $ 394,831,005.12 |
| IGO | IGO Limited | 2 | 17 | 50 | 93 | 9.53 | $ 7,390,933,854.88 |
| CHR | Charger Metals | 139 | 0.55 | $ 13,760,000.43 | |||
| AAJ | Aruma Resources | 24 | 6 | -24 | -18 | 0.068 | $ 6,251,694.69 |
| PAM | Pan Asia Metals | 32.1429 | 37.037 | -2.6316 | 0.185 | $ 9,121,969.48 |

Related Stories


UNLOCK INSIGHTS
Discover the untold stories of emerging ASX stocks.
Daily news and expert analysis, it's free to subscribe.
By proceeding, you confirm you understand that we handle personal information in accordance with our Privacy Policy.


