High Voltage: Lithium-ion battery supply needs to increase by 400pc (at least) by 2030, WoodMac says
Pic: Getty
- Battery supply will not meet demand until 2023, under Wood Mackenzie’s base case (most likely) scenario
- Global battery manufacturers are responding with massive expansion plans
- Major ASX movers this week: Australian Vanadium, Latin Resources, Ardea Resources
Our High Voltage column wraps all the news driving ASX stocks with exposure to lithium, cobalt, graphite, nickel, rare earths, manganese, magnesium, and vanadium.
Raw material shortages and a thriving electric vehicle sector means battery supply will not meet demand until 2023, under Wood Mackenzie’s base case (most likely) scenario.
The electric vehicle (EV) market accounts for almost 80% of lithium-ion battery demand, Wood Mackenzie consultant Jiayue Zheng says.
“The lithium-ion battery market already encountered shortages last year due to thriving EV market demand and rising raw material prices,” Zheng says.
“Under our base case scenario, we project that battery supply will not meet demand until 2023.”
Battery capacity about to explode
Global battery manufacturers are responding with massive expansion plans, taking total capacity to more than 5,500 GWh by 2030 across 300 manufacturing facilities.
That’s a five-fold increase on 2021 levels, WoodMac says, with Europe making the biggest gains and eating into China’s market share.
“The Asia Pacific region, led by China, accounted for 90% of the world’s battery manufacturing in 2021,” Zheng says.
“By the end of decade, the region is expected to reduce its share to 69%.
“While North America’s cell capacity could expand 10-fold by 2030, it still lags Europe which is on track to overtake North America in 2022 and will account for over 20% of global capacity by 2030 through more rapid expansion.”
The top 15 manufacturers by planned capacity put into operation a total of about 200 GWh in 2021, and the cumulative capacity reached 600 GWh.
Meanwhile, 3,000 GWh of capacity is at the planning or construction stage. WoodMac expects many more new plant announcements in 2022.
Important to note that for years, battery metals miners and analysts have adjusted their demand projections regularly to the upside.
One example:

This was big call from Benchmark Mineral Intelligence boss Simon Moores at the time, being October last year.
And yet prices in China were up around $US70,000/t mid March 2022, with no downside in sight.
LFP to beat NCM by 2028
Another trend to watch is the growing prominence of lithium iron phosphate (LFP) batteries as nickel-cobalt-manganese (NCM) batteries lose market share, WoodMac says.
“Historically, the EV and energy storage system markets have mostly deployed NCM batteries given their availability and maturity,” Zheng says.
“In 2021, NCM still accounted for half of the market share.
“However, LFP batteries began tapping into the market with competitive cost, long lifecycle, and high safety performance, making them an attractive option for both power and energy applications.
“Wood Mackenzie projects that LFP’s market share will surpass NCM in 2028.”
Battery Metals Winners and Losers
Here’s how a basket of ASX stocks with exposure to lithium, cobalt, graphite, nickel, rare earths, magnesium, manganese, and vanadium is performing>>>
Battery metals stocks missing from our list? Shoot a friendly mail to [email protected]
| CODE | COMPANY | 1 WEEK RETURN % | 1 MONTH RETURN % | 6 MONTH RETURN % | 1 YEAR RETURN % | SHARE PRICE | MARKET CAP |
|---|---|---|---|---|---|---|---|
| AVL | Aust Vanadium | 66% | 71% | 152% | 123% | 0.058 | $194,712,384.99 |
| LRS | Latin Resources | 51% | 63% | 48% | 15% | 0.062 | $99,494,478.81 |
| ARL | Ardea Resources | 43% | 52% | 186% | 150% | 1.205 | $205,140,704.12 |
| GL1 | Global Lithium | 36% | 55% | 500% | 0% | 2.31 | $336,217,817.78 |
| ARR | American Rare Earths | 35% | 35% | 186% | 410% | 0.5 | $176,919,221.25 |
| ESS | Essential Metals | 33% | 30% | 118% | 300% | 0.48 | $108,695,137.52 |
| CLA | Celsius Resource | 32% | -7% | 9% | -44% | 0.025 | $30,536,644.20 |
| LKE | Lake Resources | 31% | 81% | 218% | 390% | 1.64 | $2,007,363,046.18 |
| WR1 | Winsome Resources | 30% | 19% | 0% | 0% | 0.46 | $61,851,597.24 |
| AQD | Ausquest | 29% | 22% | 29% | 5% | 0.022 | $17,328,133.68 |
| ARU | Arafura Resources | 29% | 33% | 83% | 36% | 0.265 | $372,100,159.68 |
| EUR | European Lithium | 26% | 17% | 35% | 80% | 0.1225 | $143,985,549.88 |
| RNU | Renascor Resources | 23% | 18% | 141% | 160% | 0.325 | $552,046,777.91 |
| RGL | Riversgold | 21% | 77% | 64% | -4% | 0.046 | $16,727,274.90 |
| AGY | Argosy Minerals | 20% | 29% | 171% | 320% | 0.42 | $523,630,558.68 |
| IPX | Iperionx | 20% | 29% | 4% | 32% | 1.17 | $153,437,340.10 |
| 1MC | Morella Corporation | 19% | 52% | -49% | -49% | 0.032 | $165,638,847.55 |
| MLS | Metals Australia | 18% | 96% | 125% | 125% | 0.09 | $27,868,463.32 |
| AVZ | AVZ Minerals | 18% | 28% | 276% | 372% | 1.015 | $3,279,459,926.00 |
| INR | Ioneer | 17% | -5% | -12% | 31% | 0.5575 | $1,139,348,877.46 |
| CXO | Core Lithium | 17% | 56% | 206% | 433% | 1.225 | $2,106,345,464.21 |
| LTR | Liontown Resources | 17% | 24% | 37% | 358% | 1.8475 | $3,836,394,096.50 |
| ALY | Alchemy Resource | 17% | 27% | 2% | -5% | 0.014 | $12,380,483.57 |
| CMX | Chemxmaterials | 17% | 5% | 0% | 0% | 0.21 | $9,963,261.47 |
| NC1 | Nicoresourceslimited | 17% | 20% | 0% | 0% | 0.74 | $65,437,501.50 |
| TMT | Technology Metals | 16% | 23% | -1% | 5% | 0.395 | $82,482,862.95 |
| WMG | Western Mines | 16% | 46% | 38% | 0% | 0.255 | $7,143,337.50 |
| LPI | Lithium Pwr Int | 16% | 16% | 153% | 153% | 0.695 | $237,163,496.64 |
| LEL | Lithenergy | 15% | 5% | 80% | 0% | 0.98 | $43,875,000.00 |
| AZL | Arizona Lithium | 15% | 15% | 297% | 288% | 0.155 | $319,642,632.80 |
| AZL | Arizona Lithium | 15% | 15% | 297% | 288% | 0.155 | $319,642,632.80 |
| JRL | Jindalee Resources | 15% | 13% | 33% | 90% | 3.2 | $164,476,056.64 |
| COB | Cobalt Blue | 15% | 62% | 145% | 96% | 0.785 | $239,798,814.84 |
| GME | GME Resources | 14% | 24% | 34% | 25% | 0.082 | $47,519,260.96 |
| STM | Sunstone Metals | 14% | 5% | 337% | 493% | 0.083 | $183,640,720.28 |
| AAJ | Aruma Resources | 13% | -7% | -2% | 66% | 0.093 | $15,382,227.29 |
| AX8 | Accelerate Resources | 13% | 9% | 31% | -11% | 0.051 | $12,166,027.15 |
| ASN | Anson Resources | 13% | 8% | 41% | 37% | 0.13 | $122,567,913.60 |
| KFM | Kingfisher Mining | 13% | 13% | 37% | 4% | 0.26 | $8,561,250.25 |
| WIN | Widgienickellimited | 13% | 49% | 0% | 0% | 0.52 | $128,750,000.00 |
| NVA | Nova Minerals | 13% | -23% | -50% | -58% | 0.695 | $123,438,565.23 |
| QPM | Queensland Pacific | 13% | -2% | -36% | 62% | 0.1525 | $239,182,535.31 |
| MNS | Magnis Energy Tech | 13% | 9% | 57% | 55% | 0.48 | $449,090,177.99 |
| RAS | Ragusa Minerals | 13% | 8% | -11% | -11% | 0.07 | $9,424,337.25 |
| JMS | Jupiter Mines. | 13% | 26% | 23% | -8% | 0.265 | $519,132,623.75 |
| PEK | Peak Rare Earths | 13% | -5% | -7% | -21% | 0.755 | $154,848,425.27 |
| QXR | Qx Resources Limited | 13% | 66% | 425% | 294% | 0.063 | $51,513,463.90 |
| LPD | Lepidico | 13% | 13% | 44% | 38% | 0.036 | $212,583,750.36 |
| GLN | Galan Lithium | 13% | 13% | 62% | 235% | 1.575 | $464,591,530.14 |
| RR1 | Reach Resources | 13% | 13% | 0% | 145% | 0.009 | $14,346,112.18 |
| NIC | Nickel Mines Limited | 12% | -4% | 36% | -7% | 1.29 | $3,331,402,117.98 |
| ENV | Enova Mining Limited | 12% | -5% | -17% | -46% | 0.019 | $6,434,518.04 |
| CHR | Charger Metals | 12% | 4% | 35% | 0% | 0.715 | $23,283,523.12 |
| IXR | Ionic Rare Earths | 12% | 20% | 97% | 18% | 0.067 | $242,173,865.49 |
| JRV | Jervois Global | 12% | 20% | 77% | 81% | 0.8425 | $1,246,195,788.02 |
| WCN | White Cliff Min | 12% | 4% | 123% | 53% | 0.029 | $18,217,539.17 |
| SRL | Sunrise | 11% | 27% | 43% | -2% | 2.34 | $216,138,909.60 |
| BEM | Blackearth Minerals | 11% | 11% | -9% | -16% | 0.1225 | $33,793,277.75 |
| GED | Golden Deeps | 11% | -17% | -17% | 0% | 0.01 | $7,758,514.40 |
| GW1 | Greenwing Resources | 11% | -8% | 0% | -13% | 0.305 | $34,260,550.24 |
| BKT | Black Rock Mining | 11% | -2% | 42% | 104% | 0.255 | $213,710,442.65 |
| LOT | Lotus Resources | 10% | 51% | 32% | 124% | 0.37 | $351,369,263.16 |
| SYR | Syrah Resources | 10% | 5% | 34% | 30% | 1.485 | $923,401,500.36 |
| INF | Infinity Lithium | 10% | 0% | 28% | -16% | 0.16 | $62,224,416.15 |
| VUL | Vulcan Energy | 10% | 15% | -28% | 56% | 10.105 | $1,369,108,936.00 |
| GMC | Gulf Manganese Corp | 10% | 10% | 10% | 10% | 0.0055 | $27,017,241.66 |
| AVW | Avira Resources | 10% | -8% | -8% | -21% | 0.0055 | $11,653,345.00 |
| TNG | TNG Limited | 10% | 6% | -15% | -31% | 0.069 | $98,577,693.76 |
| KTA | Krakatoa Resources | 10% | 2% | -31% | -27% | 0.046 | $14,440,785.93 |
| FGR | First Graphene | 9% | -3% | -3% | -27% | 0.175 | $94,088,567.54 |
| LSR | Lodestar Minerals | 9% | 20% | 20% | 9% | 0.012 | $19,122,810.83 |
| NMT | Neometals | 9% | 38% | 100% | 362% | 1.8 | $967,884,338.94 |
| CAI | Calidus Resources | 9% | 31% | 70% | 113% | 0.935 | $376,147,702.48 |
| QEM | QEM Limited | 9% | 12% | 27% | 27% | 0.19 | $20,416,199.94 |
| EGR | Ecograf Limited | 8% | 1% | -22% | -15% | 0.575 | $263,445,073.52 |
| GSR | Greenstone Resources | 8% | 3% | 56% | 95% | 0.039 | $35,741,693.87 |
| ADV | Ardiden | 8% | 0% | 0% | -38% | 0.013 | $34,588,350.63 |
| CNJ | Conico | 8% | 8% | -78% | -63% | 0.013 | $12,002,578.49 |
| EFE | Eastern Resources | 8% | -7% | 27% | 457% | 0.052 | $49,485,425.30 |
| KAI | Kairos Minerals | 8% | 8% | -10% | 4% | 0.027 | $51,014,430.77 |
| AS2 | Askarimetalslimited | 8% | 30% | 140% | 0% | 0.48 | $18,874,362.38 |
| PLS | Pilbara Min | 8% | 2% | 43% | 181% | 2.995 | $8,543,514,133.91 |
| RLC | Reedy Lagoon Corp. | 8% | 0% | -7% | 4% | 0.028 | $14,805,645.21 |
| GSM | Golden State Mining | 8% | -2% | -38% | -40% | 0.084 | $6,480,862.83 |
| GT1 | Greentechnology | 7% | 5% | 0% | 0% | 0.8 | $86,920,000.00 |
| MQR | Marquee Resource | 7% | -9% | 57% | 69% | 0.105 | $21,423,857.60 |
| WKT | Walkabout Resources | 7% | -8% | 20% | 66% | 0.24 | $108,546,026.88 |
| ILU | Iluka Resources | 6% | -4% | 21% | 62% | 10.85 | $4,464,007,561.26 |
| EVR | Ev Resources | 6% | -6% | 70% | 46% | 0.051 | $45,373,219.48 |
| EMT | Emetals Limited | 6% | 0% | -11% | -51% | 0.017 | $13,600,000.00 |
| VML | Vital Metals Limited | 6% | 11% | -12% | -31% | 0.052 | $216,605,120.37 |
| PAM | Pan Asia Metals | 6% | 0% | 15% | 238% | 0.54 | $38,302,494.88 |
| HNR | Hannans | 6% | 3% | 21% | 355% | 0.036 | $93,825,773.14 |
| SYA | Sayona Mining | 6% | 50% | -3% | 364% | 0.18 | $1,242,397,836.75 |
| S2R | S2 Resources | 6% | -3% | 91% | 6% | 0.18 | $64,147,473.90 |
| PSC | Prospect Res | 6% | 7% | 151% | 417% | 0.905 | $381,694,904.15 |
| POS | Poseidon Nick | 6% | 3% | -4% | 52% | 0.093 | $281,884,276.39 |
| A8G | Australasian Metals | 5% | 0% | 45% | 0% | 0.5 | $19,683,542.06 |
| MLX | Metals X Limited | 5% | 17% | 110% | 186% | 0.6725 | $603,331,934.56 |
| EMN | Euromanganese | 5% | -12% | -18% | -37% | 0.42 | $114,501,275.47 |
| EMH | European Metals Hldg | 5% | -8% | -19% | -34% | 1.17 | $173,155,666.95 |
| NWM | Norwest Minerals | 5% | 25% | -10% | -15% | 0.064 | $11,017,050.61 |
| PRL | Province Resources | 5% | -26% | -33% | -33% | 0.0965 | $109,993,515.32 |
| HAS | Hastings Tech Met | 5% | -3% | 24% | 40% | 0.2725 | $476,970,566.31 |
| MIN | Mineral Resources. | 5% | 4% | 8% | 26% | 49.06 | $8,841,966,879.02 |
| TEM | Tempest Minerals | 5% | -8% | -12% | -31% | 0.022 | $8,753,819.76 |
| SCN | Scorpion Minerals | 5% | -4% | 10% | 31% | 0.068 | $18,056,914.86 |
| BUX | Buxton Resources | 5% | 26% | 74% | 72% | 0.115 | $16,326,651.84 |
| KGD | Kula Gold Limited | 5% | -8% | -4% | 18% | 0.046 | $10,113,254.70 |
| OZL | OZ Minerals | 4% | 1% | 21% | 14% | 26.32 | $8,703,371,014.00 |
| BYH | Bryah Resources | 4% | -4% | -13% | -19% | 0.048 | $10,857,944.40 |
| MCR | Mincor Resources NL | 4% | 25% | 74% | 122% | 2.23 | $1,012,285,982.40 |
| NTU | Northern Min | 4% | 4% | 33% | 33% | 0.053 | $257,558,603.85 |
| S32 | South32 Limited | 4% | 11% | 53% | 87% | 5.05 | $22,678,527,949.92 |
| HXG | Hexagon Energy | 4% | 4% | -28% | -46% | 0.054 | $23,213,800.12 |
| SRI | Sipa Resources | 4% | 8% | -11% | -5% | 0.056 | $10,866,314.56 |
| SRZ | Stellar Resources | 4% | 4% | -3% | 12% | 0.028 | $22,607,170.90 |
| LYC | Lynas Rare Earths | 3% | 20% | 57% | 69% | 10.59 | $9,267,766,659.58 |
| ZNC | Zenith Minerals | 3% | -6% | 60% | 158% | 0.335 | $110,049,329.60 |
| BHP | BHP Group Limited | 3% | 1% | 29% | 9% | 48.77 | $235,144,912,175.50 |
| LEG | Legend Mining | 3% | 3% | 9% | -42% | 0.072 | $201,124,907.63 |
| CRR | Critical Resources | 3% | -23% | 208% | 311% | 0.074 | $111,403,987.65 |
| EMS | Eastern Metals | 3% | -14% | 0% | 0% | 0.19 | $6,586,000.00 |
| LRV | Larvottoresources | 2% | -19% | 0% | 0% | 0.21 | $8,859,612.50 |
| TMB | Tambourahmetals | 2% | -6% | -4% | 0% | 0.22 | $9,268,334.55 |
| CNB | Carnaby Resource | 2% | -6% | 322% | 454% | 1.33 | $193,054,915.29 |
| LMG | Latrobe Magnesium | 2% | -6% | 291% | 260% | 0.09 | $140,758,336.49 |
| AKE | Allkem Limited | 2% | 11% | 20% | 111% | 10.41 | $6,349,754,836.56 |
| TLG | Talga Group | 2% | 6% | 0% | 1% | 1.435 | $426,586,326.60 |
| PGM | Platina Resources | 2% | -9% | -22% | 4% | 0.051 | $23,456,646.47 |
| RAG | Ragnar Metals | 2% | -13% | -13% | -47% | 0.0305 | $11,180,546.67 |
| G88 | Golden Mile Res | 2% | 19% | 33% | 23% | 0.064 | $11,073,172.99 |
| G88 | Golden Mile Res | 2% | 19% | 33% | 23% | 0.064 | $11,073,172.99 |
| CTM | Centaurus Metals | 2% | 5% | 37% | 65% | 1.305 | $530,798,218.94 |
| IGO | IGO Limited | 1% | 10% | 40% | 99% | 12.625 | $9,253,812,674.86 |
| FFX | Firefinch | 1% | 26% | 31% | 263% | 0.8175 | $960,181,003.00 |
| VIA | Viagold Rare Earth | 0% | 0% | 953% | 2400% | 2 | $166,624,808.00 |
| MRD | Mount Ridley Mines | 0% | 13% | 80% | 157% | 0.009 | $57,755,907.56 |
| CZN | Corazon | 0% | 1% | -9% | -36% | 0.032 | $12,471,702.08 |
| DEV | Devex Resources | 0% | 4% | 29% | 93% | 0.425 | $131,957,266.98 |
| ESR | Estrella Res | 0% | 0% | -28% | -55% | 0.029 | $34,819,764.66 |
| SBR | Sabre Resources | 0% | 10% | 10% | 10% | 0.0055 | $10,174,068.25 |
| TKL | Traka Resources | 0% | -17% | -23% | -41% | 0.01 | $6,887,745.61 |
| ARN | Aldoro Resources | 0% | -20% | -29% | 57% | 0.33 | $29,165,041.43 |
| RXL | Rox Resources | 0% | -2% | 3% | -31% | 0.405 | $66,731,674.07 |
| BRB | Breaker Res NL | 0% | -6% | -8% | 23% | 0.245 | $79,831,027.61 |
| ATM | Aneka Tambang | 0% | 0% | 10% | 10% | 1.1025 | $1,437,273.02 |
| LML | Lincoln Minerals | 0% | 0% | 0% | 0% | 0.008 | $4,599,869.49 |
| PUR | Pursuit Minerals | 0% | -9% | -60% | -71% | 0.02 | $18,910,983.88 |
| MOH | Moho Resources | 0% | 2% | -10% | -37% | 0.055 | $7,157,078.17 |
| AML | Aeon Metals . | 0% | 1% | -14% | -51% | 0.049 | $45,022,062.18 |
| NKL | Nickelx | 0% | 0% | -23% | 0% | 0.155 | $8,856,000.00 |
| MRR | Minrex Resources | 0% | -6% | 275% | 150% | 0.06 | $52,071,491.94 |
| AM7 | Arcadia Minerals | 0% | -10% | -12% | 0% | 0.23 | $8,048,275.00 |
| ENT | Enterprise Metals | 0% | -13% | 1% | -53% | 0.013 | $8,026,792.38 |
| AOA | Ausmon Resorces | 0% | 14% | 14% | -33% | 0.008 | $6,858,314.74 |
| CML | Chase Mining Limited | 0% | -13% | -28% | -19% | 0.013 | $6,085,725.89 |
| AKN | Auking Mining | 0% | -31% | -6% | -58% | 0.17 | $12,097,294.35 |
| MTM | Mtmongerresources | 0% | -6% | -20% | 0% | 0.16 | $5,025,704.79 |
| REE | Rarex Limited | -1% | -14% | -4% | -27% | 0.095 | $52,894,205.70 |
| AXE | Archer Materials | -1% | -6% | -53% | -5% | 0.94 | $228,999,666.48 |
| CWX | Carawine Resources | -1% | 29% | 15% | -24% | 0.2125 | $28,945,212.87 |
| VR8 | Vanadium Resources | -1% | -8% | 14% | 66% | 0.073 | $35,010,315.68 |
| AZI | Altamin Limited | -1% | -6% | -13% | -23% | 0.068 | $26,443,292.74 |
| BNR | Bulletin Res | -2% | 9% | 125% | 130% | 0.1575 | $44,261,786.05 |
| KZR | Kalamazoo Resources | -2% | -11% | -12% | -38% | 0.295 | $42,106,368.46 |
| E25 | Element 25 | -2% | -26% | -54% | -67% | 0.875 | $135,912,228.41 |
| BMM | Balkanminingandmin | -2% | -26% | -62% | 0% | 0.26 | $8,842,500.00 |
| MAN | Mandrake Res | -2% | -6% | -19% | -67% | 0.046 | $23,137,827.36 |
| LIT | Lithium Australia NL | -2% | -2% | -14% | -17% | 0.1075 | $113,632,238.06 |
| GAL | Galileo Mining | -2% | 8% | -23% | -9% | 0.215 | $35,365,933.05 |
| PNN | PepinNini Minerals | -2% | -10% | 37% | 26% | 0.41 | $25,711,691.88 |
| DTM | Dart Mining NL | -2% | -10% | -26% | -55% | 0.081 | $10,083,765.33 |
| RBX | Resource B | -3% | -3% | 0% | 474% | 0.195 | $7,989,517.00 |
| RBX | Resource B | -3% | -3% | 0% | 474% | 0.195 | $7,989,517.00 |
| BOA | Boadicea Resources | -3% | -17% | 3% | -15% | 0.19 | $14,762,980.05 |
| PLL | Piedmont Lithium Inc | -3% | 39% | 37% | -13% | 0.94 | $497,714,866.00 |
| AR3 | Austrare | -3% | -14% | -18% | 0% | 0.75 | $56,778,232.34 |
| AUZ | Australian Mines | -3% | 3% | -20% | -14% | 0.185 | $79,616,173.95 |
| AZS | Azure Minerals | -3% | -11% | 11% | -1% | 0.36 | $110,311,180.96 |
| WML | Woomera Mining | -3% | -3% | -16% | -12% | 0.0175 | $11,591,162.12 |
| FRS | Forrestaniaresources | -3% | 3% | 0% | 0% | 0.34 | $9,834,581.40 |
| TON | Triton Min | -3% | -9% | -3% | -42% | 0.029 | $36,040,741.13 |
| CMO | Cosmometalslimited | -3% | -19% | 0% | 0% | 0.145 | $3,571,400.00 |
| OMH | OM Holdings Limited | -3% | -8% | 22% | 14% | 0.855 | $624,136,719.77 |
| PVW | PVW Res | -4% | -23% | 163% | 275% | 0.525 | $37,753,171.88 |
| AOU | Auroch Minerals | -4% | 0% | -36% | -48% | 0.115 | $41,549,706.89 |
| PGD | Peregrine Gold | -4% | -23% | 26% | 0% | 0.455 | $17,566,251.38 |
| PAN | Panoramic Resources | -5% | 16% | 48% | 119% | 0.295 | $615,274,201.20 |
| SHH | Shree Minerals | -5% | 6% | 90% | 27% | 0.019 | $20,201,500.95 |
| VMC | Venus Metals Cor | -5% | -3% | 9% | -3% | 0.18 | $26,438,769.53 |
| FRB | Firebird Metals | -6% | -6% | -44% | -39% | 0.33 | $16,008,781.44 |
| RMX | Red Mount Min | -6% | -11% | -20% | -33% | 0.008 | $13,960,092.79 |
| SLZ | Sultan Resources | -6% | 7% | 0% | -18% | 0.16 | $12,909,080.30 |
| CHN | Chalice Mining | -6% | -2% | 6% | 57% | 7.13 | $2,531,317,369.62 |
| PNT | Panthermetals | -6% | 0% | 0% | 0% | 0.22 | $5,740,000.00 |
| GBR | Greatbould Resources | -6% | -3% | -6% | 263% | 0.145 | $58,943,908.49 |
| ADD | Adavale Resource | -7% | 14% | -38% | -5% | 0.042 | $14,542,316.53 |
| MRC | Mineral Commodities | -8% | -12% | -23% | -71% | 0.115 | $61,523,922.91 |
| IMI | Infinitymining | -8% | -8% | 0% | 0% | 0.165 | $9,775,000.00 |
| NWC | New World Resources | -8% | -21% | -17% | -29% | 0.054 | $86,111,252.39 |
| KOR | Korab Resources | -9% | -12% | 126% | 231% | 0.043 | $15,783,150.00 |
| STK | Strickland Metals | -9% | -15% | 13% | 158% | 0.053 | $66,551,654.00 |
| BSX | Blackstone | -9% | -12% | -10% | -13% | 0.41 | $186,582,989.48 |
| GRE | Greentechmetals | -12% | -16% | 0% | 0% | 0.215 | $6,066,499.78 |
| MMC | Mitremining | -13% | -20% | 0% | 0% | 0.165 | $4,333,616.00 |
| VRC | Volt Resources | -14% | -40% | -61% | -37% | 0.012 | $34,363,842.22 |
| IPT | Impact Minerals | -15% | -15% | -35% | -56% | 0.011 | $24,095,077.45 |
| RFR | Rafaella Resources | -18% | -20% | -47% | -57% | 0.047 | $12,453,975.30 |
| FG1 | Flynngold | -19% | -19% | -10% | 0% | 0.13 | $8,648,241.75 |
| SGQ | St George Min | -19% | 9% | -29% | -43% | 0.051 | $31,227,119.66 |
| CAE | Cannindah Resources | -25% | -12% | 205% | 498% | 0.305 | $178,803,594.79 |
| TSC | Twenty Seven Co. | -25% | -25% | -40% | -57% | 0.003 | $7,982,441.72 |
Weekly Top 3
AUSTRALIAN VANADIUM (ASX:AVL) +66%
One of three government grant beneficiaries, this time $49m to support development of AVL’s vanadium project in WA.
Vanadium is used in critical aerospace and chemical applications, is a key component in high strength and specialty steel products and has an important and growing use in vanadium redox flow batteries (VRFB).
The Australian Vanadium project is one of the most advanced vanadium projects being developed globally.
It would cost ~$US399m ($541m) to build and expects to produce 24.3 million pounds (11,022 tonnes) of V2O5 per annum at a low all-in cost of $US5.04/lb, over an initial mine life of 25 years.
A bankable feasibility study – the most advanced of all studies prior to making a final investment decision – is well underway.
AVL also has a battery subsidiary called VSUN Energy, which is focused on developing the market for VRFBs for energy storage.
“Our project will create hundreds of jobs in Australia and help to build the critical vanadium industry both locally and internationally,” AVL MD Vince Algar says.
“We have developed an innovative and collaborative approach to building a fully integrated project, from mine through to processing and end use in the steel and battery markets.
“We look forward to working with our partners to bring the Australian Vanadium Project into production and further develop downstream opportunities for green steel and the vanadium redox flow battery market.”
Australian Vanadium (ASX:AVL) share price today:
LATIN RESOURCES (ASX:LRS) +51%
The tiddler keeps hitting thick, shallow dipping spodumene (lithium ore) bearing pegmatites at the Salinas project in Brazil.
All six diamond holes drilled to date have hit a series of stacked spod peggies along a 600m stretch, LRS says.
Check out these large green spod crystals:
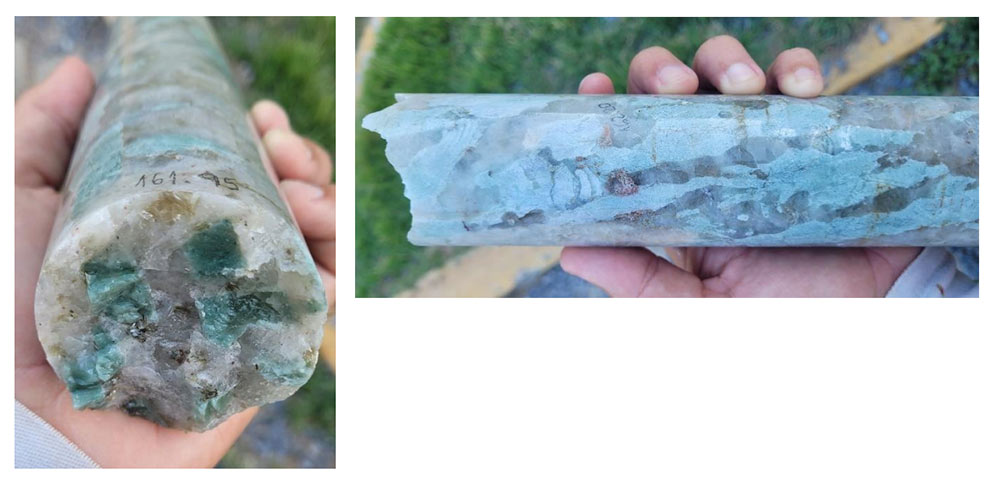
Logging has confirmed that the individual pegmatites range in true thickness to a maximum of 21.1m, with a cumulative intersection of over 36m in one hole.
“The growing thickness along with the rich spodumene pegmatites is further indication that Latin may have a very compelling lithium project on its books,” LRS MD Chris Gale says.
“We look forward to receiving the assay results from these spodumene pegmatites in the next few weeks.
“The company’s market cap is approximately $60m, and much lower than our lithium peers, which we expect offers strong potential for re-rating as positive assay results confirm the strength of the Salinas project.”
Latin Resources (ASX:LRS) share price today:
ARDEA RESOURCES (ASX:ARL) +43%
ARL’s ‘Kalgoorlie Nickel Project’ (KNP) has received Major Project Status from the Aussie Government, which helps streamline the approvals process and provides access to additional sources of potential project funding.
The KNP hosts 5.9Mt of contained nickel and 380kt of contained cobalt, making it the largest nickel-cobalt resource in the developed world.
That’s enough to power 147m electric vehicles, ARL says.
The $1.165 billion project would mine cobalt-nickel laterite ore which will undergo a process to produce Mixed Hydroxide Precipitate for the growing international battery market.
A DFS – a detailed look at the economics of building a project — is underway.
Ardea Resources (ASX:ARL) share price today:
Related Topics

Related Stories


UNLOCK INSIGHTS
Discover the untold stories of emerging ASX stocks.
Daily news and expert analysis, it's free to subscribe.
By proceeding, you confirm you understand that we handle personal information in accordance with our Privacy Policy.


