High Voltage: Indonickel production quotas an ingredient in the cocktail for a price rebound

Benchmark says the country’s quotas could lead to a supply gap and impact global prices. Pic: Getty Images.
- Indonesia’s nickel quotas could have a domino effect on global markets
- Benchmark says short-term outlook hinges on expanded quotas
- ARL and AXN aim to grab place in market when deficit looms in 2028-29
Our High Voltage column wraps all the news driving ASX stocks with exposure to lithium, cobalt, graphite, nickel, rare earths, and vanadium.
In the middle of 2024, the Indonesian government approved annual ore quotas of 240Mt out to 2026 in a move aimed at curbing illegal mining, improving environmental standards and ensuring responsible resource management amid concerns over premature resource depletions.
Now that quota has been cut to closer to 200Mt.
Benchmark Minerals Intelligence (BMI) notes this would leave domestic smelters reliant on imports from the neighbouring Philippines to fill this supply gap – a country Indonesia imported record levels of nickel ore from last year to sustain domestic refined output.
For context, that was a 24x increase between January and October compared to the entirety of 2023.
“Given the scale of the current estimated shortfall, it appears likely that there will be a cut to refined nickel production unless the quota is expanded from current levels,” BMI said.
Indonesia emerged as one of the world’s biggest producers of nickel after a 2020 ban on the export of raw nickel sent expansion of its domestic processing industry. But now this year’s quotas suggest the price may have fallen too far for even some of its own producers.
BMI says the short-term outlook for the nickel market hinges on the country shifting these mining quotas, known as RKAB.
Essentially, if Indonesia doesn’t shift the bar, they will not have enough nickel to meet domestic demand – and that will have a domino effect throughout the industry.

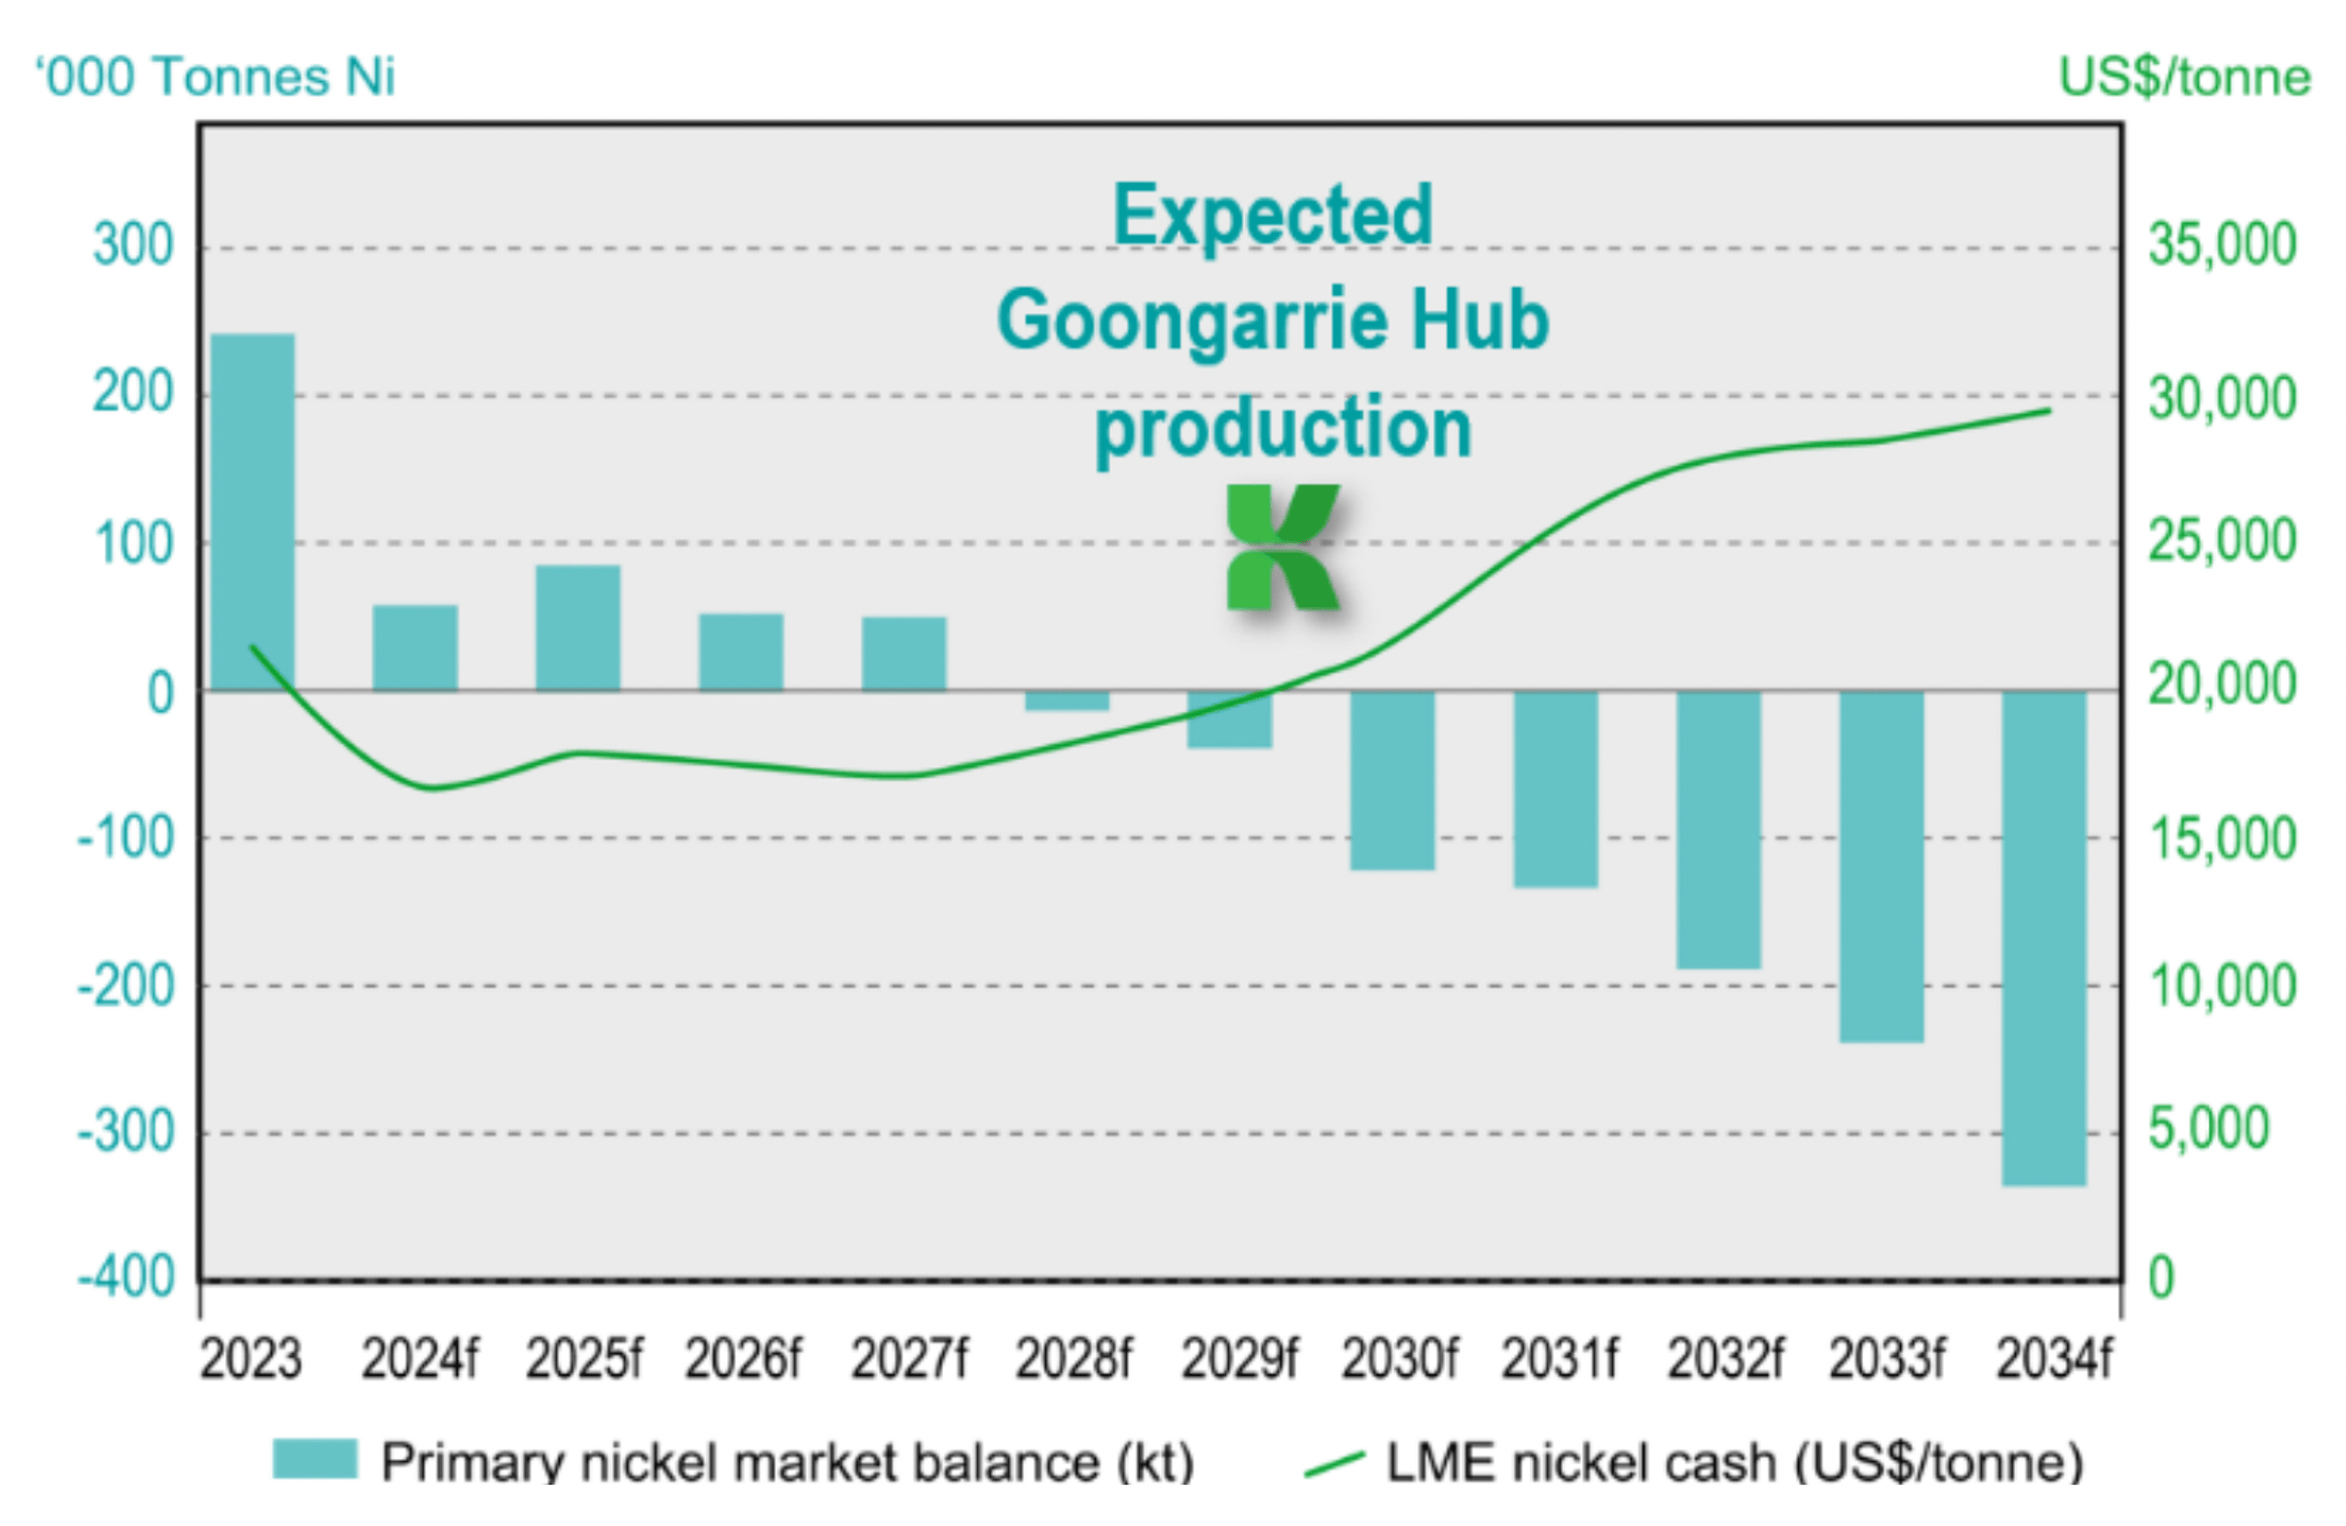
Nickel in surplus but not for long
Ardea Resources (ASX:ARL) managing director and CEO Andrew Penkethman says that because the nickel market is currently in surplus the Indonesian government is aiming to generate a higher margin from their nickel production – – and maximise the value for depleting their nickel resources.
“The ability for Indonesia to expand their rate of nickel production is starting to dwindle, the highest value lowest cost ore is being or has already been mined and the government is increasingly concerned by the rate of resource depletion,” he said.
“So, they’re looking at cutting their global supply which will have a big impact on the availability of nickel units for sale around the world.”
The nickel price is currently sitting between US$15,000/t and US$16,000/t, with a host of Australian mines including those owned by BHP closing last year, but Penkethman says there’s light at the end of the tunnel.
“Independent research from groups like Benchmark, WoodMac and Fastmarkets all highlight that nickel demand is only going to continue to increase through traditional uses like the stainless steel sector and in lithium-ion energy storage sector, and so the expectation is the nickel market will move back into deficit around 2028-2029 and we expect to see a strong nickel price response to that,” he said.
Ardea is hopeful its Kalgoorlie nickel project, where Japanese giants Sumitomo and Mitsubishi are conducting a feasibility study, expected to come online just as that deficit hits.
“We think our timing is really good, with our production currently earmarked for 2029 when the nickel market is expected to move back into deficit,” Penkethman said.
“But even based on current nickel prices we’ve already demonstrate with our July 2023 pre-feasibility study that we can be cost competitive.
“Our C1 operating cost, allowing for the cobalt by-product, was about US$6,000/t. I appreciate that the cobalt price has reduced since then but even on a nickel only basis, our C1 cost is about US$10,000/t – we’ll obviously update that as part of the current definitive feasibility study underway but it shows that we can be cost competitive with our global peers including Indonesia.”
Ultimately, he says we need security and diversity of nickel supply.
“Alternate sources of supply have to come online, and there’s no better jurisdiction than Australia, and with our project just north of Kalgoorlie we are perfectly positioned to develop Australia’s next large-scale, long-life, low-cost nickel-cobalt operation,” Penkethman said.
More supply chain diversity needed
Alliance Nickel (ASX:AXN) CEO and managing director Paul Kopejtka said Indonesia’s cuts could lead to a more balance global nickel market “potentially benefiting future producers like Alliance Nickel through improved pricing and increased demand for non-Indonesian nickel sulphate sources.”
“Some analysts believe prices could jump to US$20,000 per tonne by mid-2025 should supply constraints be introduced by Indonesia in that time,” he said.
“However, nickel price recovery will depend on a multitude of factors such as disciplined supply management, continued demand growth and customers trending towards more sustainably sourced nickel.”
Like Ardea, Alliance is optimistic about the long-term growth in nickel demand, underpinned by the global transition to electric vehicles, growth in renewable energy technologies and robust industrial demand – particularly from stainless steel production.
And Kopejtka says its NiWest project has the long-term sustainability and cost competitive advantages to secure a slice of the market.
“The project DFS released by Alliance Nickel last year underscores our competitive advantage, with the project firmly positioned in the first cost quartile for All-In Sustaining Cost (AISC) compared to domestic and international peers,” he said.
“This highlights industry-leading production efficiency of high purity battery-grade material from one of the largest, highest grade nickel laterite resources in Australia, cost resilience and long-term sustainability of NiWest, which is anticipated to have a 35-year life of mine.
“Alliance Nickel’s binding offtake agreement with Stellantis provides stable demand for NiWest products, positioning us favourably in the market.”
Nickel Industries (ASX:NIC), an ASX listed company that has become one of the largest nickel miners in the world by pursuing aggressive expansions in Indonesia, told analysts yesterday it remained confident of receiving upgraded RKAB permits for its Hengjaya mine and future permits for its Sampala project, which it believes can be developed for around US$50m, supplying ore to its four existing nickel pig iron plants and a new HPAL development.
MD Justin Werner suggested some local companies had fallen foul of regulatory requirements for updated feasibility studies and environmental management plans as Indonesia cracks down on environmentally unsound mining practices.
NIC sold 32,120t of nickel in metal from its RKEF lines in the December quarter and 2099t from its 10% share of a HPAL plant, generating underlying EBITDA of US$42m and US$14.7m respectively despite weak nickel prices.
Battery Metals Winners and Losers
Here’s how a basket of ASX stocks with exposure to lithium, cobalt, graphite, nickel, rare earths, magnesium, manganese and vanadium is performing >>>
Security Description Last %Wk %Mth %SixMth %Yr MktCap XTC XTC Lithium Limited 0.2 19900% 19900% 19900% 19900% $17,528,272 AQD Ausquest Limited 0.04 471% 344% 244% 244% $46,327,323 AX8 Accelerate Resources 0.013 63% 100% 30% -50% $8,082,801 ASO Aston Minerals Ltd 0.014 56% 56% 56% -18% $18,130,900 LML Lincoln Minerals 0.006 50% 20% 20% 0% $10,281,298 EVR Ev Resources Ltd 0.0035 40% 17% -24% -62% $7,250,013 YAR Yari Minerals Ltd 0.004 33% 33% 0% -60% $1,929,431 TAR Taruga Minerals 0.012 33% 20% 50% 50% $8,472,321 AOA Ausmon Resorces 0.002 33% 0% 0% -33% $2,179,455 G88 Golden Mile Res Ltd 0.009 29% -10% -10% -40% $4,466,006 EMN Euromanganese 0.041 28% 32% -34% -55% $8,401,560 AXN Alliance Nickel Ltd 0.04 25% 3% 5% 33% $29,033,585 AKN Auking Mining Ltd 0.005 25% 0% -71% -86% $2,573,894 TMX Terrain Minerals 0.005 25% 67% 25% 0% $7,242,782 TOR Torque Met 0.072 24% 44% -47% -63% $17,476,475 AZI Altamin Limited 0.027 23% 8% -10% -42% $15,511,578 CLA Celsius Resource Ltd 0.011 22% 10% -8% 0% $26,692,385 IG6 Internationalgraphit 0.068 21% 39% -24% -48% $13,161,966 MRD Mount Ridley Mines 0.003 20% 0% -70% -80% $2,335,467 ENV Enova Mining Limited 0.006 20% 0% -40% -71% $5,909,576 LNR Lanthanein Resources 0.003 20% 0% -25% -54% $7,330,908 LNR Lanthanein Resources 0.003 20% 0% -25% -54% $7,330,908 GL1 Globallith 0.215 19% 16% -16% -59% $57,581,067 SMX Strata Minerals 0.038 19% 90% 46% -7% $7,250,976 VRC Volt Resources Ltd 0.0035 17% 17% -30% -42% $15,428,838 VHM Vhmlimited 0.35 17% -17% -22% -40% $72,514,199 TMB Tambourahmetals 0.029 16% 26% -41% -66% $2,985,931 GW1 Greenwing Resources 0.04 14% 18% 0% -58% $9,626,059 ASL Andean Silver 1.085 13% 32% 50% 393% $168,300,180 SBR Sabre Resources 0.009 13% -10% -36% -67% $3,536,657 ESR Estrella Res Ltd 0.028 12% 33% 460% 460% $53,229,079 PFE Pantera Lithium 0.019 12% 6% -31% -65% $9,001,890 BSX Blackstone Ltd 0.029 12% 0% -22% -53% $17,254,913 EMH European Metals Hldg 0.155 11% -14% -39% -48% $32,153,929 ARL Ardea Resources Ltd 0.38 10% 17% -16% 4% $75,879,508 FLG Flagship Min Ltd 0.047 9% -13% -48% -71% $9,568,928 DRE Dreadnought Resources Ltd 0.012 9% 9% -43% -45% $45,213,600 KNI Kunikolimited 0.18 9% -5% -5% -20% $15,618,468 RVT Richmond Vanadium 0.18 9% -16% -40% -45% $38,820,833 MLX Metals X Limited 0.49 9% 20% 14% 72% $425,467,938 RAS Ragusa Minerals Ltd 0.013 8% 30% -24% -58% $1,853,784 TKM Trek Metals Ltd 0.026 8% 0% -10% -35% $13,523,194 SLM Solismineralsltd 0.07 8% -1% -42% -42% $4,942,581 TLG Talga Group Ltd 0.505 7% 15% 19% -19% $223,318,847 ABX ABX Group Limited 0.044 7% 7% -12% -39% $11,012,911 PAT Patriot Lithium 0.047 7% 4% 4% -64% $5,435,972 NWC New World Resources 0.018 6% 0% -28% -51% $51,125,071 EG1 Evergreenlithium 0.09 6% 50% 67% -18% $4,892,010 DYM Dynamicmetalslimited 0.29 5% 4% 66% 93% $13,960,725 STK Strickland Metals 0.08 5% -6% -9% -20% $176,593,179 NTU Northern Min Ltd 0.02 5% -5% -33% -23% $170,123,281 PGM Platina Resources 0.02 5% 5% -26% 5% $12,463,607 BUX Buxton Resources Ltd 0.04 5% -2% -49% -72% $8,891,299 GCM Green Critical Min 0.021 5% 91% 600% 200% $40,410,369 WIN WIN Metals 0.021 5% 24% -9% -74% $11,551,220 LIN Lindian Resources 0.105 5% 31% -9% -28% $126,821,446 EV1 Evolutionenergy 0.021 5% -7% -34% -84% $7,615,660 ASN Anson Resources Ltd 0.064 5% 10% -47% -33% $85,848,499 MAN Mandrake Res Ltd 0.022 5% -4% -15% -46% $13,799,718 MTM MTM Critical Metals 0.235 4% 2% 683% 213% $109,999,899 1MC Morella Corporation 0.024 4% -17% -44% -81% $7,596,107 DVP Develop Global Ltd 2.46 4% 10% 21% 1% $638,273,289 BMM Bayanminingandmin 0.052 4% 4% -24% -42% $4,474,107 KAI Kairos Minerals Ltd 0.0135 4% 13% 69% -10% $34,201,858 SRI Sipa Resources Ltd 0.014 4% 8% -26% -30% $3,988,364 WMG Western Mines 0.14 4% -7% -43% -26% $12,649,468 OCN Oceanalithiumlimited 0.028 4% 8% -19% -55% $3,712,402 PGD Peregrine Gold 0.15 3% 43% -27% -48% $10,181,763 AR3 Austrare 0.092 3% -8% 18% -26% $14,627,055 EGR Ecograf Limited 0.093 3% 4% -11% -31% $42,234,259 IDA Indiana Resources 0.067 3% 10% 54% 50% $43,063,075 BCA Black Canyon Limited 0.067 3% 2% -12% -36% $7,107,630 ICL Iceni Gold 0.072 3% 7% 14% 73% $22,167,754 A8G Australasian Metals 0.077 3% -1% -9% -38% $4,399,619 ZNC Zenith Minerals Ltd 0.043 2% 5% -14% -70% $17,519,981 GBR Greatbould Resources 0.047 2% 9% -6% -19% $35,677,716 LLI Loyal Lithium Ltd 0.097 2% -14% -22% -55% $9,771,107 PSC Prospect Res Ltd 0.099 2% 8% -21% 25% $55,457,204 ARU Arafura Rare Earths 0.1325 2% 10% -24% 10% $332,684,373 ATM Aneka Tambang 0.9 1% 0% -13% -23% $1,173,284 BM8 Battery Age Minerals 0.097 1% -12% -25% -41% $10,017,592 LTM Arcadium Lithium PLC 9.2 1% 11% 80% 20% $2,281,252,136 CAE Cannindah Resources 0.04 0% 0% -25% -50% $29,123,198 COB Cobalt Blue Ltd 0.065 0% -3% -16% -60% $27,511,818 LPD Lepidico Ltd 0.002 0% 0% 0% -58% $17,178,371 CZN Corazon Ltd 0.002 0% 0% -60% -85% $2,369,145 FRS Forrestaniaresources 0.01 0% -29% -66% -66% $2,439,635 FGR First Graphene Ltd 0.055 0% 90% 8% -2% $37,799,433 NH3 Nh3Cleanenergyltd 0.019 0% 0% 46% 58% $9,892,886 MNS Magnis Energy Tech 0.042 0% 0% 0% 0% $50,378,922 PLL Piedmont Lithium Inc 0.135 0% -10% -16% -48% $87,746,092 BKT Black Rock Mining 0.034 0% -8% -45% -46% $42,569,652 GLN Galan Lithium Ltd 0.12 0% -11% -15% -77% $97,152,160 ADV Ardiden Ltd 0.14 0% 4% 4% -13% $8,439,863 AAJ Aruma Resources Ltd 0.009 0% -18% -36% -57% $1,998,524 IXR Ionic Rare Earths 0.006 0% -14% -33% -70% $31,430,570 CWX Carawine Resources 0.105 0% 5% 15% 0% $24,793,172 TKL Traka Resources 0.001 0% 0% -33% -50% $2,125,790 PRL Province Resources 0.041 0% 0% 0% 0% $48,441,219 IPT Impact Minerals 0.011 0% 5% -35% -15% $33,653,771 ARN Aldoro Resources 0.3 0% -13% 257% 186% $48,021,529 JRV Jervois Global Ltd 0.011 0% -8% -35% -62% $29,730,402 POS Poseidon Nick Ltd 0.004 0% -11% 9% -45% $16,815,567 AUZ Australian Mines Ltd 0.012 0% 26% 33% 20% $16,082,889 ALY Alchemy Resource Ltd 0.007 0% 0% 0% -13% $8,246,534 LEL Lithenergy 0.37 0% 0% 3% -14% $41,440,581 RMX Red Mount Min Ltd 0.008 0% -20% -47% -70% $3,719,662 REE Rarex Limited 0.009 0% 13% -36% -57% $7,207,613 MRC Mineral Commodities 0.026 0% 0% 0% 0% $25,596,288 PUR Pursuit Minerals 0.082 0% -22% -45% -73% $6,687,951 LEG Legend Mining 0.01 0% -17% -17% -29% $29,094,772 MOH Moho Resources 0.005 0% 25% -17% -44% $3,582,373 AML Aeon Metals Ltd. 0.005 0% 0% 0% -44% $5,482,003 WKT Walkabout Resources 0.095 0% 0% -10% -21% $63,769,838 CNJ Conico Ltd 0.009 0% -10% -10% -78% $2,374,873 BOA BOA Resources Ltd 0.022 0% 10% 10% -24% $2,713,763 MRR Minrex Resources Ltd 0.008 0% 0% -11% -43% $8,678,940 AM7 Arcadia Minerals 0.02 0% 5% -39% -71% $2,347,669 GSM Golden State Mining 0.008 0% 0% -27% -38% $2,234,965 IMI Infinitymining 0.011 0% 0% 22% -90% $4,631,174 TEM Tempest Minerals 0.005 0% 25% -38% -35% $3,172,649 EMC Everest Metals Corp 0.14 0% 4% 17% 84% $31,329,737 OB1 Orbminco Limited 0.0015 0% -25% -50% -70% $4,333,180 KOR Korab Resources 0.008 0% 0% 0% -47% $2,936,400 CMX Chemxmaterials 0.026 0% 0% -42% -66% $3,354,580 FRB Firebird Metals 0.099 0% -10% -18% -14% $14,093,779 JMS Jupiter Mines. 0.145 0% 0% -45% -17% $284,351,055 LRS Latin Resources Ltd 0.165 0% 9% 16% 5% $477,661,711 CRR Critical Resources 0.005 0% -17% -29% -64% $13,375,798 ENT Enterprise Metals 0.003 0% -25% -25% -25% $3,534,952 SCN Scorpion Minerals 0.02 0% 43% 18% -29% $9,008,036 RR1 Reach Resources Ltd 0.007 0% 0% -36% -49% $6,121,019 PNT Panthermetalsltd 0.009 0% -25% -64% -74% $2,233,537 AVW Avira Resources Ltd 0.001 0% 0% 0% -50% $2,938,790 CAI Calidus Resources 0.115 0% 0% 0% -44% $93,678,206 RGL Riversgold 0.003 0% -25% -40% -68% $5,051,138 THR Thor Energy PLC 0.011 0% -8% -35% -71% $2,991,281 CLZ Classic Min Ltd 0.001 0% 0% 0% -98% $1,544,026 CRI Criticalim 0.017 0% 42% -6% 113% $48,392,075 VTM Victory Metals Ltd 0.38 0% -6% 12% 65% $40,688,518 M2R Miramar 0.004 0% 14% -43% -82% $1,587,293 RR1 Reach Resources Ltd 0.007 0% 0% -36% -49% $6,121,019 GRL Godolphin Resources 0.014 0% 0% -7% -67% $5,027,381 DM1 Desert Metals 0.022 0% -4% -12% -27% $6,150,791 M24 Mamba Exploration 0.017 0% 42% 55% -69% $3,994,274 CDT Castle Minerals 0.002 0% 0% -43% -71% $3,793,628 DLI Delta Lithium 0.17 0% 3% -28% -39% $121,812,105 CY5 Cygnus Metals Ltd 0.14 0% 40% 122% 106% $118,764,751 PBL Parabellumresources 0.055 0% 2% 45% -15% $3,426,500 OM1 Omnia Metals Group 0.078 0% 0% 0% 0% $4,550,568 LLL Leolithiumlimited 0.332997 0% 0% 0% 0% $401,057,170 SRN Surefire Rescs NL 0.004 0% 14% -50% -60% $9,665,231 WSR Westar Resources 0.009 0% 29% 13% -47% $3,588,523 LU7 Lithium Universe Ltd 0.009 0% 13% -35% -59% $7,073,817 MHC Manhattan Corp Ltd 0.024 0% 26% -4% -52% $5,637,574 ANX Anax Metals Ltd 0.01 0% -9% -60% -52% $8,764,517 FIN FIN Resources Ltd 0.004 0% -20% -43% -75% $2,597,075 LM1 Leeuwin Metals Ltd 0.12 0% -14% 43% 14% $5,622,201 LCY Legacy Iron Ore 0.009 0% 0% -45% -45% $87,858,383 ASR Asra Minerals Ltd 0.003 0% 0% -50% -50% $6,937,890 KM1 Kalimetalslimited 0.12 0% 0% -20% -77% $9,219,315 KNG Kingsland Minerals 0.12 0% -17% -35% -53% $8,344,505 BHP BHP Group Limited 39.41 -1% -1% -6% -16% $198,541,753,486 CTM Centaurus Metals Ltd 0.395 -1% 10% 8% 32% $198,680,485 NMT Neometals Ltd 0.078 -1% 8% 11% -48% $60,015,157 QEM QEM Limited 0.069 -1% 33% -50% -62% $12,976,691 OMH OM Holdings Limited 0.34 -1% -6% -23% -29% $260,527,312 HAS Hastings Tech Met 0.32 -2% -3% 5% -43% $58,043,563 ARR American Rare Earths 0.285 -2% 2% 12% 119% $141,798,524 RNU Renascor Res Ltd 0.057 -2% -8% -35% -30% $144,895,833 ITM Itech Minerals Ltd 0.052 -2% 0% -27% -37% $8,883,440 GED Golden Deeps 0.0225 -2% -17% -34% -39% $3,409,253 MLS Metals Australia 0.0225 -2% 2% 13% -32% $16,396,189 LRV Larvottoresources 0.635 -2% 26% 452% 807% $261,809,716 LKE Lake Resources 0.04 -2% -5% 8% -56% $71,222,166 PLS Pilbara Min Ltd 2.35 -2% 7% -20% -35% $7,109,284,933 RAG Ragnar Metals Ltd 0.0195 -3% 3% 8% -11% $9,242,727 KZR Kalamazoo Resources 0.075 -3% -3% 9% -21% $15,416,722 PNN Power Minerals Ltd 0.09 -3% -3% -5% -42% $10,246,939 BNR Bulletin Res Ltd 0.036 -3% -8% -28% -57% $10,570,080 FTL Firetail Resources 0.07 -3% -11% -13% 23% $23,206,958 LTR Liontown Resources 0.685 -3% 25% -28% -28% $1,637,961,240 NVA Nova Minerals Ltd 0.335 -3% -3% 139% -8% $103,032,773 AVL Aust Vanadium Ltd 0.0145 -3% 4% -3% -26% $120,885,213 GAL Galileo Mining Ltd 0.145 -3% 21% -19% -31% $28,655,614 PTR Petratherm Ltd 0.435 -3% 50% 2459% 1640% $132,954,533 AGY Argosy Minerals Ltd 0.028 -3% -3% -36% -72% $40,765,786 SUM Summitminerals 0.125 -4% 0% -38% 76% $10,890,999 ASM Ausstratmaterials 0.475 -4% -3% -26% -53% $86,126,827 LOT Lotus Resources Ltd 0.235 -4% 24% -10% -30% $531,596,687 KOB Kobaresourceslimited 0.07 -4% -8% -53% -50% $11,099,313 WC8 Wildcat Resources 0.23 -4% -12% -4% -42% $321,385,107 L1M Lightning Minerals 0.091 -4% 23% 32% -4% $7,749,624 AZL Arizona Lithium Ltd 0.011 -4% -15% -39% -50% $50,179,960 DEV Devex Resources Ltd 0.086 -4% -4% -66% -66% $37,985,398 CHR Charger Metals 0.064 -4% -2% 5% -49% $4,954,896 GRE Greentechmetals 0.064 -4% -9% -47% -74% $7,625,688 VMC Venus Metals Cor Ltd 0.063 -5% -7% -24% -34% $12,356,107 MEK Meeka Metals Limited 0.105 -5% 36% 156% 192% $273,528,012 WA1 Wa1Resourcesltd 13.17 -5% 1% -14% 25% $880,305,088 WCN White Cliff Min Ltd 0.019 -5% 15% 19% 19% $36,013,944 1AE Auroraenergymetals 0.057 -5% 27% -5% -58% $10,206,633 KFM Kingfisher Mining 0.035 -5% -13% -46% -70% $1,880,025 IPX Iperionx Limited 3.92 -6% -30% 78% 125% $1,244,434,217 SGQ St George Min Ltd 0.0255 -6% 2% -23% -9% $30,963,511 BC8 Black Cat Syndicate 0.665 -6% 8% 87% 177% $403,927,253 CNB Carnaby Resource Ltd 0.33 -6% -7% -34% -50% $71,998,721 QPM QPM Energy Limited 0.065 -6% 18% 76% 63% $189,095,680 LIT Livium Ltd 0.016 -6% -6% -27% -41% $21,440,175 LMG Latrobe Magnesium 0.016 -6% -24% -62% -72% $37,576,598 MIN Mineral Resources. 34.24 -6% 0% -37% -43% $7,123,799,395 JLL Jindalee Lithium Ltd 0.21 -7% 0% -24% -78% $15,454,288 RXL Rox Resources 0.21 -7% 6% 45% 32% $127,655,503 PEK Peak Rare Earths Ltd 0.14 -7% 27% -36% -42% $47,475,774 PEK Peak Rare Earths Ltd 0.14 -7% 27% -36% -42% $47,475,774 S32 South32 Limited 3.32 -7% -2% 10% -1% $14,862,297,923 INF Infinity Lithium 0.027 -7% 0% -48% -70% $12,489,987 IGO IGO Limited 4.97 -7% 2% -12% -35% $3,899,929,237 NIC Nickel Industries 0.79 -7% -7% -2% 32% $3,431,847,904 PVW PVW Res Ltd 0.013 -7% -7% -48% -77% $2,585,762 SRZ Stellar Resources 0.013 -7% -13% -32% 86% $27,036,757 FBM Future Battery 0.025 -7% 47% 4% -56% $16,633,898 MQR Marquee Resource Ltd 0.012 -8% -25% 9% -41% $5,825,766 NVX Novonix Limited 0.5625 -8% -19% -22% -8% $365,352,572 FG1 Flynngold 0.023 -8% -12% -4% -55% $6,010,279 WR1 Winsome Resources 0.46 -8% 2% -23% -20% $102,067,410 LYC Lynas Rare Earths 6.235 -8% -4% 0% 5% $5,907,418,929 MEI Meteoric Resources 0.079 -8% -12% -21% -62% $181,926,160 SYA Sayona Mining Ltd 0.022 -8% -19% -29% -44% $253,952,512 ODE Odessa Minerals Ltd 0.0055 -8% -21% 83% -21% $9,597,195 HAW Hawthorn Resources 0.042 -9% 2% -41% -53% $14,070,656 AS2 Askarimetalslimited 0.01 -9% -9% -73% -92% $2,646,846 KTA Krakatoa Resources 0.01 -9% 11% -9% -47% $5,901,340 LPM Lithium Plus 0.077 -9% -8% -30% -67% $10,228,680 NC1 Nicoresourceslimited 0.086 -9% -5% -34% -64% $9,412,749 ILU Iluka Resources 4.48 -9% -11% -25% -38% $1,948,534,474 VR8 Vanadium Resources 0.028 -10% -7% -44% -33% $15,753,506 A11 Atlantic Lithium 0.23 -10% -19% -38% -39% $159,423,882 SYR Syrah Resources 0.225 -10% 25% -17% -49% $238,025,106 DTM Dart Mining NL 0.009 -10% -10% -51% -30% $5,681,528 KGD Kula Gold Limited 0.0045 -10% -21% -57% -40% $2,894,454 SYR Syrah Resources 0.225 -10% 25% -17% -49% $238,025,106 CMO Cosmometalslimited 0.017 -11% -23% -66% -70% $2,226,879 REC Rechargemetals 0.017 -11% 0% -45% -78% $4,360,329 MHK Metalhawk. 0.295 -11% 5% 490% 181% $34,615,976 GT1 Greentechnology 0.058 -11% -4% 0% -63% $23,325,126 CHN Chalice Mining Ltd 1.0875 -11% -3% 2% 8% $431,819,735 EVG Evion Group NL 0.024 -11% -4% 14% -25% $8,327,116 RBX Resource B 0.031 -11% -14% -23% -59% $3,570,719 PMT Patriotbatterymetals 0.3275 -11% -23% -37% -59% $191,644,750 S2R S2 Resources 0.069 -12% 3% -40% -49% $31,247,202 CXO Core Lithium 0.088 -12% 2% -6% -54% $190,728,383 TVN Tivan Limited 0.11 -12% 0% 96% 93% $216,223,271 TON Triton Min Ltd 0.007 -13% -22% -30% -63% $10,978,721 SLZ Sultan Resources Ltd 0.007 -13% 0% 0% -53% $1,620,289 EMS Eastern Metals 0.013 -13% -13% -57% -64% $1,477,791 NWM Norwest Minerals 0.013 -13% -19% -48% -46% $6,306,554 WC1 Westcobarmetals 0.019 -14% 19% -36% -65% $3,166,423 AXE Archer Materials 0.4 -14% -23% 33% 25% $101,938,805 CTN Catalina Resources 0.003 -14% 0% 0% 0% $3,948,786 STM Sunstone Metals Ltd 0.006 -14% -14% -33% -50% $30,900,022 RON Roninresourcesltd 0.175 -15% -8% 46% 25% $7,065,627 EFE Eastern Resources 0.027 -16% -4% -46% -61% $3,404,429 ADD Adavale Resource Ltd 0.0025 -17% 0% -38% -69% $3,852,080 HRE Heavy Rare Earths 0.025 -17% -17% -16% -47% $5,200,847 VUL Vulcan Energy 4.73 -17% -15% 11% 119% $1,057,413,625 E25 Element 25 Ltd 0.28 -18% 10% 33% -11% $60,475,910 INR Ioneer Ltd 0.1725 -18% 8% 28% 57% $412,242,690 OD6 Od6Metalsltd 0.056 -19% 24% 37% -63% $8,081,410 LSR Lodestar Minerals 0.012 -20% -20% -40% -75% $2,710,638 EMT Emetals Limited 0.004 -20% -20% 0% -33% $3,400,000 SRL Sunrise 0.265 -22% 15% -35% -34% $23,459,149 EUR European Lithium Ltd 0.058 -24% 49% 23% -31% $89,601,251 QXR Qx Resources Limited 0.003 -25% -25% -57% -82% $3,930,234 PVT Pivotal Metals Ltd 0.006 -25% -25% -68% -68% $5,443,355 BYH Bryah Resources Ltd 0.003 -25% 0% -40% -70% $1,509,861 ETM Energy Transition 0.065 -26% 91% 195% 71% $102,049,773 BUR Burleyminerals 0.058 -30% -21% -54% -42% $9,022,257 RLC Reedy Lagoon Corp. 0.002 -33% 0% -43% -50% $1,553,413 VML Vital Metals Limited 0.002 -33% 0% -33% -60% $11,790,134 RIL Redivium Limited 0.0025 -38% -38% 100% -33% $8,505,889
Weekly Small Cap Standouts
After several months of researching antimony markets, EVR has reached an agreement to acquire 70% of an operating JV over the Los Lirios antimony mine in Oaxaca, Mexico.
The project consists of four licences covering 1652ha (16.52km2), three open pits, and several underground workings on a 7km trend that date back several generations.
EVR managing director Hugh Callaghan said the company has been intrigued by antimony for some time.
“It has many deep and flexible markets with mature technologies and minimal risk of substitution,” he said.
“The depletion of Chinese resources and consequent suspension of exports comes after decades of minimal exploration for antimony and closure of most mines outside of China.
“We are satisfied that antimony has the characteristics of a real, and sustainable market, and we are equally convinced that low-cost jurisdictions with skills for mining on a relatively small scale, such as in Mexico, are essential.”
EVR has commenced due diligence and planning for an exploration program.
By the end of March, EVR plans to begin the search for a suitable plant location, and proceed to a program of sampling and trenching, with a view to defining drill targets at Los Lirios.
The rare earths explorer has wrapped up a $1.5m placement to fund the development of its CODA lithium project in Brazil, and Charley Creek alluvial minerals sands project in the NT – with a specific focus on metallurgical test work and engineering.
In the latter half of 2024, exploration drilling at CODA North identified mineralisation with an expansive area extent of over 10 sqkm starting from surface in many locations and extending to depths of 70 metres.
Notably, this mineralisation is ‘free-dig’ weathered saprolites with consistent zones of high-grade REE, scandium and titanium.
This funding will allow continued metallurgical work investigating methods of metal extraction and within six months, a process flow design and project concept.
The company will also continue field exploration of its Lithium Valley (also Minas Gerais, Brazil) tenements and geochemical sampling.
Related Topics
Related Stories


UNLOCK INSIGHTS
Discover the untold stories of emerging ASX stocks.
Daily news and expert analysis, it's free to subscribe.
By proceeding, you confirm you understand that we handle personal information in accordance with our Privacy Policy.


