High Voltage: Don’t let sexy lithium distract you from nickel and graphite’s quiet potential

Pic: RealPeopleGroup, E+/ Via Getty Images
- Cobalt’s bad run set to continue in 2023
- Chinese battery industry now consumes average +10,000t of nickel each month, up from ~5,000t per month in 2021
- “Significant further [graphite] investment required to develop sufficient ex-China integrated anode production capacity”: Benchmark
Our High Voltage column wraps all the news driving ASX stocks with exposure to lithium, cobalt, graphite, nickel, rare earths, manganese, magnesium, and vanadium.
November was a mixed bag for battery metal prices.
Lithium and cobalt continued to chart divergent courses – lithium keeps going up (despite the mixed messaging), cobalt down – while both graphite and nickel inked solid wins.
First, the bad news. Cobalt sulphate pricing decreased by another 5.6% in November on reduced spot demand from the lithium-ion battery industry and consumer electronics sector, Benchmark Mineral Intelligence says.
It’s the continuation of a rough ride which has seen sulphate – a refined product (typically >20.5% Co) commonly used in lithium-ion batteries – fall almost 40% year-to-date.
The new doesn’t get better in 2023.
Despite industry watchers predicting better times ahead, Benchmark says a structural surplus is incoming.
“In spite of the negative price outlook for cobalt, the supply side of the industry continues to be built out as a result of cobalt’s nature as a by-product for nickel and copper,” it says.
“Finally, reduced LCO demand from the consumer electronics segment, given a worsening macroeconomic outlook, and the longer-term structural shift towards cathode technologies with relatively lower cobalt content both continued to curb demand for cobalt, widening a surplus of supply within the market.
“Benchmark anticipates this surplus to grow in 2023, set to maintain downward pressure on pricing moving forwards.”
READ: Up, Up, Down, Down: Which commodities won and lost in November?
Nickel, graphite on a growth trajectory in 2023
Now, the good news; like lithium, the outlook for nickel and graphite remains very bullish.
Overall battery sector nickel demand and prices continued to grow in November, with lithium-ion batteries consistently consuming more nickel month-on-month despite COVID lockdowns in China.
“Benchmark anticipates sales will pick in China during the final months of 2022 as the domestic EV market looks to take advantage of government subsidies, set to expire at the end of the year,” it says.
“Notably, many of these vehicles will use high-nickel cathode technologies, increasing the demand for nickel from the EV industry, with Chinese EV battery production consuming almost 15,500 tonnes of nickel in October.”
That’s a 160% increase year-on-year, Benchmark says.
“As such, Benchmark data now indicates that the Chinese lithium-ion battery industry consumes over 10,000 tonnes of nickel each month on average, a volume which is rapidly increasing, marking a step change in consumption from even 2021, where the Chinese lithium-ion battery industry consumed an estimated average of 5,000 tonnes of nickel contained monthly.”

READ: As EVs boom the junior nickel market has cashed-up private equity firms circling
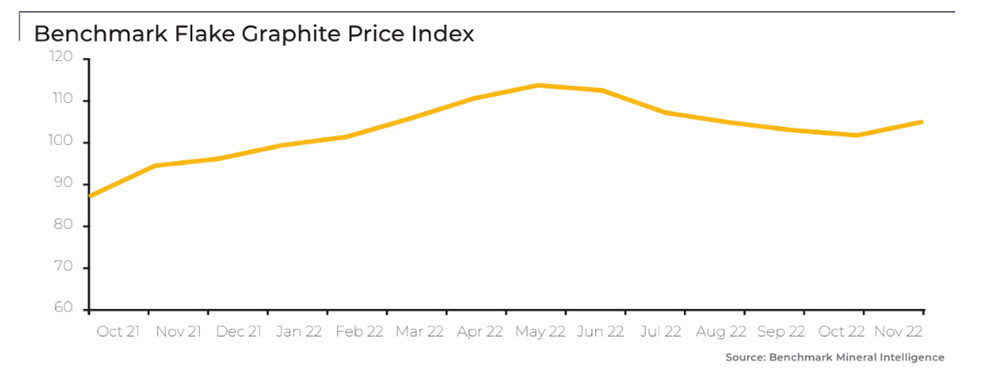
Meanwhile, the Benchmark Flake Graphite Price Index increased by 3.2% in November “as seasonal mine closures tighten flake graphite supply amid robust downstream demand”.
The index is now up a respectable +9% year-to-date.
There’s a bunch of ASX frontrunners moving fast to take advantage of a widening supply deficit but Benchmark says “significant further investment will be required to develop sufficient ex-China integrated anode production capacity to achieve localised battery component sourcing ambitions”.
Just 10% of global spherical graphite supply is expected to originate from the ex-China market in 2025, according to the Benchmark Flake Graphite Forecast.
READ: Caught short? Miners say graphite is poised to be lithium 2.0
Battery Metals Winners and Losers
Here’s how a basket of ASX stocks with exposure to lithium, cobalt, graphite, nickel, rare earths, magnesium, manganese, and vanadium is performing>>>
Battery metals stocks missing from our list? Shoot a mail to [email protected].
| CODE | COMPANY | 1 WEEK RETURN % | 1 MONTH RETURN % | 6 MONTH RETURN % | 1 YEAR RETURN % | PRICE | MARKET CAP |
|---|---|---|---|---|---|---|---|
| AQD | Ausquest Limited | 33% | 11% | -29% | 5% | 0.02 | $17,328,134 |
| WR1 | Winsome Resources | 31% | 95% | 269% | 295% | 1.44 | $171,206,186 |
| PVT | Pivotal Metals Ltd | 30% | 12% | 20% | -26% | 0.048 | $17,452,021 |
| WML | Woomera Mining Ltd | 29% | 38% | -21% | 18% | 0.018 | $16,912,517 |
| M24 | Mamba Exploration | 28% | 33% | 28% | -16% | 0.16 | $6,326,250 |
| ASO | Aston Minerals Ltd | 22% | 45% | -20% | -31% | 0.1 | $105,785,439 |
| MMC | Mitremining | 22% | 56% | 107% | 37% | 0.28 | $7,583,828 |
| TON | Triton Min Ltd | 21% | 26% | 26% | -13% | 0.034 | $47,014,662 |
| LRS | Latin Resources Ltd | 21% | 26% | 51% | 292% | 0.145 | $292,365,784 |
| RAS | Ragusa Minerals Ltd | 19% | -30% | 19% | 96% | 0.155 | $19,186,132 |
| ENV | Enova Mining Limited | 18% | 8% | -28% | -41% | 0.013 | $4,691,152 |
| PAN | Panoramic Resources | 18% | 21% | -27% | -5% | 0.2 | $430,691,941 |
| ESR | Estrella Res Ltd | 17% | 40% | -44% | -53% | 0.014 | $19,207,050 |
| AVW | Avira Resources Ltd | 17% | -13% | -30% | -30% | 0.0035 | $7,468,265 |
| GSR | Greenstone Resources | 15% | 15% | -52% | 7% | 0.03 | $35,461,106 |
| SYA | Sayona Mining Ltd | 15% | 0% | 35% | 77% | 0.23 | $1,997,327,253 |
| STK | Strickland Metals | 14% | 7% | -31% | -31% | 0.048 | $68,971,296 |
| MLX | Metals X Limited | 14% | 16% | -39% | -37% | 0.285 | $258,570,829 |
| SBR | Sabre Resources | 13% | 0% | -10% | -10% | 0.0045 | $11,659,424 |
| RBX | Resource B | 13% | 13% | -34% | -49% | 0.099 | $4,353,285 |
| BYH | Bryah Resources Ltd | 12% | 27% | -39% | -46% | 0.028 | $7,875,097 |
| WMG | Western Mines | 12% | 17% | -32% | -22% | 0.14 | $6,154,875 |
| RXL | Rox Resources | 12% | 0% | -42% | -47% | 0.19 | $35,945,874 |
| DEV | Devex Resources Ltd | 12% | 31% | -4% | -44% | 0.335 | $129,772,501 |
| AGY | Argosy Minerals Ltd | 12% | 15% | 33% | 150% | 0.625 | $919,886,911 |
| RMX | Red Mount Min Ltd | 11% | 0% | -29% | -50% | 0.005 | $8,211,819 |
| ARR | American Rare Earths | 10% | 5% | -35% | 42% | 0.22 | $106,651,392 |
| CHN | Chalice Mining Ltd | 10% | 37% | -5% | -36% | 5.6 | $2,190,049,669 |
| SYR | Syrah Resources | 10% | -2% | 50% | 124% | 2.49 | $1,683,132,482 |
| TLG | Talga Group Ltd | 9% | 18% | 15% | 9% | 1.575 | $504,834,857 |
| MIN | Mineral Resources. | 9% | 22% | 48% | 100% | 89.4 | $17,201,686,392 |
| IMI | Infinitymining | 9% | 62% | 128% | 0% | 0.365 | $24,018,120 |
| S32 | South32 Limited | 9% | 13% | -15% | 15% | 4.3 | $19,859,648,632 |
| LRV | Larvottoresources | 9% | 6% | -41% | -8% | 0.185 | $9,107,754 |
| CAE | Cannindah Resources | 9% | 9% | -2% | 39% | 0.25 | $139,798,638 |
| G88 | Golden Mile Res Ltd | 9% | 14% | -49% | -55% | 0.025 | $5,728,513 |
| XTC | Xantippe Res Ltd | 8% | 8% | -35% | 63% | 0.0065 | $52,943,994 |
| STM | Sunstone Metals Ltd | 8% | 25% | -23% | -56% | 0.04 | $104,817,857 |
| GRL | Godolphin Resources | 7% | -4% | -23% | -39% | 0.088 | $10,653,250 |
| VR8 | Vanadium Resources | 7% | -12% | -36% | -3% | 0.06 | $29,064,742 |
| AKE | Allkem Limited | 7% | -6% | 18% | 53% | 14 | $8,997,355,593 |
| WA1 | Wa1Resourcesltd | 7% | 10% | 946% | 0% | 1.935 | $70,464,905 |
| DVP | Develop Global Ltd | 7% | 18% | 13% | -22% | 2.93 | $491,362,762 |
| IGO | IGO Limited | 6% | 3% | 28% | 52% | 15.42 | $11,767,941,814 |
| REE | Rarex Limited | 6% | -2% | -35% | -50% | 0.05 | $28,389,942 |
| BUR | Burleyminerals | 6% | 25% | 138% | 39% | 0.25 | $8,237,532 |
| CTM | Centaurus Metals Ltd | 6% | 26% | 2% | 15% | 1.17 | $512,527,528 |
| VRC | Volt Resources Ltd | 6% | -15% | -19% | -37% | 0.017 | $62,070,782 |
| CML | Chase Mining Limited | 6% | 6% | 28% | 12% | 0.017 | $16,515,137 |
| LTR | Liontown Resources | 6% | 4% | 55% | 26% | 1.965 | $4,458,763,761 |
| AR3 | Austrare | 6% | 1% | -20% | -64% | 0.345 | $32,368,528 |
| BHP | BHP Group Limited | 6% | 21% | 0% | 30% | 46.56 | $237,131,060,226 |
| HXG | Hexagon Energy | 6% | 38% | -33% | -78% | 0.018 | $8,976,028 |
| HAS | Hastings Tech Met | 6% | 7% | -21% | -24% | 3.79 | $492,769,111 |
| NIC | Nickel Industries | 6% | 28% | -23% | -29% | 0.995 | $2,744,929,864 |
| GBR | Greatbould Resources | 6% | -2% | 2% | -33% | 0.091 | $39,327,112 |
| MNS | Magnis Energy Tech | 6% | 1% | -3% | -20% | 0.37 | $354,170,991 |
| QEM | QEM Limited | 6% | -5% | -16% | -3% | 0.185 | $24,325,842 |
| MNS | Magnis Energy Tech | 6% | 1% | -3% | -20% | 0.37 | $354,170,991 |
| CHR | Charger Metals | 6% | 31% | 13% | 39% | 0.575 | $26,163,621 |
| PBL | Parabellumresources | 5% | -8% | 140% | 118% | 0.48 | $27,361,251 |
| JMS | Jupiter Mines. | 5% | 8% | -9% | 5% | 0.2 | $391,798,207 |
| ILU | Iluka Resources | 5% | 19% | -2% | 23% | 10.53 | $4,440,540,978 |
| LOT | Lotus Resources Ltd | 5% | -7% | -26% | -32% | 0.21 | $285,331,500 |
| CZL | Cons Zinc Ltd | 5% | 5% | -13% | -30% | 0.021 | $9,721,350 |
| LOT | Lotus Resources Ltd | 5% | -7% | -26% | -32% | 0.21 | $285,331,500 |
| INR | Ioneer Ltd | 5% | -3% | 5% | -13% | 0.555 | $1,300,969,726 |
| PVW | PVW Res Ltd | 4% | -8% | -61% | -71% | 0.12 | $11,162,625 |
| GT1 | Greentechnology | 4% | -7% | 0% | 188% | 0.965 | $185,969,933 |
| PLL | Piedmont Lithium Inc | 4% | -12% | 2% | 6% | 0.845 | $458,986,596 |
| PLS | Pilbara Min Ltd | 4% | -10% | 88% | 88% | 4.61 | $13,805,249,357 |
| LYC | Lynas Rare Earths | 4% | 1% | -9% | -6% | 8.68 | $7,819,829,078 |
| LKE | Lake Resources | 4% | -10% | -32% | 21% | 0.97 | $1,391,298,709 |
| KOR | Korab Resources | 4% | -10% | -3% | -62% | 0.028 | $10,644,450 |
| ABX | ABX Group Limited | 4% | -3% | -13% | 44% | 0.14 | $30,184,760 |
| KTA | Krakatoa Resources | 4% | -5% | -27% | 16% | 0.057 | $19,993,175 |
| GRE | Greentechmetals | 3% | 7% | -6% | 0% | 0.15 | $4,843,500 |
| ITM | Itech Minerals Ltd | 3% | -5% | -35% | 22% | 0.3 | $34,536,236 |
| S2R | S2 Resources | 3% | 7% | -14% | -14% | 0.155 | $58,884,351 |
| BKT | Black Rock Mining | 3% | -3% | -20% | -11% | 0.16 | $157,219,716 |
| RNU | Renascor Res Ltd | 3% | 42% | 39% | 191% | 0.32 | $723,355,157 |
| BC8 | Black Cat Syndicate | 3% | 12% | -29% | -41% | 0.325 | $72,004,624 |
| BSX | Blackstone Ltd | 3% | 10% | -37% | -70% | 0.165 | $78,108,548 |
| KOB | Kobaresourceslimited | 3% | -18% | -8% | 0% | 0.165 | $10,725,000 |
| CZN | Corazon Ltd | 3% | 13% | -32% | -48% | 0.017 | $10,680,785 |
| MEK | Meeka Metals Limited | 3% | 19% | -1% | 47% | 0.069 | $76,867,843 |
| MCR | Mincor Resources NL | 3% | 12% | -35% | 33% | 1.595 | $814,981,967 |
| LEL | Lithenergy | 3% | -12% | -19% | 15% | 0.925 | $56,841,750 |
| TAR | Taruga Minerals | 3% | 19% | 55% | -5% | 0.038 | $27,221,652 |
| L1M | Lightning Minerals | 3% | 0% | 0% | 0% | 0.205 | $7,826,962 |
| ARU | Arafura Rare Earths | 2% | 36% | -14% | 118% | 0.415 | $716,889,671 |
| MAN | Mandrake Res Ltd | 2% | 0% | -13% | -13% | 0.042 | $24,309,996 |
| VUL | Vulcan Energy | 2% | 1% | -6% | -28% | 7.21 | $1,054,947,815 |
| AKN | Auking Mining Ltd | 2% | -13% | -3% | -31% | 0.096 | $10,887,803 |
| BCA | Black Canyon Limited | 2% | 4% | -20% | -19% | 0.24 | $11,210,619 |
| WIN | Widgienickellimited | 2% | 46% | 42% | 143% | 0.51 | $129,271,606 |
| MQR | Marquee Resource Ltd | 2% | 0% | -47% | -61% | 0.056 | $17,468,967 |
| KFM | Kingfisher Mining | 2% | 2% | 65% | 220% | 0.56 | $26,787,001 |
| WC8 | Wildcat Resources | 2% | -2% | -20% | -39% | 0.0295 | $18,536,636 |
| BRB | Breaker Res NL | 2% | 11% | 39% | 0% | 0.305 | $101,104,795 |
| NMT | Neometals Ltd | 2% | -9% | -21% | -15% | 0.995 | $558,268,588 |
| AXE | Archer Materials | 2% | -3% | -15% | -41% | 0.67 | $166,808,029 |
| CAI | Calidus Resources | 1% | 1% | -57% | -39% | 0.355 | $159,845,072 |
| ESS | Essential Metals Ltd | 1% | -12% | -19% | 141% | 0.41 | $110,059,670 |
| AS2 | Askarimetalslimited | 1% | 4% | 0% | 108% | 0.415 | $19,982,344 |
| GLN | Galan Lithium Ltd | 1% | -20% | -1% | -10% | 1.36 | $426,397,833 |
| CWX | Carawine Resources | 1% | 7% | -39% | -52% | 0.092 | $17,910,390 |
| BUX | Buxton Resources Ltd | 1% | 0% | 19% | 24% | 0.099 | $15,403,763 |
| KNI | Kunikolimited | 1% | -19% | -37% | -56% | 0.54 | $27,502,785 |
| PNN | Power Minerals Ltd | 1% | 6% | 17% | 37% | 0.575 | $41,851,805 |
| CXO | Core Lithium | 1% | -8% | 7% | 148% | 1.3 | $2,408,198,439 |
| IPX | Iperionx Limited | 1% | -6% | -12% | -12% | 0.735 | $132,699,756 |
| OZL | OZ Minerals | 0% | 10% | 11% | 3% | 27.33 | $9,168,666,618 |
| VIA | Viagold Rare Earth | 0% | 0% | 0% | 0% | 2 | $166,624,808 |
| LPI | Lithium Pwr Int Ltd | 0% | -6% | 0% | 12% | 0.51 | $205,380,591 |
| QXR | Qx Resources Limited | 0% | -33% | 23% | 157% | 0.054 | $49,384,290 |
| AZL | Arizona Lithium Ltd | 0% | -8% | -44% | -17% | 0.073 | $180,744,417 |
| HNR | Hannans Ltd | 0% | 0% | 0% | -45% | 0.021 | $56,831,701 |
| COB | Cobalt Blue Ltd | 0% | -4% | -21% | 70% | 0.635 | $222,751,247 |
| LPD | Lepidico Ltd | 0% | -6% | -45% | -61% | 0.016 | $129,842,111 |
| SRL | Sunrise | 0% | 3% | -33% | 15% | 2.05 | $185,519,231 |
| AVZ | AVZ Minerals Ltd | 0% | 0% | 0% | 27% | 0.78 | $2,752,409,203 |
| GED | Golden Deeps | 0% | -9% | -44% | -23% | 0.01 | $10,397,040 |
| SRI | Sipa Resources Ltd | 0% | -25% | 5% | -23% | 0.04 | $9,079,437 |
| NTU | Northern Min Ltd | 0% | 0% | -5% | -22% | 0.042 | $213,261,128 |
| IXR | Ionic Rare Earths | 0% | -10% | -25% | -7% | 0.038 | $149,818,987 |
| EVG | Evion Group NL | 0% | 2% | -5% | -18% | 0.09 | $25,681,452 |
| SGQ | St George Min Ltd | 0% | -3% | 100% | 19% | 0.076 | $56,101,425 |
| TKL | Traka Resources | 0% | 0% | -25% | -54% | 0.006 | $4,132,647 |
| AVL | Aust Vanadium Ltd | 0% | -19% | -38% | -10% | 0.026 | $106,655,667 |
| FFX | Firefinch Ltd | 0% | 0% | -42% | -29% | 0.2 | $236,248,644 |
| ATM | Aneka Tambang | 0% | 5% | -16% | 0% | 1.05 | $1,368,831 |
| ALY | Alchemy Resource Ltd | 0% | -25% | 13% | 145% | 0.027 | $31,808,059 |
| LML | Lincoln Minerals | 0% | 0% | 0% | 0% | 0.006854 | $3,941,168 |
| 1MC | Morella Corporation | 0% | -15% | -29% | -73% | 0.017 | $104,428,004 |
| PUR | Pursuit Minerals | 0% | 10% | -45% | -62% | 0.011 | $11,479,061 |
| PEK | Peak Rare Earths Ltd | 0% | 11% | 4% | -36% | 0.47 | $95,380,327 |
| BOA | Boadicea Resources | 0% | 0% | -41% | -51% | 0.1 | $7,769,990 |
| MLS | Metals Australia | 0% | 13% | -40% | 13% | 0.045 | $26,709,592 |
| BNR | Bulletin Res Ltd | 0% | -12% | -32% | 40% | 0.115 | $35,110,932 |
| AX8 | Accelerate Resources | 0% | 0% | -12% | -24% | 0.029 | $9,019,804 |
| LSR | Lodestar Minerals | 0% | 0% | -38% | -44% | 0.005 | $8,692,187 |
| AZL | Arizona Lithium Ltd | 0% | -8% | -44% | -17% | 0.073 | $180,744,417 |
| ENT | Enterprise Metals | 0% | 0% | -36% | -40% | 0.009 | $6,345,726 |
| SCN | Scorpion Minerals | 0% | 7% | -23% | -4% | 0.074 | $24,026,846 |
| AOA | Ausmon Resorces | 0% | 17% | -13% | 17% | 0.007 | $6,001,025 |
| EMT | Emetals Limited | 0% | -24% | 0% | -30% | 0.013 | $10,200,000 |
| ODE | Odessa Minerals Ltd | 0% | -13% | -13% | 180% | 0.014 | $9,012,051 |
| PEK | Peak Rare Earths Ltd | 0% | 11% | 4% | -36% | 0.47 | $95,380,327 |
| ODE | Odessa Minerals Ltd | 0% | -13% | -13% | 180% | 0.014 | $9,012,051 |
| EMT | Emetals Limited | 0% | -24% | 0% | -30% | 0.013 | $10,200,000 |
| AOA | Ausmon Resorces | 0% | 17% | -13% | 17% | 0.007 | $6,001,025 |
| PTR | Petratherm Ltd | 0% | 3% | -43% | 20% | 0.06 | $13,485,068 |
| CY5 | Cygnus Gold Limited | 0% | -9% | 188% | 172% | 0.49 | $83,674,658 |
| A11 | Atlantic Lithium | -1% | -11% | 0% | 0% | 0.765 | $463,392,370 |
| GL1 | Globallith | -1% | -1% | 40% | 295% | 2.29 | $495,586,936 |
| E25 | Element 25 Ltd | -1% | -11% | 62% | 0% | 1.07 | $208,642,914 |
| GAL | Galileo Mining Ltd | -1% | -10% | -44% | 344% | 1 | $201,577,426 |
| OCN | Oceanalithiumlimited | -1% | -1% | 0% | 0% | 0.49 | $16,179,750 |
| GME | GME Resources Ltd | -1% | 11% | -31% | 58% | 0.09 | $61,680,603 |
| ASM | Ausstratmaterials | -1% | -4% | -66% | -85% | 1.695 | $281,951,854 |
| ASM | Ausstratmaterials | -1% | -4% | -66% | -85% | 1.695 | $281,951,854 |
| LMG | Latrobe Magnesium | -1% | -5% | 9% | -14% | 0.075 | $123,232,084 |
| LIT | Lithium Australia | -2% | -2% | -42% | -55% | 0.049 | $61,059,584 |
| EMH | European Metals Hldg | -2% | -9% | -23% | -47% | 0.73 | $89,649,578 |
| ETM | Energy Transition | -2% | 2% | -23% | -39% | 0.048 | $63,719,969 |
| EMS | Eastern Metals | -2% | -28% | -43% | -56% | 0.094 | $3,828,312 |
| NVA | Nova Minerals Ltd | -2% | -11% | 4% | -45% | 0.695 | $158,294,261 |
| ASN | Anson Resources Ltd | -2% | -27% | 63% | 91% | 0.22 | $252,817,210 |
| KZR | Kalamazoo Resources | -2% | 13% | -36% | -35% | 0.22 | $33,484,359 |
| NC1 | Nicoresourceslimited | -3% | 48% | -40% | 0% | 0.725 | $64,185,251 |
| PNT | Panthermetalsltd | -3% | -10% | -8% | 0% | 0.18 | $5,337,500 |
| LEG | Legend Mining | -3% | 0% | -50% | -33% | 0.035 | $96,429,750 |
| DTM | Dart Mining NL | -3% | 1% | 3% | -26% | 0.068 | $10,247,171 |
| WCN | White Cliff Min Ltd | -3% | -6% | -11% | 6% | 0.017 | $12,335,455 |
| PRL | Province Resources | -3% | -22% | -22% | -57% | 0.064 | $75,615,561 |
| JRL | Jindalee Resources | -3% | -10% | -38% | -7% | 2.1 | $119,922,039 |
| AUZ | Australian Mines Ltd | -3% | -14% | -44% | -72% | 0.058 | $30,118,984 |
| AML | Aeon Metals Ltd. | -3% | 16% | -9% | -28% | 0.029 | $31,795,618 |
| TMT | Technology Metals | -4% | -7% | -15% | 6% | 0.34 | $71,340,349 |
| TEM | Tempest Minerals | -4% | -7% | -48% | 23% | 0.027 | $13,628,687 |
| HRE | Heavy Rare Earths | -4% | -16% | 0% | 0% | 0.135 | $8,328,310 |
| NWM | Norwest Minerals | -4% | -7% | 20% | -40% | 0.05 | $11,105,369 |
| MRC | Mineral Commodities | -4% | 0% | -30% | -25% | 0.073 | $40,234,993 |
| FGR | First Graphene Ltd | -4% | -8% | -11% | -47% | 0.12 | $69,757,966 |
| QPM | Queensland Pacific | -4% | -29% | -23% | -33% | 0.12 | $218,293,490 |
| LLI | Loyal Lithium Ltd | -4% | -23% | 55% | 109% | 0.48 | $22,902,600 |
| CNB | Carnaby Resource Ltd | -4% | -5% | -12% | 189% | 0.81 | $123,599,564 |
| DRE | Dreadnought Resources Ltd | -4% | -16% | 124% | 96% | 0.092 | $298,150,020 |
| EUR | European Lithium Ltd | -5% | -27% | 11% | -30% | 0.08 | $117,388,373 |
| MRR | Minrex Resources Ltd | -5% | -5% | -24% | -15% | 0.039 | $43,394,700 |
| PGM | Platina Resources | -5% | -5% | -54% | -67% | 0.019 | $11,840,426 |
| M2R | Miramar | -5% | -1% | -18% | -53% | 0.094 | $6,785,447 |
| CTN | Catalina Resources | -5% | 29% | -5% | 0% | 0.009 | $11,146,382 |
| AAJ | Aruma Resources Ltd | -5% | -4% | -8% | 6% | 0.071 | $11,458,190 |
| NWC | New World Resources | -5% | 3% | -19% | -48% | 0.035 | $70,372,307 |
| FRB | Firebird Metals | -5% | -8% | -51% | -57% | 0.175 | $13,132,744 |
| FTL | Firetail Resources | -5% | 6% | -42% | 0% | 0.175 | $11,700,000 |
| OMH | OM Holdings Limited | -5% | -10% | -17% | -24% | 0.695 | $509,650,103 |
| NVX | Novonix Limited | -6% | -21% | -44% | -75% | 2.06 | $1,099,896,583 |
| EMN | Euromanganese | -6% | -4% | 20% | -38% | 0.33 | $88,557,973 |
| TKM | Trek Metals Ltd | -6% | 25% | -2% | -20% | 0.08 | $29,479,552 |
| BMM | Balkanminingandmin | -7% | -3% | 8% | -30% | 0.28 | $12,473,119 |
| TMB | Tambourahmetals | -7% | 0% | -33% | -40% | 0.14 | $6,384,853 |
| AOU | Auroch Minerals Ltd | -7% | -2% | -39% | -55% | 0.052 | $19,668,925 |
| LPM | Lithium Plus | -7% | -16% | 9% | 0% | 0.52 | $23,967,037 |
| AOU | Auroch Minerals Ltd | -7% | -2% | -39% | -55% | 0.052 | $19,668,925 |
| JRV | Jervois Global Ltd | -7% | -34% | -58% | -39% | 0.32 | $692,391,894 |
| RDT | Red Dirt Metals Ltd | -7% | -9% | 4% | -22% | 0.51 | $171,355,515 |
| POS | Poseidon Nick Ltd | -7% | -16% | -41% | -58% | 0.038 | $113,366,502 |
| TNG | TNG Limited | -7% | 7% | 28% | 13% | 0.088 | $127,734,476 |
| VML | Vital Metals Limited | -7% | -19% | -52% | -53% | 0.025 | $137,959,894 |
| SRZ | Stellar Resources | -8% | -8% | -43% | -48% | 0.012 | $13,060,202 |
| VMS | Venture Minerals | -8% | 14% | -40% | -41% | 0.024 | $42,298,982 |
| PAM | Pan Asia Metals | -8% | 11% | -25% | -10% | 0.415 | $63,882,182 |
| IDA | Indiana Resources | -8% | -4% | -4% | -15% | 0.052 | $25,906,655 |
| A8G | Australasian Metals | -8% | 0% | -37% | -47% | 0.23 | $9,469,214 |
| MOH | Moho Resources | -8% | 0% | -30% | -63% | 0.023 | $4,776,231 |
| WC1 | Westcobarmetals | -8% | 0% | 31% | 21% | 0.17 | $15,684,992 |
| INF | Infinity Lithium | -8% | -20% | 27% | -3% | 0.165 | $78,581,156 |
| RLC | Reedy Lagoon Corp. | -8% | 10% | -52% | -68% | 0.011 | $6,131,696 |
| IG6 | Internationalgraphit | -8% | -11% | -28% | 0% | 0.27 | $25,076,611 |
| KGD | Kula Gold Limited | -9% | -16% | 12% | -29% | 0.032 | $11,558,781 |
| LNR | Lanthanein Resources | -9% | -9% | 52% | 60% | 0.032 | $29,847,593 |
| PSC | Prospect Res Ltd | -9% | 50% | 214% | 339% | 0.15 | $76,272,811 |
| FRS | Forrestaniaresources | -9% | -41% | -19% | -47% | 0.15 | $7,815,072 |
| AM7 | Arcadia Minerals | -9% | -6% | 4% | 29% | 0.245 | $11,907,962 |
| VMC | Venus Metals Cor Ltd | -10% | -10% | -25% | -25% | 0.135 | $24,040,622 |
| DM1 | Desert Metals | -10% | -18% | 23% | 17% | 0.27 | $15,171,536 |
| CRR | Critical Resources | -11% | -7% | -28% | 9% | 0.051 | $78,891,914 |
| PGD | Peregrine Gold | -11% | -7% | -11% | 9% | 0.42 | $16,469,553 |
| CMO | Cosmometalslimited | -11% | -26% | -11% | 0% | 0.125 | $3,443,850 |
| AZS | Azure Minerals | -11% | -19% | -21% | -25% | 0.24 | $79,618,110 |
| ADV | Ardiden Ltd | -11% | 33% | -27% | -30% | 0.008 | $21,346,683 |
| SLZ | Sultan Resources Ltd | -11% | -19% | -45% | -53% | 0.08 | $6,662,751 |
| RAG | Ragnar Metals Ltd | -11% | -16% | -65% | -56% | 0.016 | $6,446,143 |
| CMX | Chemxmaterials | -11% | 7% | -20% | 0% | 0.16 | $7,498,580 |
| RR1 | Reach Resources Ltd | -11% | -20% | -20% | -56% | 0.004 | $6,685,177 |
| RGL | Riversgold | -11% | -28% | -23% | 80% | 0.031 | $32,145,902 |
| CLA | Celsius Resource Ltd | -12% | 50% | -25% | -38% | 0.015 | $21,039,607 |
| VTM | Victory Metals Ltd | -12% | 29% | 45% | 2% | 0.225 | $11,494,713 |
| ARL | Ardea Resources Ltd | -12% | 3% | -32% | 63% | 0.855 | $155,310,061 |
| NKL | Nickelxltd | -12% | -37% | -47% | -27% | 0.088 | $6,968,002 |
| ZNC | Zenith Minerals Ltd | -12% | 0% | -25% | 24% | 0.285 | $103,637,801 |
| GSM | Golden State Mining | -13% | 20% | -23% | -48% | 0.048 | $5,616,682 |
| KAI | Kairos Minerals Ltd | -14% | -17% | 0% | -7% | 0.025 | $51,066,431 |
| EGR | Ecograf Limited | -15% | -21% | -34% | -62% | 0.26 | $123,841,701 |
| EVR | Ev Resources Ltd | -15% | -26% | -55% | -70% | 0.017 | $15,792,729 |
| AZI | Altamin Limited | -16% | -7% | -16% | 16% | 0.08 | $32,512,490 |
| MTM | Mtmongerresources | -16% | -8% | -56% | -32% | 0.092 | $4,777,224 |
| CLZ | Classic Min Ltd | -17% | -9% | -93% | -93% | 0.01 | $7,363,833 |
| SUM | Summitminerals | -17% | -21% | 0% | 0% | 0.15 | $3,956,408 |
| EFE | Eastern Resources | -17% | -8% | 17% | -45% | 0.034 | $37,531,644 |
| CDT | Castle Minerals | -17% | 4% | -33% | -4% | 0.024 | $24,987,325 |
| ARN | Aldoro Resources | -18% | -14% | 32% | -35% | 0.27 | $30,398,576 |
| MRD | Mount Ridley Mines | -20% | -20% | -43% | -50% | 0.004 | $27,746,019 |
| IPT | Impact Minerals | -20% | 23% | -27% | -37% | 0.008 | $21,091,650 |
| CNJ | Conico Ltd | -20% | -27% | -78% | -79% | 0.008 | $13,094,713 |
| MRD | Mount Ridley Mines | -20% | -20% | -43% | -50% | 0.004 | $27,746,019 |
| LIN | Lindian Resources | -21% | 3% | 90% | 494% | 0.19 | $171,818,793 |
| GW1 | Greenwing Resources | -21% | -11% | 0% | -42% | 0.28 | $37,230,612 |
| ADD | Adavale Resource Ltd | -21% | -24% | -19% | -47% | 0.022 | $12,243,496 |
| OD6 | Od6Metalsltd | -25% | 69% | 0% | 0% | 0.44 | $19,736,198 |
| EV1 | Evolution Energy Minerals | 15.5% | 0% | -31.5% | -41% | 0.26 | $39,160,000 |
| 1AE | Aurora Energy Metals | 7.5% | 2% | -17% | -17% | 0.22 | $25,840,000 |
| FG1 | Flynngold | -25% | -16% | -25% | -48% | 0.097 | $7,046,716 |
| THR | Thor Mining PLC | -28% | -28% | -50% | -54% | 0.0065 | $7,720,184 |
| WKT | Walkabout Resources | -39% | -39% | -39% | -31% | 0.105 | $63,334,341 |
Related Topics

Related Stories


SUBSCRIBE
Get the latest breaking news and stocks straight to your inbox.
It's free. Unsubscribe whenever you want.
By proceeding, you confirm you understand that we handle personal information in accordance with our Privacy Policy.


