Gold Digger: Just feast your eyes on this giant nugget from the Beta Hunt mine

Beta Hunt artist Rob Walker with his installation "Sample from Muck Pile". Picture: CNW Group/Karora Resources
- TSX listed Korara Resources finds another massive nugget stash at the Beta Hunt mine near Kalgoorlie
- The new discovery just below the super-rich, 30,000oz Fathers Day Vein
- China imported more than 80 tons (or 2.56Moz) of gold worth $US4.4bn from Switzerland in July; a 6 year record
Our Gold Digger column wraps all the news driving ASX stocks with exposure to precious metals.
MASSIVE. Let’s look at it again:
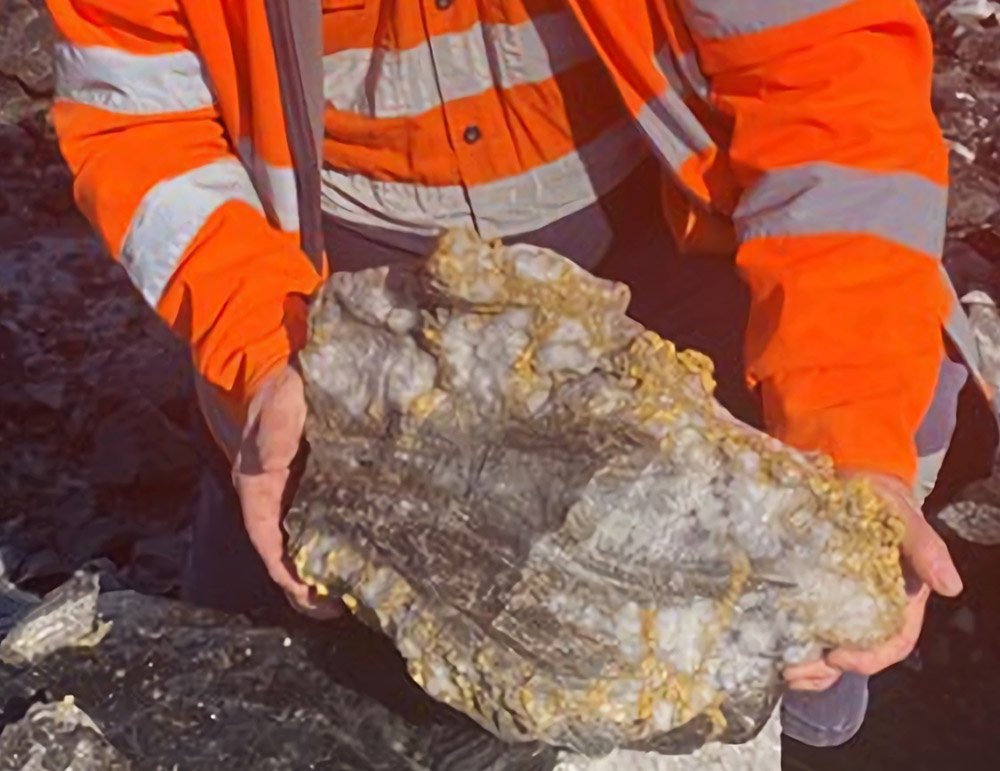
The nugg was part of new, accidental high-grade discovery at the Beta Hunt mine near Kalgoorlie.
Importantly, it is just below the well-known “Fathers Day Vein” discovery originally announced in September 2018 that yielded ~30,000 ounces of gold from a structure just 10m long.
These high grade gold bags don’t come along very often. Fathers Day would ultimately launch Karora into profitability, the company says.
“Although it is too early to estimate the potential size of the new coarse gold occurrence, it is a very positive development as the area was exposed during normal mine development and this additional high-grade mineralization is not included in our Mineral Resource and is a bonus to normal mine production, which serves to lower costs and increase production,” it says.
“…not included in our Mineral Resource and is a bonus to normal mine production“. Happy days.
Karora is aiming for 185,000-205,000 ounces per annum by 2024 at its integrated Beta Hunt mine and Higginsville Gold Operations (HGO).
China is importing a record amount of gold
Much of the world’s gold production touches Swiss soil.
The central European country is the world’s biggest gold refiner – four of the biggest refineries are Swiss – which also makes it the largest importer and exporter.
Its export data is often used to gauge which countries are buying gold, and how much.
While Swiss gold imports last month were 157t — broadly in line with the totals from May and June – it exported over total 200 tonnes of Swiss gold in July, the highest monthly total since December 2016 (297t).
“A 147% jump in exports to China was the main driver, but significant increases were seen in most major markets,” says World Gold Council analyst Krishan Gopaul in a tweet.
Here is a longer term view of monthly total Swiss #gold exports. pic.twitter.com/aHOK9qiK75
— Krishan Gopaul (@KrishanGopaul) August 18, 2022
All up, China shipped in more than 80 tons (or 2.56Moz) of gold worth $US4.4bn from Switzerland in July – a ~6-year record, and the second highest since 2012.
Chinese gold ETF holdings also saw their largest inflows since April 2020, according to The World Gold Council.
Why is China loving gold so much?
“First, the CSI300 stock index (the top 300 stocks on the Shanghai/Shenzen stock exchanges) plummeted by 8% in July, its worst month since October 2018, leading to higher safe-haven demand,” says Ray Jia, senior analyst China at the World Gold Council.
The Chinese economy more generally isn’t looking crash hot.
It is times of “institutional unrest” like these that Tom Luongo, author of the Gold, Goats ‘n Guns newsletter, advocates investors look at, er, gold, goats, and guns as assets for their portfolio.
Are gold, goats, and guns ‘insurance’ against the coming ‘collapse’? – T… https://t.co/mnefeB3vgJ @KitcoNewsNOW asks the expert.. they thought that was me
— Tom Luongo (#YooVilEetZeBugz) (@TFL1728) August 18, 2022
Secondly, some COVID lockdown restrictions were lifted, which could have sparked additional demand.
And third – “the local gold price stabilised after a steep fall in June, attracting long-term gold investors to enter the market or increase their holdings at lower costs,” Ray Jia says.
People tend to buy when prices fall, funnily enough.
Winners & Losers
Here’s how ASX-listed precious metals stocks are performing:
Scroll or swipe to reveal table. Click headings to sort. Best viewed on a laptop.
Stocks missing from this list? Email [email protected]
| CODE | COMPANY | 1 WEEK RETURN % | 1 MONTH RETURN % | 6 MONTH RETURN % | 1 YEAR RETURN % | PRICE | MARKET CAP |
|---|---|---|---|---|---|---|---|
| AVW | Avira Resources Ltd | 67% | 67% | -17% | 25% | 0.005 | $10,593,950.00 |
| SI6 | SI6 Metals Limited | 50% | 29% | -10% | -25% | 0.009 | $11,905,512.63 |
| MEG | Megado Minerals Ltd | 35% | 46% | 34% | 15% | 0.115 | $12,540,611.77 |
| MCT | Metalicity Limited | 33% | 33% | -48% | -54% | 0.004 | $10,376,118.02 |
| DDD | 3D Resources Limited | 33% | 0% | -33% | -50% | 0.002 | $8,863,744.18 |
| GCY | Gascoyne Res Ltd | 31% | 51% | 25% | 4% | 0.355 | $151,242,515.17 |
| M2R | Miramar | 31% | 43% | -33% | -28% | 0.13 | $7,060,532.93 |
| HMG | Hamelingoldlimited | 31% | 58% | 6% | 0% | 0.19 | $22,000,000.00 |
| HAV | Havilah Resources | 30% | 52% | 115% | 87% | 0.365 | $115,573,311.65 |
| DRE | Dreadnought Resources Ltd | 30% | 134% | 162% | 162% | 0.1075 | $285,857,153.79 |
| TAR | Taruga Minerals | 28% | 33% | -3% | -33% | 0.032 | $18,497,543.68 |
| SPQ | Superior Resources | 26% | 72% | 49% | 415% | 0.067 | $112,280,547.59 |
| AM7 | Arcadia Minerals | 26% | 30% | -19% | 0% | 0.195 | $8,405,620.56 |
| MBK | Metal Bank Ltd | 25% | 11% | -17% | -35% | 0.005 | $13,039,090.80 |
| XAM | Xanadu Mines Ltd | 22% | 50% | 14% | 10% | 0.033 | $42,367,806.45 |
| SBR | Sabre Resources | 20% | 33% | 20% | 50% | 0.006 | $16,738,386.05 |
| GED | Golden Deeps | 19% | 28% | 33% | 45% | 0.016 | $17,328,400.71 |
| BC8 | Black Cat Syndicate | 18% | 39% | -28% | -21% | 0.425 | $75,840,132.13 |
| DTR | Dateline Resources | 17% | 20% | 29% | 22% | 0.11 | $59,487,638.40 |
| CTO | Citigold Corp Ltd | 17% | 17% | -22% | -30% | 0.007 | $19,835,613.64 |
| EMU | EMU NL | 17% | 27% | -18% | -48% | 0.014 | $7,697,402.78 |
| HAW | Hawthorn Resources | 16% | 17% | 12% | 118% | 0.096 | $28,348,827.11 |
| ICG | Inca Minerals Ltd | 15% | -24% | -49% | -49% | 0.054 | $24,094,736.95 |
| NMR | Native Mineral Res | 14% | -25% | -54% | -48% | 0.12 | $5,739,542.76 |
| FG1 | Flynngold | 14% | -5% | -38% | -41% | 0.1 | $6,277,982.90 |
| HRN | Horizon Gold Ltd | 13% | 16% | 3% | 28% | 0.43 | $53,193,166.77 |
| TBA | Tombola Gold Ltd | 13% | -3% | 21% | -27% | 0.035 | $35,344,237.94 |
| ASO | Aston Minerals Ltd | 13% | 1% | -35% | -12% | 0.097 | $106,898,969.66 |
| IPT | Impact Minerals | 13% | 13% | -29% | -29% | 0.009 | $22,332,335.00 |
| VKA | Viking Mines Ltd | 13% | 29% | -36% | -59% | 0.009 | $8,202,067.45 |
| RDN | Raiden Resources Ltd | 13% | 13% | -53% | -59% | 0.009 | $13,360,966.83 |
| ALY | Alchemy Resource Ltd | 12% | 19% | 46% | 39% | 0.019 | $18,108,407.08 |
| LNY | Laneway Res Ltd | 11% | 11% | -25% | 30% | 0.005 | $31,510,082.05 |
| RDS | Redstone Resources | 11% | 43% | -17% | -9% | 0.01 | $7,368,323.96 |
| LCY | Legacy Iron Ore | 11% | 17% | 17% | 50% | 0.021 | $128,136,523.98 |
| BBX | BBX Minerals Ltd | 10% | 3% | -38% | -64% | 0.08 | $34,021,503.25 |
| CY5 | Cygnus Gold Limited | 10% | 53% | 23% | 77% | 0.23 | $33,852,622.45 |
| NWM | Norwest Minerals | 10% | 48% | -13% | -31% | 0.046 | $8,307,939.80 |
| MEK | Meeka Metals Limited | 9% | 38% | 40% | 55% | 0.073 | $67,188,124.35 |
| KNB | Koonenberrygold | 9% | 9% | -38% | 0% | 0.087 | $6,504,040.66 |
| RDT | Red Dirt Metals Ltd | 9% | 54% | -7% | 203% | 0.5 | $149,231,668.74 |
| KTA | Krakatoa Resources | 9% | 24% | 47% | 24% | 0.063 | $21,716,724.77 |
| KAL | Kalgoorliegoldmining | 8% | -16% | -19% | 0% | 0.13 | $9,416,498.00 |
| TCG | Turaco Gold Limited | 8% | 30% | -48% | -50% | 0.065 | $27,801,583.49 |
| GAL | Galileo Mining Ltd | 8% | -12% | 449% | 234% | 1.07 | $211,226,838.20 |
| NES | Nelson Resources. | 8% | 17% | -46% | -66% | 0.014 | $4,120,160.30 |
| GSR | Greenstone Resources | 8% | 51% | 78% | 274% | 0.071 | $77,733,572.99 |
| AQI | Alicanto Min Ltd | 8% | -10% | -46% | -58% | 0.057 | $22,255,389.79 |
| GIB | Gibb River Diamonds | 7% | 33% | 0% | 5% | 0.06 | $12,690,566.70 |
| AXE | Archer Materials | 7% | 54% | -14% | -58% | 0.9 | $221,135,814.23 |
| TG1 | Techgen Metals Ltd | 7% | 24% | 41% | -9% | 0.155 | $6,852,304.48 |
| MAU | Magnetic Resources | 6% | -5% | -26% | -34% | 1.05 | $234,322,861.76 |
| GSM | Golden State Mining | 6% | 31% | -38% | -59% | 0.055 | $6,552,795.42 |
| BTR | Brightstar Resources | 5% | -5% | -31% | -31% | 0.02 | $12,290,356.51 |
| ADN | Andromeda Metals Ltd | 5% | 27% | -45% | -38% | 0.1025 | $298,560,809.47 |
| AUC | Ausgold Limited | 4% | 24% | 8% | 21% | 0.052 | $107,562,150.67 |
| AAR | Astral Resources NL | 4% | 4% | -30% | 0% | 0.08 | $45,905,801.40 |
| ANX | Anax Metals Ltd | 4% | 11% | -12% | 0% | 0.08 | $32,855,880.96 |
| TMZ | Thomson Res Ltd | 4% | 29% | -59% | -75% | 0.027 | $20,411,739.71 |
| STN | Saturn Metals | 3% | 0% | -29% | -35% | 0.3 | $40,268,744.87 |
| FEG | Far East Gold | 3% | 34% | 0% | 0% | 0.455 | $56,137,116.60 |
| CHZ | Chesser Resources | 3% | 2% | -23% | -39% | 0.092 | $54,107,326.12 |
| IGO | IGO Limited | 3% | 28% | 1% | 30% | 12.39 | $9,140,222,502.91 |
| EMR | Emerald Res NL | 3% | 34% | 5% | 44% | 1.165 | $685,320,385.37 |
| RSG | Resolute Mining | 3% | 17% | -1% | -38% | 0.2925 | $309,181,423.32 |
| PGD | Peregrine Gold | 2% | 89% | 45% | 115% | 0.84 | $32,116,161.62 |
| CPM | Coopermetalslimited | 2% | 1% | -18% | 0% | 0.485 | $16,453,221.48 |
| SFR | Sandfire Resources | 2% | 28% | -33% | -18% | 4.965 | $2,013,011,094.63 |
| TUL | Tulla Resources | 2% | -3% | -12% | 3% | 0.53 | $83,312,773.44 |
| AMI | Aurelia Metals Ltd | 2% | -4% | -39% | -18% | 0.275 | $340,190,525.68 |
| NVA | Nova Minerals Ltd | 2% | 17% | -11% | -21% | 0.83 | $147,765,873.70 |
| BCN | Beacon Minerals | 2% | 2% | -21% | -14% | 0.0285 | $103,982,146.18 |
| ZNC | Zenith Minerals Ltd | 2% | 13% | -18% | 40% | 0.3 | $105,152,495.10 |
| GUL | Gullewa Limited | 2% | 3% | -15% | -30% | 0.061 | $11,645,089.10 |
| HRZ | Horizon | 1% | 10% | -42% | -37% | 0.076 | $46,381,132.80 |
| GRL | Godolphin Resources | 1% | -9% | -30% | -39% | 0.091 | $8,657,316.11 |
| NCM | Newcrest Mining | 1% | 5% | -20% | -23% | 19.51 | $16,674,611,021.49 |
| ADT | Adriatic Metals | 0% | 25% | -5% | -18% | 2.16 | $444,626,826.30 |
| NPM | Newpeak Metals | 0% | 0% | 0% | -50% | 0.001 | $8,853,750.03 |
| FFX | Firefinch Ltd | 0% | 0% | -15% | 5% | 0.2 | $236,248,644.20 |
| DCX | Discovex Res Ltd | 0% | 20% | -37% | 26% | 0.006 | $16,512,840.49 |
| AQX | Alice Queen Ltd | 0% | -25% | -57% | -79% | 0.003 | $6,348,544.03 |
| SLZ | Sultan Resources Ltd | 0% | 51% | -10% | -20% | 0.14 | $11,243,392.52 |
| PNX | PNX Metals Limited | 0% | -11% | -27% | -41% | 0.004 | $17,776,231.23 |
| PUA | Peak Minerals Ltd | 0% | 0% | -17% | -44% | 0.01 | $10,413,707.51 |
| MVL | Marvel Gold Limited | 0% | 7% | -44% | -46% | 0.03 | $21,129,581.10 |
| PRX | Prodigy Gold NL | 0% | 15% | -46% | -61% | 0.015 | $8,739,414.09 |
| RND | Rand Mining Ltd | 0% | 7% | 5% | -1% | 1.5 | $85,313,941.50 |
| CAZ | Cazaly Resources | 0% | 0% | -14% | -22% | 0.038 | $14,091,228.13 |
| SIH | Sihayo Gold Limited | 0% | 50% | -63% | -67% | 0.003 | $18,306,384.27 |
| AWV | Anova Metals Ltd | 0% | 67% | -25% | -38% | 0.015 | $20,973,318.80 |
| TRY | Troy Resources Ltd | 0% | 0% | 0% | -5% | 0.0295 | $50,138,963.94 |
| KGM | Kalnorth Gold Ltd | 0% | 0% | 0% | 0% | 0.013 | $11,625,120.78 |
| CGN | Crater Gold Min Ltd | 0% | 0% | 0% | 0% | 0.017 | $21,063,473.65 |
| TSC | Twenty Seven Co. Ltd | 0% | 20% | -25% | 0% | 0.003 | $9,312,848.67 |
| G50 | Gold50Limited | 0% | 16% | -35% | -29% | 0.18 | $10,083,240.18 |
| VMC | Venus Metals Cor Ltd | 0% | 9% | -10% | -3% | 0.175 | $26,412,982.70 |
| RMX | Red Mount Min Ltd | 0% | 17% | -22% | -13% | 0.007 | $11,496,547.01 |
| BYH | Bryah Resources Ltd | 0% | -7% | -46% | -47% | 0.028 | $7,819,097.27 |
| ICL | Iceni Gold | 0% | 13% | -13% | -46% | 0.105 | $12,819,642.80 |
| RML | Resolution Minerals | 0% | 22% | -39% | -48% | 0.011 | $8,643,850.80 |
| AL8 | Alderan Resource Ltd | 0% | -38% | -58% | -81% | 0.01 | $5,315,660.80 |
| GMN | Gold Mountain Ltd | 0% | 0% | -48% | -75% | 0.006 | $7,158,895.02 |
| PF1 | Pathfinder Resources | 0% | 0% | 23% | 72% | 0.5 | $26,560,505.00 |
| CLA | Celsius Resource Ltd | 0% | -10% | -48% | -50% | 0.014 | $20,921,152.60 |
| BGD | Bartongoldholdings | 0% | -3% | -33% | -6% | 0.17 | $14,613,067.91 |
| SVY | Stavely Minerals Ltd | 0% | 9% | -59% | -57% | 0.175 | $56,517,064.80 |
| MM8 | Medallion Metals. | 0% | 17% | -13% | 7% | 0.2 | $20,394,924.14 |
| AUT | Auteco Minerals | 0% | 4% | -44% | -48% | 0.047 | $97,163,201.90 |
| CBY | Canterbury Resources | 0% | 5% | -41% | -60% | 0.044 | $5,420,735.32 |
| LYN | Lycaonresources | 0% | 33% | -19% | 0% | 0.3 | $9,256,437.50 |
| WMC | Wiluna Mining Corp | 0% | 8% | -78% | -76% | 0.205 | $74,238,030.68 |
| NSM | Northstaw | 0% | 10% | -43% | -42% | 0.17 | $6,821,590.00 |
| GSN | Great Southern | 0% | -16% | -32% | -28% | 0.036 | $19,478,523.65 |
| THR | Thor Mining PLC | 0% | -10% | -42% | -31% | 0.009 | $9,680,079.51 |
| BAT | Battery Minerals Ltd | 0% | 0% | -45% | -54% | 0.006 | $17,551,454.07 |
| POL | Polymetals Resources | 0% | 61% | 7% | 7% | 0.145 | $5,971,490.34 |
| ZAG | Zuleika Gold Ltd | 0% | 5% | -36% | -23% | 0.023 | $11,995,664.38 |
| GML | Gateway Mining | 0% | 11% | -23% | -44% | 0.01 | $20,340,957.30 |
| TLM | Talisman Mining | 0% | 14% | -14% | -9% | 0.16 | $27,222,227.07 |
| OAU | Ora Gold Limited | 0% | 10% | -42% | -39% | 0.011 | $10,826,544.11 |
| GNM | Great Northern | 0% | 0% | -17% | -55% | 0.005 | $8,545,254.88 |
| DLC | Delecta Limited | 0% | 0% | 0% | 83% | 0.0275 | $13,253,984.40 |
| ENR | Encounter Resources | 0% | 33% | 10% | 18% | 0.16 | $45,996,439.77 |
| PNM | Pacific Nickel Mines | 0% | 3% | -21% | 41% | 0.076 | $20,616,965.06 |
| AYM | Australia United Min | 0% | 0% | 0% | -14% | 0.006 | $11,055,464.91 |
| ANL | Amani Gold Ltd | 0% | 50% | -25% | 50% | 0.0015 | $35,540,161.69 |
| AGG | AngloGold Ashanti | 0% | 7% | -27% | -9% | 4.4 | $392,514,166.00 |
| X64 | Ten Sixty Four Ltd | -1% | 2% | -18% | -23% | 0.63 | $143,612,469.63 |
| TIE | Tietto Minerals | -1% | 16% | -15% | 58% | 0.52 | $505,016,019.90 |
| SMS | Starmineralslimited | -1% | 10% | -53% | 0% | 0.095 | $2,750,940.00 |
| KSN | Kingston Resources | -1% | -3% | -49% | -54% | 0.09 | $37,205,696.25 |
| AWJ | Auric Mining | -1% | 48% | -18% | -33% | 0.09 | $5,470,770.42 |
| SMI | Santana Minerals Ltd | -1% | 35% | 83% | 691% | 0.87 | $128,193,559.20 |
| CEL | Challenger Exp Ltd | -1% | 20% | -41% | -26% | 0.1925 | $202,973,432.05 |
| AGC | AGC Ltd | -1% | 9% | -19% | -44% | 0.075 | $5,079,546.30 |
| DEX | Duke Exploration | -1% | 14% | -55% | -71% | 0.074 | $6,675,625.25 |
| NAG | Nagambie Resources | -1% | 6% | 44% | 7% | 0.072 | $36,946,523.38 |
| BRV | Big River Gold Ltd | -1% | 4% | 17% | 9% | 0.35 | $87,002,562.50 |
| SKY | SKY Metals Ltd | -2% | 22% | -34% | -33% | 0.06 | $22,607,008.20 |
| OKU | Oklo Resources Ltd | -2% | 12% | 46% | 16% | 0.145 | $73,151,989.46 |
| MGV | Musgrave Minerals | -2% | 17% | -17% | -8% | 0.275 | $150,408,425.72 |
| A8G | Australasian Metals | -2% | 34% | -49% | 96% | 0.275 | $12,145,295.73 |
| BNZ | Benzmining | -2% | 29% | -21% | -30% | 0.515 | $27,124,794.56 |
| DEG | De Grey Mining | -2% | 28% | -21% | -13% | 0.9825 | $1,410,667,806.00 |
| VAN | Vango Mining Ltd | -2% | -2% | 5% | -37% | 0.041 | $49,137,567.65 |
| TRM | Truscott Mining Corp | -3% | -28% | 13% | 9% | 0.036 | $6,314,821.76 |
| CYL | Catalyst Metals | -3% | 1% | -29% | -29% | 1.35 | $129,962,115.36 |
| YRL | Yandal Resources | -3% | 3% | -45% | -68% | 0.165 | $19,155,106.25 |
| PUR | Pursuit Minerals | -3% | 3% | -25% | -72% | 0.0165 | $15,892,787.10 |
| G88 | Golden Mile Res Ltd | -3% | 3% | -45% | -42% | 0.031 | $6,519,443.65 |
| KAI | Kairos Minerals Ltd | -3% | 36% | 20% | 7% | 0.03 | $56,958,711.24 |
| WRM | White Rock Min Ltd | -3% | -19% | -58% | -76% | 0.089 | $16,530,222.96 |
| TTM | Titan Minerals | -3% | -2% | -51% | -47% | 0.056 | $77,562,129.32 |
| FML | Focus Minerals Ltd | -3% | 0% | -49% | -47% | 0.14 | $40,118,210.30 |
| RVR | Red River Resources | -3% | 8% | -36% | -15% | 0.14 | $69,992,705.88 |
| ARN | Aldoro Resources | -4% | 93% | -32% | -47% | 0.27 | $26,390,639.01 |
| CDR | Codrus Minerals Ltd | -4% | 7% | -38% | -52% | 0.08 | $3,080,000.00 |
| MZZ | Matador Mining Ltd | -4% | -14% | -59% | -71% | 0.125 | $32,082,914.88 |
| MEI | Meteoric Resources | -4% | 9% | -25% | -68% | 0.012 | $18,315,568.45 |
| LRL | Labyrinth Resources | -4% | 0% | -49% | -38% | 0.024 | $20,960,802.12 |
| PRU | Perseus Mining Ltd | -4% | 3% | 1% | 14% | 1.655 | $2,232,085,980.27 |
| NXM | Nexus Minerals Ltd | -4% | 12% | -32% | 88% | 0.235 | $66,740,372.13 |
| MEU | Marmota Limited | -4% | -22% | 4% | 2% | 0.047 | $49,673,597.42 |
| TAM | Tanami Gold NL | -4% | -4% | -26% | -40% | 0.045 | $54,054,464.12 |
| PNT | Panthermetalsltd | -4% | 10% | 2% | 0% | 0.225 | $6,525,000.00 |
| TBR | Tribune Res Ltd | -4% | -6% | -20% | -33% | 3.73 | $195,705,927.21 |
| CWX | Carawine Resources | -5% | -5% | -36% | -53% | 0.105 | $14,472,606.44 |
| XTC | Xantippe Res Ltd | -5% | 31% | -5% | 425% | 0.0105 | $81,257,346.58 |
| IDA | Indiana Resources | -5% | 13% | 0% | 11% | 0.062 | $30,707,508.42 |
| SFM | Santa Fe Minerals | -5% | -5% | -58% | -1% | 0.081 | $5,898,321.91 |
| WAF | West African Res Ltd | -5% | 6% | 12% | 27% | 1.34 | $1,342,654,112.05 |
| BMR | Ballymore Resources | -5% | 0% | 19% | 0% | 0.19 | $14,695,616.20 |
| DTM | Dart Mining NL | -5% | 23% | -22% | -31% | 0.076 | $10,279,772.16 |
| A1G | African Gold Ltd. | -5% | 2% | -58% | -43% | 0.095 | $10,746,929.52 |
| RED | Red 5 Limited | -5% | 22% | -13% | 45% | 0.275 | $648,112,503.50 |
| GOR | Gold Road Res Ltd | -5% | 18% | -7% | 10% | 1.36 | $1,439,936,745.74 |
| WGX | Westgold Resources. | -5% | 5% | -43% | -29% | 1.2225 | $573,083,503.30 |
| BGL | Bellevue Gold Ltd | -5% | 22% | -12% | -8% | 0.8325 | $867,663,121.65 |
| AAU | Antilles Gold Ltd | -6% | -14% | -42% | -33% | 0.051 | $20,587,264.05 |
| ASR | Asra Minerals Ltd | -6% | -41% | -41% | -32% | 0.017 | $26,356,707.61 |
| BEZ | Besragoldinc | -6% | -9% | -63% | 0% | 0.032 | $5,499,198.72 |
| KWR | Kingwest Resources | -6% | -7% | -68% | -3% | 0.063 | $18,312,243.17 |
| GMD | Genesis Minerals | -6% | 5% | -26% | 76% | 1.2975 | $362,599,547.50 |
| SLR | Silver Lake Resource | -6% | 8% | -22% | 4% | 1.41 | $1,305,296,414.80 |
| ALK | Alkane Resources Ltd | -6% | 4% | -20% | -22% | 0.745 | $443,709,647.90 |
| MAT | Matsa Resources | -6% | 5% | -31% | -20% | 0.044 | $16,152,957.90 |
| MKR | Manuka Resources. | -6% | -9% | -57% | -50% | 0.145 | $41,472,955.25 |
| KRM | Kingsrose Mining Ltd | -6% | 5% | -18% | 23% | 0.058 | $45,151,591.14 |
| MKG | Mako Gold | -6% | 3% | -20% | -23% | 0.072 | $26,756,912.14 |
| DCN | Dacian Gold Ltd | -7% | 14% | -48% | -54% | 0.1075 | $126,943,687.92 |
| CMM | Capricorn Metals | -7% | 22% | 5% | 87% | 3.915 | $1,454,227,473.35 |
| SBM | St Barbara Limited | -7% | 13% | -31% | -39% | 0.995 | $807,577,420.32 |
| ARL | Ardea Resources Ltd | -7% | 20% | 25% | 116% | 0.99 | $166,343,016.56 |
| BRB | Breaker Res NL | -7% | 11% | -19% | 2% | 0.21 | $70,055,799.74 |
| EVN | Evolution Mining Ltd | -7% | 11% | -38% | -35% | 2.575 | $4,710,829,745.31 |
| SSR | SSR Mining Inc. | -7% | -14% | -17% | -5% | 21.045 | $401,345,751.50 |
| OGC | OceanaGold Corp. | -7% | -15% | -5% | -7% | 2.3 | $160,306,633.56 |
| PRS | Prospech Limited | -7% | -10% | -49% | -67% | 0.027 | $1,759,887.14 |
| TSO | Tesoro Gold Ltd | -7% | -7% | -44% | -62% | 0.04 | $31,647,750.38 |
| RMS | Ramelius Resources | -7% | 1% | -34% | -36% | 0.985 | $832,689,704.64 |
| MOH | Moho Resources | -7% | 24% | -54% | -62% | 0.026 | $4,151,182.44 |
| HMX | Hammer Metals Ltd | -7% | 31% | -18% | -17% | 0.064 | $52,483,792.38 |
| VRC | Volt Resources Ltd | -7% | 19% | -10% | -32% | 0.019 | $59,771,947.99 |
| NST | Northern Star | -7% | 15% | -19% | -18% | 7.8 | $9,053,030,744.94 |
| KCN | Kingsgate Consolid. | -8% | 21% | 11% | 117% | 1.63 | $371,818,361.04 |
| CST | Castile Resources | -8% | -14% | -33% | -47% | 0.12 | $28,395,983.76 |
| BMO | Bastion Minerals | -8% | -8% | -29% | -29% | 0.12 | $9,111,511.20 |
| MTC | Metalstech Ltd | -8% | -3% | 35% | 123% | 0.345 | $54,999,314.70 |
| OZM | Ozaurum Resources | -8% | -12% | -8% | -15% | 0.115 | $7,668,760.00 |
| LM8 | Lunnonmetalslimited | -8% | 12% | 4% | 49% | 0.895 | $95,042,849.86 |
| MRZ | Mont Royal Resources | -8% | -20% | -14% | 15% | 0.275 | $19,105,246.04 |
| MTH | Mithril Resources | -8% | -8% | -58% | -69% | 0.0055 | $16,116,281.73 |
| SNG | Siren Gold | -9% | -19% | -14% | -10% | 0.215 | $22,403,393.02 |
| E2M | E2 Metals | -9% | 19% | -29% | -43% | 0.16 | $31,861,171.68 |
| LEX | Lefroy Exploration | -9% | -5% | -10% | -37% | 0.265 | $39,386,160.36 |
| STK | Strickland Metals | -9% | -5% | -9% | 29% | 0.053 | $67,907,151.05 |
| GBR | Greatbould Resources | -9% | 31% | -36% | 33% | 0.105 | $47,573,119.46 |
| NML | Navarre Minerals Ltd | -9% | 13% | -46% | -40% | 0.052 | $74,769,715.75 |
| RXL | Rox Resources | -9% | 6% | -40% | -32% | 0.26 | $44,769,350.96 |
| RXL | Rox Resources | -9% | 6% | -40% | -32% | 0.26 | $44,769,350.96 |
| MDI | Middle Island Res | -9% | -34% | -39% | -17% | 0.082 | $9,793,457.76 |
| PDI | Predictive Disc Ltd | -9% | 14% | -9% | 52% | 0.205 | $341,527,977.20 |
| SVL | Silver Mines Limited | -9% | 18% | -15% | -17% | 0.1775 | $226,070,625.03 |
| MHC | Manhattan Corp Ltd | -9% | 11% | -41% | -9% | 0.01 | $15,262,786.93 |
| QML | Qmines Limited | -9% | -12% | -46% | -56% | 0.15 | $12,392,509.63 |
| CXU | Cauldron Energy Ltd | -9% | 43% | -55% | -69% | 0.01 | $5,354,112.77 |
| PKO | Peako Limited | -9% | 33% | 5% | -31% | 0.02 | $6,169,082.02 |
| AVM | Advance Metals Ltd | -10% | -18% | -47% | -43% | 0.009 | $4,300,896.62 |
| WWI | West Wits Mining Ltd | -10% | -10% | -60% | -67% | 0.018 | $36,180,678.10 |
| AAJ | Aruma Resources Ltd | -10% | 14% | -31% | -12% | 0.072 | $10,830,343.71 |
| HXG | Hexagon Energy | -10% | -22% | -67% | -75% | 0.018 | $9,232,486.22 |
| SAU | Southern Gold | -10% | 6% | -42% | -49% | 0.035 | $7,466,506.46 |
| MI6 | Minerals260Limited | -11% | 21% | -32% | 0% | 0.34 | $77,000,000.00 |
| RRL | Regis Resources | -11% | 6% | -18% | -35% | 1.6325 | $1,215,513,594.68 |
| AME | Alto Metals Limited | -11% | 21% | -13% | -13% | 0.075 | $40,090,313.40 |
| GWR | GWR Group Ltd | -11% | -31% | -48% | -69% | 0.083 | $26,660,982.37 |
| MXR | Maximus Resources | -11% | 27% | -14% | -26% | 0.057 | $17,539,817.24 |
| PNR | Pantoro Limited | -11% | -1% | -45% | -6% | 0.1825 | $291,591,349.36 |
| ADV | Ardiden Ltd | -11% | 23% | -38% | -33% | 0.008 | $22,680,850.53 |
| CDT | Castle Minerals | -11% | 23% | -41% | 129% | 0.032 | $29,984,789.52 |
| CHN | Chalice Mining Ltd | -11% | 12% | -40% | -27% | 4.43 | $1,666,996,569.42 |
| ERM | Emmerson Resources | -11% | -6% | -26% | 27% | 0.093 | $52,292,139.65 |
| REZ | Resourc & En Grp Ltd | -12% | -4% | -52% | -29% | 0.022 | $10,995,727.36 |
| IVR | Investigator Res Ltd | -12% | 5% | -30% | -34% | 0.043 | $57,289,487.25 |
| TMX | Terrain Minerals | -13% | -13% | -13% | -13% | 0.007 | $6,086,088.07 |
| FAU | First Au Ltd | -13% | -30% | -30% | -42% | 0.007 | $6,519,876.64 |
| KZR | Kalamazoo Resources | -13% | 12% | -30% | -35% | 0.24 | $34,846,649.76 |
| KAU | Kaiser Reef | -13% | 13% | -13% | -20% | 0.17 | $22,722,124.95 |
| OBM | Ora Banda Mining Ltd | -13% | 40% | -5% | -46% | 0.06 | $85,187,212.79 |
| PGO | Pacgold | -13% | -13% | -37% | 98% | 0.465 | $25,557,243.98 |
| OKR | Okapi Resources | -14% | -10% | -32% | -50% | 0.19 | $25,148,686.88 |
| HCH | Hot Chili Ltd | -14% | 18% | -46% | -61% | 0.79 | $94,361,712.74 |
| WCN | White Cliff Min Ltd | -14% | -8% | -60% | 0% | 0.012 | $8,170,042.03 |
| NAE | New Age Exploration | -14% | -14% | -60% | -50% | 0.006 | $8,615,393.46 |
| EM2 | Eagle Mountain | -15% | 15% | -63% | -66% | 0.23 | $60,359,639.18 |
| MRR | Minrex Resources Ltd | -15% | 78% | -12% | 235% | 0.057 | $55,762,964.56 |
| GBZ | GBM Rsources Ltd | -15% | 0% | -54% | -50% | 0.057 | $32,796,701.10 |
| AZS | Azure Minerals | -15% | 10% | -48% | 2% | 0.225 | $71,469,215.83 |
| KCC | Kincora Copper | -16% | -6% | -55% | -73% | 0.058 | $4,415,047.14 |
| GMR | Golden Rim Resources | -17% | -25% | -58% | -63% | 0.044 | $13,498,276.03 |
| CAI | Calidus Resources | -17% | 0% | -11% | 32% | 0.635 | $259,036,158.33 |
| BNR | Bulletin Res Ltd | -18% | 33% | -13% | 150% | 0.14 | $43,888,665.00 |
| KIN | KIN Min NL | -18% | -3% | -26% | -34% | 0.078 | $67,558,447.87 |
| GTR | Gti Energy Ltd | -18% | 11% | -26% | -12% | 0.0155 | $22,387,253.69 |
| SRN | Surefire Rescs NL | -18% | -26% | 11% | 3% | 0.0155 | $25,301,815.63 |
| RGL | Riversgold | -20% | 29% | 77% | 10% | 0.036 | $27,760,891.75 |
| S2R | S2 Resources | -20% | 0% | -30% | 0% | 0.14 | $53,456,228.25 |
| LCL | Los Cerros Limited | -21% | 10% | -72% | -77% | 0.034 | $22,772,709.93 |
| MLS | Metals Australia | -22% | 21% | 29% | 45% | 0.058 | $34,082,171.46 |
| ARV | Artemis Resources | -23% | 32% | -47% | -40% | 0.037 | $55,533,239.36 |
| M24 | Mamba Exploration | -29% | 27% | -47% | -47% | 0.1 | $4,217,500.30 |
Related Topics

Related Stories


UNLOCK INSIGHTS
Discover the untold stories of emerging ASX stocks.
Daily news and expert analysis, it's free to subscribe.
By proceeding, you confirm you understand that we handle personal information in accordance with our Privacy Policy.


