Gold Digger: Gold miners could still outperform after massive FY2025

Tariff uncertainty and a US dollar flop has sent investors flocking to safe haven assets. Pic: Getty Images
- Gold miners outperform key market indices in first half of 2025
- But some fund managers continue to see gold miners as undervalued
- Big price moves for Falcon Metals and Yandal Resources this week
This chart from Sprott’s latest gold and silver update gives a strong sense of the outperformance of gold equities this year as tariff uncertainty and a US dollar flop has sent investors flocking to safe haven assets.
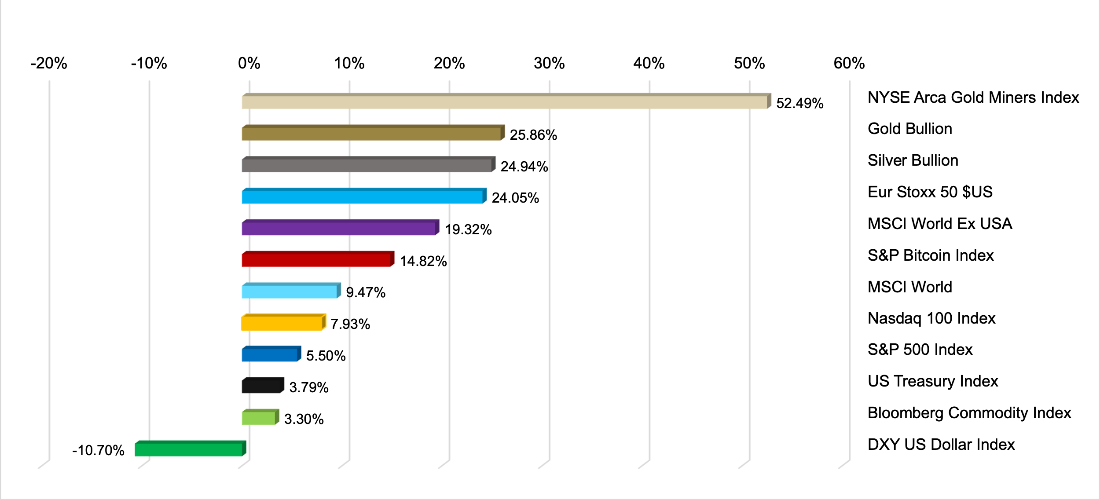
Stock indices continue to perform strongly, but not as well as precious metals, with gold and silver bullion up around 25% to the end of June.
Some good reasons behind that, Sprott’s Paul Wong says.
“While markets continue to recover from the early April selloff, the longer-term policy and structural risks remain in place and mostly unresolved,” he said in the note.
“These include the unsustainable and worsening trajectory of the US fiscal debt and deficit situation, a weakening US dollar policy, institutional erosion, rule of law and corruption, ongoing trade and tariff tensions, unilateral and capricious policy actions, and the list grows.
“Taken in its entirety, we believe gold is being bought as a safe haven asset due to the US dollar’s eroding store of value role and the fracturing of trust across nearly all global monetary and political orders and systems.”
And those haven’t come close to gold stocks, which have surged 53%, according to the NYSE Arca Gold Miners Index
Margin expansion, which typically runs proportionally ahead of the change in the actual gold price when prices are on the up, has been a big factor.
That, on the face of things, could make gold stocks look a little overvalued at the moment, given equities have surged by a factor of 2x the gold price in 2025 so far.
Not so, this fundie says
It’s always worth noting fundies tend to speak their own book.
But after a 54.2% YTD gain, Cameron Judd, the portfolio manager out of Victor Smorgon Partners’ gold fund, is understandably bullish.
In an update on Thursday he noted the average Aussie dollar gold price in the quarter was $5129/oz, a 12% increase on the March quarter that came in as the largest absolute increase in 46 years.
“Given the sustained and steady increase in gold prices, gold miners continue to report higher revenues and investors are watching closely for higher margins to result in accelerating cashflows,” Judd said.
“We believe gold producers that can contain costs and demonstrate an ability to convert higher prices into cash on the balance sheet will be further rewarded through the second half of 2025.”
Data out of the World Gold Council in its annual survey of central banks showed a record number central banks, powered by emerging markets institutions, expect central banks to accumulate gold in 2025.
At ~1000t over the past three years, the buying trend had doubled from the average seen over the previous decade, Judd noted.
He sees gold heading as high as US$4000/oz.
“The gold price has risen for six straight months since the start of 2025. Gold’s performance during times of crisis, portfolio diversification and inflation hedging are key themes driving central bank and other investors to accumulate more gold, which is maintaining upward pressure on the price,” he said.
“Victor Smorgon Partners holds the view that a 5% to 10% allocation of gold in a diversified portfolio of assets will provide superior risk-adjusted returns with lower volatility over time.”
VSP’s gold strategy has an estimated net return of 115.4% since its inception in May 2020, with the ASX gold equities index up 63.5% in the same time. Performance was less stellar in the back end of FY25, down 4.2% in the month of June and up 1.9% for the June quarter.
Can the good times continue for gold stock pickers? The question may be less about the value of gold equities against gold and more about the value of gold equities compared to the rest of the market, Judd thinks.
“Despite the strong gold price performance and fundamentals supporting further appreciation, gold miners are trading at discounted valuations on the ASX. (Emphasis not ours.)
“Gold miners represent the most compelling opportunity in the gold sector. Gold miners are generating significant free cash flow, with implied margins at record highs exceeding A$1,500 /oz of production.
“The ASX gold sector is trading on a 12-month forward EV/EBITDA of 4.5 times, significantly lower than the ASX All Ordinaries which is trading on 10.5 times.”
VSP’s gold fund has 26% of its holding in +1Mozpa producers with 39% in mid-tiers producing less than 1Mozpa.
On top of that, 8% of the allocation is in developers with 22% in explorers and 5% in cash. The vast bulk of its listed company investments are in Australia at 69%.
Winners and losers
Here’s how ASX-listed precious metals stocks are performing:
| CODE | COMPANY | PRICE | WEEK % | MONTH % | 6 MONTH % | YEAR % | YTD % | MARKET CAP |
|---|---|---|---|---|---|---|---|---|
| MRR | Minrex Resources Ltd | 0.0085 | 0% | -6% | 6% | 6% | 21% | $ 8,678,940.02 |
| NPM | Newpeak Metals | 0.027 | 29% | 145% | 108% | 100% | 145% | $ 6,763,506.35 |
| MTC | Metalstech Ltd | 0.13 | 13% | -7% | -10% | -43% | -7% | $ 27,133,811.38 |
| GED | Golden Deeps | 0.022 | 0% | -4% | -8% | -33% | -12% | $ 3,719,639.72 |
| G88 | Golden Mile Res Ltd | 0.01 | -9% | -17% | 11% | -9% | 11% | $ 5,986,726.41 |
| LAT | Latitude 66 Limited | 0.041 | 17% | 8% | -11% | -73% | 8% | $ 5,449,226.79 |
| NMR | Native Mineral Res | 0.175 | 0% | -10% | 338% | 775% | 349% | $ 151,526,022.29 |
| AQX | Alice Queen Ltd | 0.003 | -14% | 0% | -63% | -63% | -63% | $ 4,998,560.27 |
| SLZ | Sultan Resources Ltd | 0.006 | 0% | 20% | 0% | -25% | 0% | $ 1,388,819.46 |
| KSN | Kingston Resources | 0.1425 | 4% | 19% | 85% | 83% | 101% | $ 116,668,604.22 |
| AMI | Aurelia Metals Ltd | 0.1925 | -1% | -39% | 7% | -13% | 13% | $ 338,514,528.00 |
| GIB | Gibb River Diamonds | 0.034 | 13% | 3% | -15% | -8% | -15% | $ 6,864,302.24 |
| KCN | Kingsgate Consolid. | 2.55 | 7% | 19% | 93% | 61% | 98% | $ 644,379,230.00 |
| TMX | Terrain Minerals | 0.002 | -20% | -20% | -43% | -33% | -33% | $ 5,063,628.55 |
| BNR | Bulletin Res Ltd | 0.059 | 7% | -8% | 51% | 40% | 51% | $ 17,323,186.06 |
| NXM | Nexus Minerals Ltd | 0.07 | 1% | -21% | 49% | 75% | 56% | $ 42,263,172.91 |
| SKY | SKY Metals Ltd | 0.063 | 7% | 40% | 21% | 80% | 17% | $ 43,352,893.13 |
| LM8 | Lunnonmetalslimited | 0.22 | -10% | 0% | 5% | 16% | -12% | $ 47,435,057.41 |
| CST | Castile Resources | 0.058 | 0% | 0% | -16% | -12% | -28% | $ 17,427,669.06 |
| YRL | Yandal Resources | 0.17 | 98% | 42% | -8% | 36% | -3% | $ 52,569,946.94 |
| FAU | First Au Ltd | 0.0035 | -13% | 17% | 75% | 75% | 75% | $ 7,267,019.47 |
| ARL | Ardea Resources Ltd | 0.425 | 6% | 5% | 35% | -10% | 29% | $ 88,373,424.30 |
| GWR | GWR Group Ltd | 0.098 | 7% | 5% | 24% | 14% | 23% | $ 31,713,452.19 |
| IVR | Investigator Res Ltd | 0.026 | 8% | -26% | 24% | -46% | 30% | $ 41,585,109.86 |
| GTR | Gti Energy Ltd | 0.0035 | -13% | -13% | 17% | -13% | 0% | $ 14,835,762.08 |
| IPT | Impact Minerals | 0.007 | 0% | 40% | -33% | -47% | -26% | $ 27,953,309.78 |
| BNZ | Benzmining | 0.545 | -2% | 21% | 47% | 374% | 58% | $ 110,501,390.72 |
| MOH | Moho Resources | 0.004 | 0% | 0% | -20% | -33% | -20% | $ 2,981,656.11 |
| BCM | Brazilian Critical | 0.011 | -8% | 10% | 10% | -31% | 22% | $ 13,105,332.35 |
| PUA | Peak Minerals Ltd | 0.051 | 19% | 143% | 557% | 1487% | 557% | $ 168,624,634.82 |
| MRZ | Mont Royal Resources | 0.041 | 0% | 0% | 11% | -29% | -5% | $ 3,486,221.51 |
| SMS | Starmineralslimited | 0.025 | -4% | 14% | -26% | -11% | -31% | $ 4,645,166.33 |
| MVL | Marvel Gold Limited | 0.013 | 0% | -13% | 63% | 86% | 44% | $ 18,111,154.14 |
| PRX | Prodigy Gold NL | 0.002 | -33% | 0% | 0% | -10% | 0% | $ 6,350,111.10 |
| AAU | Antilles Gold Ltd | 0.005 | 0% | 11% | 67% | 43% | 67% | $ 11,895,340.08 |
| CWX | Carawine Resources | 0.097 | 1% | 4% | -3% | 10% | -3% | $ 22,904,168.55 |
| RND | Rand Mining Ltd | 1.88 | -4% | -1% | 32% | 26% | 24% | $ 106,073,667.27 |
| CAZ | Cazaly Resources | 0.021 | 5% | 24% | 62% | 5% | 50% | $ 9,687,362.81 |
| BMR | Ballymore Resources | 0.16 | 7% | 10% | 31% | 14% | 33% | $ 27,393,240.68 |
| DRE | Dreadnought Resources Ltd | 0.01 | 11% | -23% | -17% | -57% | -17% | $ 50,795,000.00 |
| ZNC | Zenith Minerals Ltd | 0.033 | -6% | -15% | -8% | -30% | -18% | $ 14,412,955.20 |
| REZ | Resourc & En Grp Ltd | 0.021 | 0% | 62% | -25% | 40% | -9% | $ 14,104,421.56 |
| LEX | Lefroy Exploration | 0.1 | 0% | -5% | 49% | 2% | 43% | $ 26,084,114.49 |
| ERM | Emmerson Resources | 0.13 | 4% | -4% | 67% | 106% | 69% | $ 82,630,454.27 |
| AM7 | Arcadia Minerals | 0.018 | 0% | 0% | -10% | -55% | -5% | $ 2,112,901.79 |
| ADT | Adriatic Metals | 5.79 | 2% | 14% | 51% | 56% | 48% | $ 1,733,286,809.55 |
| AS1 | Asara Resources Ltd | 0.052 | -4% | -12% | 189% | 420% | 174% | $ 52,856,536.70 |
| CYL | Catalyst Metals | 4.89 | -9% | -26% | 63% | 247% | 90% | $ 1,309,270,762.80 |
| CHN | Chalice Mining Ltd | 1.65 | -11% | 17% | 53% | 33% | 49% | $ 655,510,137.78 |
| KAL | Kalgoorliegoldmining | 0.047 | 18% | 2% | 161% | 81% | 161% | $ 16,795,200.36 |
| MLS | Metals Australia | 0.017 | 0% | -6% | -23% | -11% | -26% | $ 12,388,231.91 |
| ADN | Andromeda Metals Ltd | 0.011 | -8% | -15% | 83% | -35% | 57% | $ 45,783,790.36 |
| MEI | Meteoric Resources | 0.1375 | 15% | 6% | 56% | -2% | 62% | $ 292,170,347.75 |
| SRN | Surefire Rescs NL | 0.002 | 0% | 0% | -20% | -66% | -32% | $ 4,972,890.78 |
| WA8 | Warriedarresourltd | 0.105 | -9% | 0% | 123% | 72% | 139% | $ 129,393,960.19 |
| HMX | Hammer Metals Ltd | 0.029 | -9% | -19% | -17% | -24% | -12% | $ 28,408,278.40 |
| WCN | White Cliff Min Ltd | 0.024 | 9% | 9% | 33% | 60% | 50% | $ 55,507,881.36 |
| AVM | Advance Metals Ltd | 0.04 | -18% | -23% | 18% | 54% | 18% | $ 10,601,393.36 |
| ASR | Asra Minerals Ltd | 0.002 | 0% | 0% | -20% | -71% | -33% | $ 8,000,396.02 |
| ARI | Arika Resources | 0.037 | 0% | -10% | 23% | 85% | 37% | $ 28,183,065.77 |
| CTO | Citigold Corp Ltd | 0.004 | 0% | 14% | 0% | 0% | 0% | $ 12,000,000.00 |
| SMI | Santana Minerals Ltd | 0.585 | 6% | -5% | 27% | 48% | 21% | $ 390,268,084.50 |
| M2R | Miramar | 0.004 | 0% | 14% | 0% | -50% | 33% | $ 3,987,293.14 |
| MHC | Manhattan Corp Ltd | 0.02 | -9% | -9% | -20% | -40% | 5% | $ 4,697,977.96 |
| GRL | Godolphin Resources | 0.011 | 22% | 10% | -21% | -35% | -24% | $ 4,488,733.12 |
| SVG | Savannah Goldfields | 0.021 | 0% | 5% | 9% | 4% | 14% | $ 20,548,386.70 |
| EMC | Everest Metals Corp | 0.145 | 4% | -3% | 0% | 12% | 7% | $ 30,257,719.43 |
| GUL | Gullewa Limited | 0.068 | 5% | -8% | 19% | -7% | 21% | $ 14,825,507.70 |
| CY5 | Cygnus Metals Ltd | 0.09 | 3% | -10% | -25% | 109% | -10% | $ 93,567,071.66 |
| G50 | G50Corp Ltd | 0.21 | 5% | 11% | 45% | 31% | 35% | $ 36,134,473.28 |
| ADV | Ardiden Ltd | 0.16 | 7% | 10% | 19% | 16% | 19% | $ 10,315,388.49 |
| AAR | Astral Resources NL | 0.145 | -6% | -17% | 0% | 84% | 7% | $ 212,702,584.35 |
| VMC | Venus Metals Cor Ltd | 0.115 | 10% | -8% | 64% | 55% | 72% | $ 20,593,511.72 |
| NAE | New Age Exploration | 0.0035 | 0% | 0% | -13% | -22% | 0% | $ 8,117,734.22 |
| VKA | Viking Mines Ltd | 0.006 | -14% | 0% | -25% | -25% | -25% | $ 9,407,641.24 |
| LCL | LCL Resources Ltd | 0.006 | -14% | -14% | -33% | -25% | -40% | $ 7,195,542.91 |
| MTH | Mithril Silver Gold | 0.45 | 0% | -13% | 6% | 150% | 13% | $ 64,225,929.68 |
| ADG | Adelong Gold Limited | 0.005 | 0% | 0% | 0% | -9% | 11% | $ 10,343,383.37 |
| RMX | Red Mount Min Ltd | 0.009 | 13% | 0% | 0% | -10% | 0% | $ 5,143,569.65 |
| PRS | Prospech Limited | 0.018 | 13% | -10% | -38% | -50% | -38% | $ 8,712,995.40 |
| TTM | Titan Minerals | 0.315 | 0% | -19% | -20% | -25% | -17% | $ 79,515,240.33 |
| AKA | Aureka Limited | 0.095 | -21% | -27% | -47% | -99% | -30% | $ 13,235,279.51 |
| AAM | Aumegametals | 0.029 | 0% | -15% | -34% | -52% | -31% | $ 18,123,391.26 |
| KZR | Kalamazoo Resources | 0.09 | -2% | 2% | 13% | 11% | 22% | $ 19,087,235.98 |
| BCNDA | Beacon Minerals | 1.05 | -6% | -6% | 14% | 1% | 19% | $ 108,301,383.15 |
| MAU | Magnetic Resources | 1.44 | -4% | -16% | 32% | 21% | 30% | $ 386,412,881.76 |
| BC8 | Black Cat Syndicate | 0.785 | -4% | -2% | 11% | 118% | 39% | $ 548,348,864.55 |
| EM2 | Eagle Mountain | 0.006 | 0% | 0% | -25% | -88% | -33% | $ 5,675,186.45 |
| EMR | Emerald Res NL | 3.58 | -10% | -20% | 5% | -7% | 10% | $ 2,431,212,303.87 |
| BYH | Bryah Resources Ltd | 0.007 | 0% | -53% | 75% | 40% | 133% | $ 5,819,721.13 |
| HCH | Hot Chili Ltd | 0.625 | -2% | 10% | -17% | -36% | -11% | $ 90,205,751.48 |
| WAF | West African Res Ltd | 2.265 | -3% | -1% | 42% | 61% | 58% | $ 2,644,718,380.08 |
| MEU | Marmota Limited | 0.039 | -7% | -5% | -19% | -15% | 0% | $ 46,543,078.71 |
| NVA | Nova Minerals Ltd | 0.295 | -6% | -16% | -21% | 34% | -20% | $ 95,284,238.02 |
| SVL | Silver Mines Limited | 0.1225 | -2% | -6% | 66% | -23% | 57% | $ 221,353,847.04 |
| PGD | Peregrine Gold | 0.19 | 31% | 36% | 19% | -10% | 36% | $ 16,545,309.50 |
| ICL | Iceni Gold | 0.065 | 5% | -30% | -17% | -17% | -8% | $ 21,284,685.99 |
| FG1 | Flynngold | 0.033 | 6% | 0% | 32% | 50% | 32% | $ 12,522,127.04 |
| WWI | West Wits Mining Ltd | 0.0195 | -11% | -33% | 30% | 39% | 39% | $ 64,145,733.31 |
| RML | Resolution Minerals | 0.0465 | -11% | 174% | 323% | 94% | 288% | $ 30,430,423.33 |
| AAJ | Aruma Resources Ltd | 0.008 | 0% | -20% | -20% | -27% | -33% | $ 2,623,524.20 |
| HWK | Hawk Resources. | 0.022 | 16% | 29% | -4% | -38% | 0% | $ 5,147,659.53 |
| GMN | Gold Mountain Ltd | 0.002 | 100% | 33% | -33% | -33% | -33% | $ 11,239,518.49 |
| MEG | Megado Minerals Ltd | 0.034 | 36% | 162% | 127% | 257% | 100% | $ 18,503,839.49 |
| HMG | Hamelingoldlimited | 0.063 | 0% | -24% | 7% | -21% | -2% | $ 12,493,124.97 |
| BM8 | Battery Age Minerals | 0.054 | 2% | -2% | -44% | -63% | -49% | $ 6,582,158.44 |
| TBR | Tribune Res Ltd | 4.71 | 1% | -4% | 11% | 42% | 10% | $ 250,272,727.29 |
| FML | Focus Minerals Ltd | 0.365 | 4% | -3% | 83% | 135% | 115% | $ 101,728,318.98 |
| VRC | Volt Resources Ltd | 0.004 | 0% | -20% | 33% | -11% | 33% | $ 18,739,397.64 |
| ARV | Artemis Resources | 0.0055 | 10% | -8% | -35% | -45% | -31% | $ 12,678,360.83 |
| HRN | Horizon Gold Ltd | 0.5125 | -8% | -13% | 7% | 83% | 7% | $ 76,765,159.19 |
| CLA | Celsius Resource Ltd | 0.007 | 0% | 0% | -26% | -50% | -36% | $ 21,948,419.16 |
| QML | Qmines Limited | 0.047 | 12% | 31% | -2% | -20% | -13% | $ 22,531,295.28 |
| RDN | Raiden Resources Ltd | 0.0045 | 13% | -10% | -70% | -84% | -59% | $ 13,803,565.77 |
| TCG | Turaco Gold Limited | 0.5 | 2% | 3% | 64% | 138% | 96% | $ 504,195,659.80 |
| KCC | Kincora Copper | 0.059 | 51% | 51% | 84% | 37% | 119% | $ 11,758,754.40 |
| GBZ | GBM Rsources Ltd | 0.017 | 13% | 143% | 143% | 70% | 113% | $ 21,237,916.65 |
| DTM | Dart Mining NL | 0.003 | 0% | -14% | -67% | -83% | -67% | $ 3,594,166.73 |
| MKR | Manuka Resources. | 0.048 | 9% | 4% | 85% | 45% | 71% | $ 38,344,112.77 |
| AUC | Ausgold Limited | 0.595 | -13% | -16% | 40% | 75% | 42% | $ 207,319,918.88 |
| ANX | Anax Metals Ltd | 0.008 | 14% | 0% | -20% | -67% | -33% | $ 6,179,652.97 |
| EMU | EMU NL | 0.028 | 47% | 65% | 12% | 12% | 4% | $ 5,281,211.70 |
| SFM | Santa Fe Minerals | 0.2 | 43% | 426% | 525% | 525% | 545% | $ 13,107,382.02 |
| PNR | Pantoro Gold Limited | 2.9 | -8% | -18% | 62% | 71% | 90% | $ 1,190,223,186.99 |
| CMM | Capricorn Metals | 9.23 | -2% | 1% | 37% | 79% | 47% | $ 4,073,710,450.95 |
| VRL | Verity Resources | 0.023 | 15% | -18% | 24% | -41% | 18% | $ 6,426,739.76 |
| HAW | Hawthorn Resources | 0.055 | -4% | 12% | 34% | -8% | 34% | $ 19,095,889.94 |
| BGD | Bartongoldholdings | 0.745 | -10% | -7% | 210% | 217% | 204% | $ 172,972,828.49 |
| SVY | Stavely Minerals Ltd | 0.014 | 27% | 0% | -39% | -52% | -18% | $ 6,528,505.12 |
| AGC | AGC Ltd | 0.16 | 3% | -9% | 14% | -48% | 3% | $ 41,055,555.52 |
| RGL | Riversgold | 0.004 | 0% | 0% | 33% | -27% | 0% | $ 6,734,850.37 |
| TSO | Tesoro Gold Ltd | 0.03 | 3% | 15% | 43% | -9% | 50% | $ 56,411,157.80 |
| GUE | Global Uranium | 0.062 | -10% | -7% | -19% | -27% | 3% | $ 28,649,544.40 |
| CPM | Coopermetalslimited | 0.036 | -5% | 3% | -20% | -45% | -22% | $ 2,820,803.40 |
| MM8 | Medallion Metals. | 0.245 | 2% | -4% | 75% | 362% | 104% | $ 127,161,422.50 |
| FFM | Firefly Metals Ltd | 1.08 | -4% | 9% | 11% | 31% | 17% | $ 736,314,118.36 |
| CBY | Canterbury Resources | 0.024 | -11% | -8% | 4% | -47% | 9% | $ 4,978,581.50 |
| SLA | Solara Minerals | 0.17 | 0% | 10% | 0% | -48% | 89% | $ 9,857,419.91 |
| SFR | Sandfire Resources | 10.96 | -4% | -6% | 12% | 22% | 18% | $ 5,095,697,646.00 |
| TAM | Tanami Gold NL | 0.061 | 2% | 33% | 103% | 97% | 103% | $ 70,505,822.76 |
| NWM | Norwest Minerals | 0.013 | 18% | -13% | -11% | -58% | 8% | $ 12,588,661.31 |
| ALK | Alkane Resources Ltd | 0.665 | -4% | -9% | 27% | 29% | 30% | $ 405,713,067.64 |
| BMO | Bastion Minerals | 0.0015 | 0% | -24% | -52% | -68% | -52% | $ 1,976,727.06 |
| IDA | Indiana Resources | 0.086 | 1% | 13% | 37% | 85% | 41% | $ 55,917,723.85 |
| GSM | Golden State Mining | 0.007 | -22% | -13% | -22% | -30% | -13% | $ 1,955,594.41 |
| NSM | Northstaw | 0.037 | 9% | 17% | 134% | 316% | 134% | $ 11,359,363.90 |
| GSN | Great Southern | 0.026 | -4% | 18% | 53% | 37% | 73% | $ 25,916,911.54 |
| VAU | Vault Minerals Ltd | 0.39 | -4% | -7% | 13% | -5% | 18% | $ 2,686,976,985.89 |
| DEG | De Grey Mining | 0 | -100% | -100% | -100% | -100% | -100% | $ 5,915,063,112.00 |
| THR | Thor Energy PLC | 0.009 | -10% | -10% | -31% | -44% | -31% | $ 6,397,108.52 |
| CDR | Codrus Minerals Ltd | 0.03 | -9% | -21% | 76% | -14% | 76% | $ 6,202,031.37 |
| MDI | Middle Island Res | 0.019 | 0% | -24% | 58% | 27% | 58% | $ 5,571,445.45 |
| WTM | Waratah Minerals Ltd | 0.28 | 0% | -24% | 87% | 2% | 81% | $ 63,048,311.82 |
| POL | Polymetals Resources | 0.725 | -8% | -14% | -17% | 159% | -9% | $ 181,816,484.21 |
| RDS | Redstone Resources | 0.003 | -14% | -25% | 0% | -40% | 20% | $ 3,619,935.74 |
| NAG | Nagambie Resources | 0.015 | -12% | -12% | -21% | 36% | -17% | $ 12,049,535.16 |
| BGL | Bellevue Gold Ltd | 0.92 | -1% | -2% | -14% | -53% | -18% | $ 1,395,128,171.12 |
| GBR | Greatbould Resources | 0.061 | -2% | -2% | 30% | 13% | 42% | $ 57,057,138.18 |
| KAI | Kairos Minerals Ltd | 0.028 | -3% | 0% | 115% | 229% | 133% | $ 73,665,541.29 |
| KAU | Kaiser Reef | 0.175 | -3% | -5% | 6% | 3% | 9% | $ 103,870,576.25 |
| HRZ | Horizon | 0.049 | -4% | 0% | 7% | 29% | 23% | $ 123,302,139.60 |
| CDT | Castle Minerals | 0.07 | -7% | -24% | 17% | -42% | 17% | $ 7,888,650.76 |
| RSG | Resolute Mining | 0.6575 | 0% | 15% | 58% | 10% | 66% | $ 1,394,527,758.52 |
| EVN | Evolution Mining Ltd | 7.445 | -6% | -13% | 44% | 100% | 55% | $ 15,117,957,795.80 |
| CXU | Cauldron Energy Ltd | 0.009 | 0% | 29% | -29% | -59% | -23% | $ 15,224,868.56 |
| DLI | Delta Lithium | 0.1825 | 11% | 1% | -4% | -27% | 7% | $ 121,812,104.64 |
| ALY | Alchemy Resource Ltd | 0.005 | -17% | 0% | -17% | -17% | -29% | $ 5,890,381.28 |
| NH3 | Nh3Cleanenergyltd | 0.05 | 47% | 61% | 150% | 213% | 178% | $ 31,821,109.90 |
| OBM | Ora Banda Mining Ltd | 0.66 | -10% | -37% | -12% | 86% | 2% | $ 1,365,768,352.33 |
| AVW | Avira Resources Ltd | 0.007 | 0% | 0% | -65% | -65% | -65% | $ 1,610,000.00 |
| LCY | Legacy Iron Ore | 0.008 | -11% | -11% | -11% | -45% | -20% | $ 97,620,425.84 |
| PDI | Predictive Disc Ltd | 0.43 | 9% | 6% | 76% | 126% | 87% | $ 1,127,459,649.98 |
| MAT | Matsa Resources | 0.065 | -6% | -10% | 55% | 150% | 86% | $ 47,208,393.73 |
| ZAG | Zuleika Gold Ltd | 0.014 | -7% | 17% | 17% | -7% | 8% | $ 10,386,318.98 |
| GML | Gateway Mining | 0.027 | 4% | -13% | 23% | 13% | 29% | $ 10,629,327.67 |
| SBM | St Barbara Limited | 0.2825 | -4% | -17% | 1% | 26% | 26% | $ 303,196,975.48 |
| SBR | Sabre Resources | 0.008 | -11% | -11% | -11% | -47% | -20% | $ 3,944,619.33 |
| STK | Strickland Metals | 0.15 | 3% | 7% | 90% | 65% | 76% | $ 339,353,969.55 |
| CEL | Challenger Gold Ltd | 0.08 | -9% | -10% | 60% | 54% | 70% | $ 155,006,939.18 |
| GG8 | Gorilla Gold Mines | 0.35 | -10% | -35% | 37% | 895% | 35% | $ 237,005,712.97 |
| NST | Northern Star | 16.185 | -13% | -23% | -2% | 24% | 5% | $ 23,742,477,715.38 |
| OZM | Ozaurum Resources | 0.08 | 29% | 7% | 196% | 51% | 167% | $ 15,120,723.62 |
| TG1 | Techgen Metals Ltd | 0.027 | 0% | -4% | -21% | -18% | -23% | $ 4,283,974.17 |
| XAM | Xanadu Mines Ltd | 0.08 | 0% | 1% | 67% | 38% | 63% | $ 183,296,895.12 |
| AQI | Alicanto Min Ltd | 0.026 | -4% | -19% | -30% | 37% | -30% | $ 22,051,717.38 |
| KTA | Krakatoa Resources | 0.011 | -8% | -8% | 22% | -21% | 16% | $ 7,560,864.06 |
| ARN | Aldoro Resources | 0.355 | 0% | 18% | 18% | 386% | -7% | $ 66,860,389.39 |
| WGX | Westgold Resources. | 2.765 | -3% | -13% | 5% | 9% | -2% | $ 2,612,413,841.30 |
| MBK | Metal Bank Ltd | 0.011 | -8% | -8% | -27% | -52% | -27% | $ 4,974,589.98 |
| A8G | Australasian Metals | 0.067 | 0% | -3% | -14% | -3% | -15% | $ 3,878,611.58 |
| TAR | Taruga Minerals | 0.008 | 0% | 0% | -20% | 14% | -20% | $ 5,710,032.46 |
| DTR | Dateline Resources | 0.096 | 7% | -4% | 3100% | 1500% | 2643% | $ 280,492,207.23 |
| GOR | Gold Road Res Ltd | 3.185 | -3% | -5% | 47% | 81% | 55% | $ 3,487,340,982.60 |
| S2R | S2 Resources | 0.069 | 3% | -7% | -10% | -31% | 3% | $ 33,996,005.75 |
| NES | Nelson Resources. | 0.003 | 0% | 0% | 0% | 20% | 0% | $ 6,515,782.98 |
| TLM | Talisman Mining | 0.145 | -3% | 7% | -29% | -45% | -29% | $ 28,248,052.35 |
| BEZ | Besragoldinc | 0.05 | -6% | 32% | -42% | -49% | -44% | $ 20,774,848.25 |
| PRU | Perseus Mining Ltd | 3.55 | 1% | -8% | 34% | 41% | 38% | $ 4,828,315,375.84 |
| SPQ | Superior Resources | 0.004 | -11% | 0% | -33% | -63% | -33% | $ 9,483,930.90 |
| PUR | Pursuit Minerals | 0.071 | 8% | 61% | -24% | -53% | -26% | $ 7,380,313.26 |
| RMS | Ramelius Resources | 2.365 | -3% | -15% | 8% | 23% | 14% | $ 2,781,914,774.40 |
| PKO | Peako Limited | 0.0025 | -17% | 25% | -17% | 8% | -17% | $ 3,719,354.90 |
| ICG | Inca Minerals Ltd | 0.01 | 11% | 100% | 43% | 67% | 100% | $ 14,713,750.26 |
| A1G | African Gold Ltd. | 0.215 | 8% | 34% | 264% | 835% | 291% | $ 110,644,374.12 |
| NMG | New Murchison Gold | 0.017 | 0% | 0% | 70% | 240% | 89% | $ 165,143,013.47 |
| GNM | Great Northern | 0.014 | 0% | -7% | 17% | 17% | 0% | $ 2,164,807.08 |
| KRM | Kingsrose Mining Ltd | 0.032 | 7% | 8% | -9% | -32% | -9% | $ 24,112,848.61 |
| BTR | Brightstar Resources | 0.455 | -3% | -17% | -9% | 7% | -9% | $ 222,111,411.84 |
| RRL | Regis Resources | 4.42 | -2% | -8% | 60% | 139% | 73% | $ 3,378,441,662.88 |
| M24 | Mamba Exploration | 0.014 | 8% | 17% | 8% | 8% | 17% | $ 3,837,152.93 |
| TRM | Truscott Mining Corp | 0.049 | 0% | -11% | -37% | -18% | -37% | $ 9,380,979.44 |
| TNC | True North Copper | 0.38 | -3% | 21% | -87% | -93% | -87% | $ 47,131,631.56 |
| MOM | Moab Minerals Ltd | 0.0015 | 50% | 50% | -50% | -75% | -25% | $ 2,600,499.05 |
| KNB | Koonenberrygold | 0.051 | 11% | 19% | 240% | 292% | 325% | $ 45,103,135.75 |
| AWJ | Auric Mining | 0.175 | 3% | 3% | -46% | -27% | -49% | $ 32,546,692.85 |
| ENR | Encounter Resources | 0.285 | 12% | 27% | -7% | -66% | -12% | $ 147,143,734.11 |
| SNG | Siren Gold | 0.051 | 6% | -9% | -4% | -30% | -22% | $ 10,510,589.23 |
| STN | Saturn Metals | 0.42 | 1% | 17% | 133% | 127% | 105% | $ 181,565,787.69 |
| USL | Unico Silver Limited | 0.33 | 12% | 18% | 65% | 83% | 69% | $ 137,952,282.83 |
| PNM | Pacific Nickel Mines | 0.024 | 0% | 0% | 0% | 14% | 0% | $ 10,103,834.52 |
| AYM | Australia United Min | 0.002 | 0% | 0% | 0% | -33% | -50% | $ 3,685,154.97 |
| HAV | Havilah Resources | 0.185 | 0% | 0% | -12% | -14% | -18% | $ 62,762,414.76 |
| SPR | Spartan Resources | 1.885 | -2% | -14% | 19% | 94% | 34% | $ 2,453,499,988.22 |
| PNT | Panthermetalsltd | 0.01 | -38% | -33% | 11% | -54% | -9% | $ 3,009,045.48 |
| MEK | Meeka Metals Limited | 0.1325 | -12% | -15% | 33% | 279% | 72% | $ 408,198,723.80 |
| GMD | Genesis Minerals | 4.02 | -6% | -11% | 48% | 114% | 63% | $ 4,657,033,348.00 |
| PGO | Pacgold | 0.062 | 0% | -9% | -17% | -57% | -17% | $ 9,570,724.74 |
| FEG | Far East Gold | 0.165 | -8% | 3% | 0% | 32% | -8% | $ 64,229,804.28 |
| MI6 | Minerals260Limited | 0.11 | -8% | -21% | -15% | -33% | -15% | $ 237,743,333.30 |
| IGO | IGO Limited | 4.59 | 6% | 8% | -7% | -20% | -4% | $ 3,422,850,514.76 |
| GAL | Galileo Mining Ltd | 0.15 | 11% | 7% | -6% | -23% | 20% | $ 29,643,739.05 |
| RXL | Rox Resources | 0.2975 | -1% | 6% | 27% | 113% | 49% | $ 223,919,417.70 |
| PTN | Patronus Resources | 0.064 | -1% | 16% | 14% | 8% | 31% | $ 103,156,061.65 |
| CLZ | Classic Min Ltd | 0.001 | 0% | 0% | 0% | 0% | 0% | $ 3,017,699.21 |
| TGM | Theta Gold Mines Ltd | 0.17 | 10% | 31% | 6% | -3% | -6% | $ 149,021,621.60 |
| FAL | Falconmetalsltd | 0.375 | 114% | 188% | 188% | 44% | 226% | $ 33,630,000.00 |
| SPD | Southernpalladium | 0.64 | -2% | 28% | 13% | 78% | 7% | $ 68,448,000.00 |
| ORN | Orion Minerals Ltd | 0.011 | -8% | 0% | -21% | -35% | -27% | $ 68,504,478.18 |
| TMB | Tambourahmetals | 0.021 | -5% | -9% | -22% | -52% | 0% | $ 3,235,981.01 |
| TMS | Tennant Minerals Ltd | 0.0065 | 8% | 8% | -41% | -69% | -28% | $ 7,461,232.91 |
| AZY | Antipa Minerals Ltd | 0.56 | -18% | -26% | 87% | 409% | 115% | $ 325,037,662.32 |
| PXX | Polarx Limited | 0.009 | 13% | 13% | 50% | -31% | 38% | $ 19,004,007.82 |
| TRE | Toubani Res Ltd | 0.29 | 4% | 0% | 100% | 66% | 71% | $ 74,618,436.37 |
| AUN | Aurumin | 0.089 | -3% | 3% | 44% | 162% | 35% | $ 44,663,412.96 |
| GPR | Geopacific Resources | 0.029 | 12% | 21% | 45% | 30% | 45% | $ 82,744,098.48 |
| FXG | Felix Gold Limited | 0.14 | 4% | -10% | 27% | 211% | 67% | $ 57,054,765.43 |
| ILT | Iltani Resources Lim | 0.185 | -21% | -18% | 0% | -20% | -10% | $ 12,199,048.37 |
| BRX | Belararoxlimited | 0.064 | 2% | 8% | -59% | -78% | -63% | $ 10,367,934.53 |
| TM1 | Terra Metals Limited | 0.048 | 4% | 14% | 50% | -45% | 71% | $ 22,461,157.40 |
| TOR | Torque Met | 0.15 | 0% | 15% | 194% | 7% | 183% | $ 78,986,572.05 |
| ARD | Argent Minerals | 0.022 | 0% | -19% | 16% | 29% | 29% | $ 30,368,950.08 |
| LM1 | Leeuwin Metals Ltd | 0.13 | -4% | -4% | 8% | 155% | -7% | $ 13,608,861.84 |
| SX2 | Southgold Consol | 5.91 | -17% | -16% | 0% | 0% | 0% | $ 844,553,682.63 |
| UVA | Uvrelimited | 0.12 | 0% | 29% | 41% | 20% | 35% | $ 13,224,000.12 |
| VTX | Vertexmin | 0.24 | -8% | -20% | 9% | 189% | 16% | $ 47,403,466.10 |
The market absolutely adores a Victorian gold story, bonanza grades and visible gold.
That’s the trifecta hit in the first wedge hole at Blue Moon, a prospect that has been interpreted as the down plunge extension of the Garden Gully Anticline, a trend that has historically produced 5.2Moz at 15g/t Au over 8km of strike.
The ground surrounds the Bendigo mining permit, which remains in moratorium but has historically produced some 22Moz.
That hit came in at 1.2m at 543g’t from 544.2m, including 0.6m at 557g/t from 544.2m and 0.6m at 529g/t from 544.8m.
The high grade strike was 5m up-dip from target T552, which was a bedding parallel quartz vein identified in the parent hole, Falcon said.
The wedge hole remains in progress, planning to hit a depth of 670m and Falcon is now planning additional wedge holes to target zones closer to the fold hinge, the area where wider mineralisation is typically found around Bendigo.
Let’s get real though, this is what you want to see.
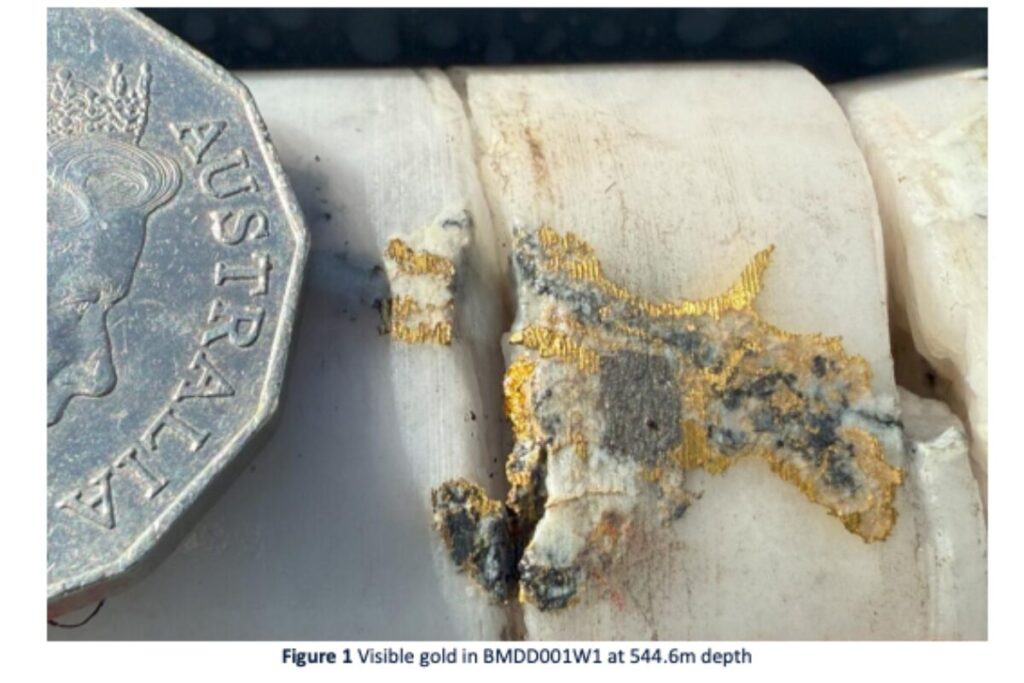
“This outstanding result from the first wedge hole at Blue Moon is highly encouraging and it is exciting to see the abundance of visible gold present,” Falcon MD Tim Markwell said.
“The early success from the first phase of drilling shows the untapped potential of the Bendigo Goldfield as it continues northwards through Falcon’s ground and we look forward to seeing the results as we get closer to the fold hinge where Bendigo-style saddle reefs could occur.”
Falcon Metals has decent backing behind it. The explorer is a spinout of Tim Goyder’s Gonneville nickel-copper-PGE discoverer Chalice Mining (ASX:CHN), which counts former Sirius Resources head honcho and S2 Resources (ASX:S2R) boss Mark Bennett as its chair.
The explorer that does what it says on the tin, Yandal has a bunch of ground in the Yandal gold belt of WA, near major mining operations like Northern Star’s Jundee and Bronzewing.
Having caught the eye last year with results from its Siona discovery, aircore drilling at the Arrakis prospect on the Caladan Fold has investors dreaming of another discovery.
YRL hit 11m at 2.1g/t from 90m in hole 25IWBAC023, 12m at 1.1g/t from 45m in 25IWBAC032 and 12m at 0.5g/t from 70m to end of hole in 25IWBAC032.
Those shallow strikes show mineralisation over 800m of strike, which remains open to the southeast and northwest.
The 125-hole, 12,500m program is expected to be completed in the next fortnight.
“To intercept mineralisation of this tenure within a first pass aircore drilling across three consecutive 400m spaced lines is a significant early-stage success, which should not be understated. We are also observing very similar geology associated with mineralisation across all three lines, suggesting we may be dealing with a single continuous mineralised structure,” YRL MD Chris Oorschot said.
“The current aircore program is testing the full length of the Arrakis Prospect; there is ample opportunity for further positive results ahead of us as the company continues its pursuit of a large-scale gold discovery within the Yandal Greenstone Belt.”
The views, information, or opinions expressed in the commentary in this article are solely those of the fund managers and do not represent the views of Stockhead. Stockhead does not provide, endorse or otherwise assume responsibility for any financial product advice contained in this article.
Related Topics

Related Stories


UNLOCK INSIGHTS
Discover the untold stories of emerging ASX stocks.
Daily news and expert analysis, it's free to subscribe.
By proceeding, you confirm you understand that we handle personal information in accordance with our Privacy Policy.


