Pic: Via Getty
Gold Digger: Every cloud has a silver lining
Mining
Pic: Via Getty
Mining
Our Gold Digger column wraps all the news driving ASX stocks with exposure to precious metals.
Gold is on the rise, with little brother silver in tow. Unlike gold, however, silver plays a dual role – it is both an investment vehicle (like gold) and an important industrial metal.
Despite a challenging economic backdrop, global silver industrial demand is expected to achieve a new all-time high in 2023, according to Metals Focus.
This, coupled with a slight dip in total supply, will see the silver market post another sizeable deficit in 2023.
Overall demand is expected to fall by 10% year on year to 1.14 billion ounces in 2023 – thanks to weaker investment demand — but this drop must be set against 2022’s record high total, Metals Focus says.
“Even with a 10% drop, the total for 2023 is still the second highest in Metals Focus’ data series,” it says.
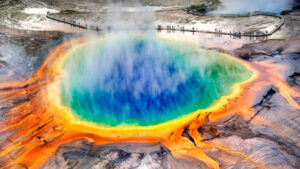
A big reason for this silver boom is a surge in photovoltaic (PV) developments, where it plays a crucial role.
“Global PV installations are expected to near 400GW in 2023 for the first time ever, as the ramp-up in China accelerates,” Metals Focus says.
“Moreover, the increase in PV cell production has been much faster than silver thrifting this year, and this in turn will drive the 11% rise for global electronics & electrical demand.
Silver will also benefit from rising investment in 5G networks and growing electrification of vehicles. Silver demand as an ethylene oxide (EO) catalyst will also achieve solid gains, fuelled by capacity expansions.
EO is used to produce ethylene glycol (EG), a key ingredient in polyester fibres, antifreeze, PET bottles and various other products.
Overall, the global silver market is expected to remain in a sizeable 140Moz deficit this year; down 43% on 2022’s all-time high, but still elevated by historical standards.
Going forward, Metals Focus expect these deficit conditions to persist for the foreseeable future but, as was the case in 2022, “institutional investors during 2023-to-date have shown little interest in this supportive supply/demand backdrop”.
“Instead, investors have remained sensitive to economic developments,” it says.
“Going forward, Metals Focus cautions that the economic backdrop will remain challenging both for now and also for much of 2024, as the pace of interest rate cuts by the Fed will turn out to be much slower than current market consensus.
“The white metal’s investment appeal will also be hurt by poor confidence in industrial commodities in the wake of a slowing Chinese economy.”
Take that forecast (all forecasts, actually) with a pinch of salt.
Metals Focus has been correct in predicting slower-than-expected interest rate pause/cuts, but wrong in that it also expected this to weaken precious metals prices in the second half “a trend we believe will continue into 2024”, it said in March.
Silver is currently paying US$23.69/oz, a solid 10% gain over the past 12 months. At US$1992.50/oz, gold is up 13% over the same period.
TURACO GOLD (ASX:TCG) +43% — project acquisition
PNX METALS (ASX:PNX) +33% — no news
PEAK MINERALS (ASX:PUA) +33% — no news
MATADOR MINING (ASX:MZZ) +33% — no news
ASRA MINERALS (ASX:ASR) -39% – capital raise
AUSTRALIA UNITED MINING (ASX:AYM) -33% — no news
GOLDEN RIM (ASX:GMR) -33% — capital raise
ORA GOLD (ASX:OAU) -29% — drill results
Here’s how ASX-listed precious metals stocks are performing:
Scroll or swipe to reveal table. Click headings to sort. Best viewed on a laptop.
Stocks missing from this list? Email [email protected]
| CODE | COMPANY | 1 WEEK RETURN% | 1 MONTH RETURN% | 6 MONTH RETURN% | YEAR TO DATE RETURN% | PRICE | MARKET CAP |
|---|---|---|---|---|---|---|---|
| TG1 | Techgen Metals Ltd | 67% | 267% | 49% | 34% | 0.11 | $6,404,967 |
| CXU | Cauldron Energy Ltd | 58% | 138% | 221% | 175% | 0.019 | $20,378,942 |
| PRS | Prospech Limited | 52% | 52% | -14% | 42% | 0.038 | $7,911,359 |
| TCG | Turaco Gold Limited | 43% | 104% | 79% | 72% | 0.1 | $48,260,800 |
| MRR | Minrex Resources Ltd | 38% | 38% | 57% | -31% | 0.022 | $23,867,085 |
| RGL | Riversgold | 36% | 50% | -17% | -50% | 0.015 | $10,463,876 |
| PNX | PNX Metals Limited | 33% | 33% | 33% | -5% | 0.004 | $21,522,499 |
| MOH | Moho Resources | 33% | 71% | -37% | -43% | 0.012 | $6,120,800 |
| PUA | Peak Minerals Ltd | 33% | 14% | 0% | -33% | 0.004 | $3,124,130 |
| AVM | Advance Metals Ltd | 33% | 33% | -43% | -60% | 0.004 | $2,167,040 |
| MZZ | Matador Mining Ltd | 33% | 18% | -21% | -54% | 0.053 | $20,502,005 |
| YRL | Yandal Resources | 31% | 42% | 31% | -6% | 0.092 | $16,911,517 |
| KTA | Krakatoa Resources | 28% | 178% | 108% | 14% | 0.05 | $22,179,794 |
| FG1 | Flynngold | 26% | 21% | 19% | -18% | 0.082 | $11,319,755 |
| STK | Strickland Metals | 26% | 77% | 388% | 388% | 0.195 | $309,462,523 |
| CTO | Citigold Corp Ltd | 25% | 25% | 0% | -17% | 0.005 | $14,368,295 |
| CBY | Canterbury Resources | 25% | 11% | -14% | -27% | 0.03 | $4,335,706 |
| NES | Nelson Resources. | 25% | 25% | 0% | -29% | 0.005 | $3,067,972 |
| AUN | Aurumin | 24% | -7% | 0% | -57% | 0.026 | $6,687,305 |
| M24 | Mamba Exploration | 23% | 9% | -64% | -74% | 0.038 | $2,195,400 |
| TSO | Tesoro Gold Ltd | 21% | 37% | -45% | -43% | 0.0205 | $21,868,817 |
| GMN | Gold Mountain Ltd | 20% | 9% | 50% | -14% | 0.006 | $13,614,472 |
| GIB | Gibb River Diamonds | 18% | 3% | -13% | -35% | 0.039 | $6,979,812 |
| BM8 | Battery Age Minerals | 18% | 10% | -39% | -54% | 0.23 | $20,055,800 |
| MBK | Metal Bank Ltd | 18% | -6% | 5% | -2% | 0.033 | $11,857,022 |
| AAU | Antilles Gold Ltd | 17% | 27% | -13% | -7% | 0.028 | $22,201,397 |
| ADG | Adelong Gold Limited | 17% | 17% | -30% | 0% | 0.007 | $4,174,256 |
| GSR | Greenstone Resources | 17% | -13% | -65% | -78% | 0.007 | $9,576,794 |
| OBM | Ora Banda Mining Ltd | 17% | 83% | 45% | 150% | 0.21 | $341,088,974 |
| LRL | Labyrinth Resources | 17% | 0% | -40% | -57% | 0.007 | $8,312,806 |
| FXG | Felix Gold Limited | 16% | -23% | -41% | -58% | 0.05 | $6,172,733 |
| PGD | Peregrine Gold | 16% | 14% | 7% | -16% | 0.325 | $16,975,980 |
| TMB | Tambourahmetals | 16% | 16% | 65% | 38% | 0.145 | $10,782,246 |
| G50 | Gold50Limited | 15% | 20% | 0% | -40% | 0.15 | $14,754,150 |
| GMD | Genesis Minerals | 14% | 13% | 43% | 36% | 1.7 | $1,787,214,357 |
| BGL | Bellevue Gold Ltd | 14% | 7% | 28% | 41% | 1.595 | $1,809,683,766 |
| AZY | Antipa Minerals Ltd | 13% | 31% | 6% | -19% | 0.017 | $70,291,735 |
| TRE | Toubaniresourcesinc | 12% | 33% | -13% | -13% | 0.14 | $18,071,865 |
| SXG | Southern Cross Gold | 12% | 19% | 93% | 19% | 0.95 | $78,798,670 |
| MXR | Maximus Resources | 11% | 35% | 28% | 25% | 0.05 | $15,709,683 |
| HXG | Hexagon Energy | 11% | 25% | -23% | -41% | 0.01 | $4,616,243 |
| KIN | KIN Min NL | 11% | 20% | 67% | -8% | 0.06 | $70,689,033 |
| KCN | Kingsgate Consolid. | 10% | 10% | -5% | -29% | 1.225 | $318,323,340 |
| TMS | Tennant Minerals Ltd | 9% | 35% | 9% | 13% | 0.035 | $25,820,736 |
| SPR | Spartan Resources | 9% | 4% | 270% | 154% | 0.425 | $399,742,172 |
| BGD | Bartongoldholdings | 9% | 4% | -6% | 25% | 0.25 | $48,878,449 |
| DEG | De Grey Mining | 9% | 2% | -5% | 0% | 1.2875 | $2,415,831,807 |
| GRL | Godolphin Resources | 9% | 0% | -37% | -54% | 0.038 | $6,092,713 |
| PGO | Pacgold | 8% | -15% | -33% | -44% | 0.2 | $16,829,088 |
| TGM | Theta Gold Mines Ltd | 8% | 0% | 96% | 99% | 0.135 | $95,320,126 |
| MEU | Marmota Limited | 8% | 45% | 20% | -13% | 0.042 | $44,469,624 |
| NAE | New Age Exploration | 7% | 25% | 50% | 7% | 0.0075 | $14,351,191 |
| THR | Thor Energy PLC | 7% | 25% | -40% | -50% | 0.03 | $5,594,769 |
| CPM | Coopermetalslimited | 7% | 84% | -21% | -2% | 0.23 | $13,382,815 |
| PDI | Predictive Disc Ltd | 7% | 0% | 47% | 31% | 0.235 | $475,696,140 |
| ORN | Orion Minerals Ltd | 7% | -6% | -20% | 0% | 0.016 | $93,120,555 |
| GTR | Gti Energy Ltd | 6% | 6% | 6% | -21% | 0.0085 | $16,399,577 |
| CAZ | Cazaly Resources | 6% | 13% | 36% | 0% | 0.034 | $13,430,102 |
| ZAG | Zuleika Gold Ltd | 6% | 21% | 0% | -19% | 0.017 | $8,891,861 |
| TAM | Tanami Gold NL | 6% | -5% | 9% | -10% | 0.035 | $41,128,397 |
| AUT | Auteco Minerals | 6% | 24% | 3% | -29% | 0.036 | $200,221,452 |
| CAI | Calidus Resources | 6% | 20% | -5% | -33% | 0.18 | $106,791,476 |
| CYL | Catalyst Metals | 6% | 28% | 6% | -29% | 0.835 | $180,529,186 |
| MLS | Metals Australia | 6% | 6% | -3% | -15% | 0.038 | $23,713,375 |
| PNR | Pantoro Limited | 5% | 13% | -31% | -49% | 0.0485 | $254,997,495 |
| ENR | Encounter Resources | 5% | 76% | 39% | 119% | 0.395 | $150,844,043 |
| AQI | Alicanto Min Ltd | 5% | 2% | 16% | 2% | 0.044 | $28,305,493 |
| KZR | Kalamazoo Resources | 4% | 34% | -11% | -40% | 0.125 | $21,421,184 |
| NWM | Norwest Minerals | 3% | -3% | 3% | -43% | 0.031 | $8,914,655 |
| POL | Polymetals Resources | 3% | 9% | -14% | 27% | 0.31 | $47,172,149 |
| KAU | Kaiser Reef | 3% | -11% | -24% | -3% | 0.16 | $24,399,742 |
| SVL | Silver Mines Limited | 3% | -3% | -20% | -18% | 0.165 | $231,714,804 |
| AGC | AGC Ltd | 3% | 3% | 12% | 12% | 0.067 | $6,300,000 |
| SFR | Sandfire Resources | 3% | 9% | 9% | 15% | 6.27 | $2,810,503,285 |
| HRZ | Horizon | 3% | 0% | -20% | -43% | 0.035 | $23,132,461 |
| TLM | Talisman Mining | 3% | 29% | -10% | 29% | 0.18 | $33,897,663 |
| RSG | Resolute Mining | 3% | 1% | -18% | 88% | 0.375 | $777,103,255 |
| EVN | Evolution Mining Ltd | 2% | 2% | 0% | 24% | 3.685 | $6,889,439,505 |
| HAW | Hawthorn Resources | 2% | 4% | 36% | -17% | 0.095 | $31,156,452 |
| SMI | Santana Minerals Ltd | 2% | 41% | 16% | 14% | 0.745 | $133,373,631 |
| CMM | Capricorn Metals | 2% | -4% | 7% | -2% | 4.52 | $1,718,128,860 |
| NST | Northern Star | 2% | -5% | -12% | 6% | 11.545 | $13,376,933,790 |
| WAF | West African Res Ltd | 2% | 10% | -5% | -31% | 0.815 | $846,543,289 |
| CST | Castile Resources | 2% | 18% | -42% | -39% | 0.058 | $14,030,341 |
| IDA | Indiana Resources | 2% | 14% | 16% | 5% | 0.058 | $35,521,350 |
| ERM | Emmerson Resources | 2% | -8% | -16% | -21% | 0.059 | $32,137,877 |
| TIE | Tietto Minerals | 2% | 46% | 18% | -15% | 0.6 | $672,165,818 |
| ICL | Iceni Gold | 2% | -8% | -13% | -25% | 0.06 | $14,871,143 |
| ADT | Adriatic Metals | 2% | -4% | 1% | 2% | 3.2 | $767,839,786 |
| ALK | Alkane Resources Ltd | 2% | 1% | -17% | 20% | 0.64 | $388,952,100 |
| MAU | Magnetic Resources | 1% | -4% | 86% | 19% | 1.025 | $248,978,827 |
| QML | Qmines Limited | 1% | -18% | -42% | -56% | 0.073 | $15,186,676 |
| SBM | St Barbara Limited | 1% | -9% | -26% | -44% | 0.1875 | $151,324,520 |
| HMG | Hamelingoldlimited | 1% | 2% | -32% | -41% | 0.085 | $13,387,500 |
| RRL | Regis Resources | 1% | 7% | -13% | -14% | 1.7675 | $1,340,726,384 |
| GOR | Gold Road Res Ltd | 0% | -3% | -3% | 6% | 1.7975 | $1,970,311,460 |
| NPM | Newpeak Metals | 0% | 0% | 0% | 0% | 0.001 | $9,995,579 |
| FFX | Firefinch Ltd | 0% | 0% | 0% | 0% | 0.2 | $236,569,315 |
| DCX | Discovex Res Ltd | 0% | 0% | -20% | -33% | 0.002 | $6,605,136 |
| AQX | Alice Queen Ltd | 0% | -42% | -59% | -80% | 0.007 | $1,018,444 |
| SLZ | Sultan Resources Ltd | 0% | -27% | -70% | -81% | 0.016 | $2,371,041 |
| AMI | Aurelia Metals Ltd | 0% | 17% | 5% | -8% | 0.11 | $177,425,577 |
| TMX | Terrain Minerals | 0% | -20% | -43% | -33% | 0.004 | $5,413,711 |
| NXM | Nexus Minerals Ltd | 0% | 0% | -52% | -80% | 0.04 | $15,562,405 |
| FAU | First Au Ltd | 0% | -33% | -43% | -50% | 0.002 | $2,903,987 |
| BBX | BBX Minerals Ltd | 0% | 8% | -59% | -75% | 0.026 | $17,016,800 |
| PRX | Prodigy Gold NL | 0% | -11% | -11% | -33% | 0.008 | $15,759,970 |
| CWX | Carawine Resources | 0% | -3% | 7% | 7% | 0.105 | $24,793,172 |
| SIH | Sihayo Gold Limited | 0% | 33% | 0% | 0% | 0.002 | $24,408,512 |
| HMX | Hammer Metals Ltd | 0% | 16% | -24% | -26% | 0.05 | $44,320,367 |
| WRM | White Rock Min Ltd | 0% | 0% | 0% | -5% | 0.063 | $17,508,200 |
| MCT | Metalicity Limited | 0% | -20% | 0% | -33% | 0.002 | $8,502,172 |
| MHC | Manhattan Corp Ltd | 0% | -33% | -20% | -27% | 0.004 | $11,747,919 |
| GUL | Gullewa Limited | 0% | 0% | 0% | -8% | 0.055 | $10,767,521 |
| VMC | Venus Metals Cor Ltd | 0% | 0% | -7% | 27% | 0.1 | $18,972,868 |
| MTH | Mithril Resources | 0% | 33% | -20% | -43% | 0.002 | $6,737,609 |
| XTC | Xantippe Res Ltd | 0% | 0% | -63% | -67% | 0.001 | $17,528,005 |
| TTM | Titan Minerals | 0% | -16% | -38% | -52% | 0.032 | $47,273,551 |
| NML | Navarre Minerals Ltd | 0% | 0% | -10% | -54% | 0.019 | $28,555,654 |
| BCN | Beacon Minerals | 0% | 0% | -13% | -4% | 0.027 | $105,189,509 |
| DCN | Dacian Gold Ltd | 0% | -3% | 235% | 185% | 0.285 | $346,788,267 |
| WWI | West Wits Mining Ltd | 0% | -14% | -20% | -25% | 0.012 | $29,164,700 |
| RML | Resolution Minerals | 0% | -20% | 0% | -50% | 0.004 | $5,657,813 |
| TBA | Tombola Gold Ltd | 0% | 0% | 0% | 0% | 0.026 | $33,129,243 |
| VRC | Volt Resources Ltd | 0% | -13% | -30% | -53% | 0.007 | $24,780,640 |
| HRN | Horizon Gold Ltd | 0% | -3% | -22% | -6% | 0.29 | $42,003,578 |
| CLA | Celsius Resource Ltd | 0% | 0% | -56% | -31% | 0.011 | $26,952,620 |
| AUC | Ausgold Limited | 0% | 0% | -40% | -38% | 0.029 | $66,588,095 |
| EMU | EMU NL | 0% | -33% | -50% | -80% | 0.001 | $1,667,521 |
| SFM | Santa Fe Minerals | 0% | 0% | -28% | -46% | 0.043 | $3,131,208 |
| X64 | Ten Sixty Four Ltd | 0% | 0% | 0% | -11% | 0.57 | $130,184,182 |
| SI6 | SI6 Metals Limited | 0% | 20% | -14% | 0% | 0.006 | $11,963,157 |
| OKR | Okapi Resources | 0% | -8% | -15% | -27% | 0.11 | $23,136,962 |
| TMZ | Thomson Res Ltd | 0% | 0% | 0% | -74% | 0.005 | $4,881,018 |
| WMC | Wiluna Mining Corp | 0% | 0% | 0% | 0% | 0.205 | $74,238,031 |
| NSM | Northstaw | 0% | 173% | -39% | -47% | 0.082 | $9,850,414 |
| RED | Red 5 Limited | 0% | 10% | 113% | 61% | 0.33 | $1,125,211,506 |
| CDR | Codrus Minerals Ltd | 0% | 10% | -54% | -49% | 0.066 | $5,787,375 |
| MDI | Middle Island Res | 0% | -11% | -59% | -55% | 0.016 | $2,391,190 |
| RDS | Redstone Resources | 0% | 0% | -13% | -13% | 0.007 | $5,228,271 |
| ALY | Alchemy Resource Ltd | 0% | -9% | -41% | -57% | 0.01 | $11,780,763 |
| SLR | Silver Lake Resource | 0% | 5% | -3% | -14% | 1.025 | $962,786,663 |
| LCY | Legacy Iron Ore | 0% | 0% | 21% | -11% | 0.017 | $108,916,045 |
| TAR | Taruga Minerals | 0% | 0% | -29% | -58% | 0.01 | $7,060,268 |
| GNM | Great Northern | 0% | -5% | -47% | -67% | 0.02 | $3,092,582 |
| BTR | Brightstar Resources | 0% | 18% | -13% | -24% | 0.013 | $24,905,834 |
| MOM | Moab Minerals Ltd | 0% | -14% | -29% | -33% | 0.006 | $4,271,781 |
| KNB | Koonenberrygold | 0% | -12% | -14% | -42% | 0.036 | $4,310,967 |
| ANL | Amani Gold Ltd | 0% | 0% | 0% | 0% | 0.001 | $25,143,441 |
| HAV | Havilah Resources | 0% | 8% | 4% | -21% | 0.26 | $82,326,195 |
| MEK | Meeka Metals Limited | 0% | -16% | 6% | -47% | 0.036 | $42,694,522 |
| FEG | Far East Gold | 0% | -3% | -49% | -67% | 0.16 | $28,896,994 |
| CLZ | Classic Min Ltd | 0% | 0% | 0% | -89% | 0.001 | $12,357,082 |
| PXX | Polarx Limited | 0% | -11% | -43% | -60% | 0.008 | $10,917,317 |
| PRU | Perseus Mining Ltd | 0% | 3% | -11% | -18% | 1.7275 | $2,417,472,563 |
| RMS | Ramelius Resources | 0% | -12% | 11% | 64% | 1.5275 | $1,743,988,132 |
| AZS | Azure Minerals | 0% | 64% | 716% | 1678% | 4 | $1,830,131,504 |
| IGO | IGO Limited | -1% | -17% | -40% | -35% | 8.79 | $6,588,229,973 |
| ARN | Aldoro Resources | -1% | -5% | -35% | -48% | 0.084 | $11,308,394 |
| WGX | Westgold Resources. | -1% | 0% | 28% | 129% | 2 | $947,245,460 |
| AAR | Astral Resources NL | -2% | -11% | -2% | 6% | 0.0765 | $60,275,413 |
| EMR | Emerald Res NL | -2% | -15% | 28% | 109% | 2.48 | $1,543,864,656 |
| PNM | Pacific Nickel Mines | -2% | 27% | 15% | 18% | 0.098 | $40,988,804 |
| LM8 | Lunnonmetalslimited | -2% | -1% | -33% | -23% | 0.685 | $148,683,525 |
| KRM | Kingsrose Mining Ltd | -2% | -10% | -21% | -31% | 0.045 | $33,863,693 |
| SPD | Southernpalladium | -3% | -12% | -18% | -54% | 0.37 | $15,938,981 |
| HCH | Hot Chili Ltd | -3% | 5% | 8% | 23% | 1.075 | $129,598,049 |
| FML | Focus Minerals Ltd | -3% | 3% | -6% | -33% | 0.17 | $48,714,970 |
| S2R | S2 Resources | -3% | -19% | 26% | 0% | 0.17 | $67,665,101 |
| ZNC | Zenith Minerals Ltd | -3% | 72% | 14% | -38% | 0.165 | $58,142,846 |
| KAI | Kairos Minerals Ltd | -3% | -26% | -15% | -26% | 0.0155 | $41,934,595 |
| BNZ | Benzmining | -3% | -15% | -13% | -27% | 0.3 | $32,947,510 |
| MEG | Megado Minerals Ltd | -3% | -12% | -32% | -33% | 0.03 | $7,888,122 |
| AWJ | Auric Mining | -3% | 25% | -3% | -6% | 0.06 | $7,851,575 |
| STN | Saturn Metals | -3% | 8% | -22% | -22% | 0.14 | $26,609,892 |
| GAL | Galileo Mining Ltd | -3% | -13% | -60% | -68% | 0.28 | $56,323,104 |
| FAL | Falconmetalsltd | -4% | -4% | -57% | -52% | 0.135 | $23,895,000 |
| KSN | Kingston Resources | -4% | -4% | -30% | -1% | 0.08 | $40,334,909 |
| GED | Golden Deeps | -4% | 4% | -13% | -42% | 0.052 | $6,007,162 |
| KCC | Kincora Copper | -4% | -7% | -62% | -64% | 0.026 | $4,163,303 |
| NVA | Nova Minerals Ltd | -4% | -8% | -25% | -64% | 0.245 | $53,776,940 |
| IPT | Impact Minerals | -4% | 10% | -8% | 57% | 0.011 | $31,511,743 |
| AME | Alto Metals Limited | -4% | -2% | -27% | -36% | 0.043 | $30,710,604 |
| AM7 | Arcadia Minerals | -4% | -12% | -50% | -59% | 0.085 | $9,269,259 |
| SBR | Sabre Resources | -5% | 27% | 68% | 11% | 0.042 | $15,359,117 |
| ADVDB | Ardiden Ltd | -5% | 19% | -32% | -32% | 0.205 | $14,785,844 |
| IVR | Investigator Res Ltd | -5% | -3% | -24% | -10% | 0.038 | $56,049,631 |
| SRN | Surefire Rescs NL | -5% | -32% | -50% | -21% | 0.0095 | $16,530,778 |
| GWR | GWR Group Ltd | -5% | 1% | 10% | 27% | 0.075 | $24,091,249 |
| SSR | SSR Mining Inc. | -5% | -25% | -28% | -27% | 16.93 | $404,301,937 |
| TRM | Truscott Mining Corp | -5% | -13% | 22% | 34% | 0.055 | $9,535,188 |
| SNG | Siren Gold | -5% | -17% | -45% | -70% | 0.055 | $9,060,253 |
| SMS | Starmineralslimited | -5% | -20% | -29% | -50% | 0.036 | $2,688,221 |
| BMO | Bastion Minerals | -6% | 14% | -52% | -53% | 0.016 | $3,346,484 |
| BNR | Bulletin Res Ltd | -6% | 35% | 131% | 67% | 0.155 | $45,506,621 |
| MRZ | Mont Royal Resources | -6% | -6% | 78% | -11% | 0.155 | $12,755,715 |
| AL8 | Alderan Resource Ltd | -6% | -25% | 7% | 7% | 0.0075 | $7,748,029 |
| DLI | Delta Lithium | -6% | -19% | -28% | 4% | 0.4825 | $296,764,792 |
| CY5 | Cygnus Metals Ltd | -6% | 16% | -38% | -62% | 0.145 | $45,145,167 |
| MM8 | Medallion Metals. | -6% | -6% | -38% | -62% | 0.058 | $17,843,796 |
| BEZ | Besragoldinc | -6% | 46% | -43% | 179% | 0.145 | $71,077,154 |
| REZ | Resourc & En Grp Ltd | -7% | -7% | 27% | -13% | 0.014 | $5,997,669 |
| ANX | Anax Metals Ltd | -7% | -25% | -63% | -49% | 0.027 | $12,984,776 |
| CHN | Chalice Mining Ltd | -7% | -19% | -80% | -77% | 1.4775 | $569,831,240 |
| ION | Iondrive Limited | -7% | -7% | -43% | -48% | 0.013 | $5,835,423 |
| ICG | Inca Minerals Ltd | -7% | -32% | -46% | -43% | 0.013 | $7,597,662 |
| DRE | Dreadnought Resources Ltd | -7% | -25% | -48% | -70% | 0.0315 | $107,165,304 |
| EMC | Everest Metals Corp | -7% | -16% | 21% | 11% | 0.088 | $14,368,914 |
| LCL | LCL Resources Ltd | -8% | -20% | -40% | -58% | 0.024 | $20,651,916 |
| GBR | Greatbould Resources | -8% | -14% | -28% | -37% | 0.057 | $28,431,857 |
| MVL | Marvel Gold Limited | -8% | 10% | -12% | -58% | 0.011 | $9,501,698 |
| ADN | Andromeda Metals Ltd | -8% | 10% | -42% | -50% | 0.022 | $68,420,186 |
| WCN | White Cliff Min Ltd | -8% | -8% | 57% | -21% | 0.011 | $14,042,153 |
| M2R | Miramar | -8% | -35% | -54% | -71% | 0.022 | $2,977,391 |
| VKA | Viking Mines Ltd | -8% | 22% | 38% | 10% | 0.011 | $11,277,843 |
| EM2 | Eagle Mountain | -8% | -21% | -45% | -68% | 0.055 | $16,468,211 |
| AAJ | Aruma Resources Ltd | -8% | -3% | -55% | -38% | 0.033 | $6,103,637 |
| SPQ | Superior Resources | -8% | 16% | -33% | -61% | 0.022 | $36,691,075 |
| RND | Rand Mining Ltd | -8% | -4% | 6% | -8% | 1.25 | $73,938,749 |
| SKY | SKY Metals Ltd | -9% | 0% | -19% | -13% | 0.042 | $19,378,720 |
| GSN | Great Southern | -9% | -9% | -5% | -28% | 0.021 | $15,847,339 |
| A8G | Australasian Metals | -9% | -23% | 19% | -18% | 0.155 | $8,078,677 |
| NMR | Native Mineral Res | -9% | -3% | -9% | -73% | 0.03 | $6,502,266 |
| SVG | Savannah Goldfields | -9% | -21% | -66% | -74% | 0.05 | $10,022,011 |
| CDT | Castle Minerals | -9% | -9% | -35% | -52% | 0.01 | $13,469,423 |
| DTR | Dateline Resources | -9% | 0% | -38% | -73% | 0.01 | $13,129,455 |
| A1G | African Gold Ltd. | -9% | -32% | -57% | -64% | 0.03 | $5,079,336 |
| MEI | Meteoric Resources | -10% | -1% | 4% | 301% | 0.2125 | $408,260,396 |
| MTC | Metalstech Ltd | -10% | -15% | -59% | -73% | 0.14 | $26,404,643 |
| GML | Gateway Mining | -10% | -25% | -55% | -70% | 0.018 | $6,298,168 |
| PUR | Pursuit Minerals | -10% | 13% | -50% | -44% | 0.009 | $26,495,743 |
| KAL | Kalgoorliegoldmining | -11% | -11% | -40% | -70% | 0.025 | $3,710,851 |
| BC8 | Black Cat Syndicate | -11% | 37% | -34% | -30% | 0.25 | $75,941,336 |
| LEX | Lefroy Exploration | -11% | -3% | -23% | -37% | 0.165 | $31,408,280 |
| CEL | Challenger Gold Ltd | -11% | -16% | -59% | -62% | 0.066 | $88,169,568 |
| MKR | Manuka Resources. | -11% | -14% | -33% | -53% | 0.04 | $25,313,403 |
| GPR | Geopacific Resources | -11% | -6% | -20% | -50% | 0.016 | $13,147,478 |
| BMR | Ballymore Resources | -12% | -15% | -21% | -27% | 0.11 | $16,081,699 |
| RXL | Rox Resources | -12% | -20% | -49% | 3% | 0.18 | $68,406,091 |
| WA8 | Warriedarresourltd | -12% | -17% | -60% | -71% | 0.05 | $27,800,824 |
| ARL | Ardea Resources Ltd | -12% | -6% | 19% | -35% | 0.46 | $88,571,171 |
| RMX | Red Mount Min Ltd | -13% | -22% | 17% | -30% | 0.0035 | $9,357,516 |
| LYN | Lycaonresources | -13% | -8% | -17% | -36% | 0.175 | $7,489,563 |
| MI6 | Minerals260Limited | -13% | -14% | -36% | -7% | 0.315 | $73,710,000 |
| TBR | Tribune Res Ltd | -13% | -11% | -26% | -33% | 2.7 | $145,861,254 |
| BAT | Battery Minerals Ltd | -13% | 8% | -67% | -67% | 0.04 | $4,784,180 |
| GBZ | GBM Rsources Ltd | -13% | -28% | -46% | -70% | 0.013 | $7,443,862 |
| GSM | Golden State Mining | -14% | -44% | -41% | -56% | 0.019 | $4,299,485 |
| DTM | Dart Mining NL | -15% | -14% | -70% | -69% | 0.017 | $3,676,036 |
| G88 | Golden Mile Res Ltd | -16% | 5% | 17% | 3% | 0.021 | $7,246,569 |
| MAT | Matsa Resources | -17% | -11% | -38% | -32% | 0.025 | $12,843,199 |
| TNC | True North Copper | -19% | -17% | 136% | 136% | 0.125 | $32,480,181 |
| BYH | Bryah Resources Ltd | -20% | 14% | -11% | -38% | 0.016 | $5,737,685 |
| PKO | Peako Limited | -20% | -33% | -56% | -72% | 0.004 | $2,635,424 |
| USL | Unico Silver Limited | -21% | -9% | -35% | -46% | 0.091 | $26,940,695 |
| ASO | Aston Minerals Ltd | -22% | -15% | -67% | -64% | 0.029 | $38,851,928 |
| XAM | Xanadu Mines Ltd | -22% | -21% | 6% | 83% | 0.053 | $91,844,317 |
| NAG | Nagambie Resources | -24% | 40% | -30% | -58% | 0.028 | $14,543,158 |
| SVY | Stavely Minerals Ltd | -25% | -28% | -58% | -79% | 0.052 | $21,006,705 |
| MKG | Mako Gold | -25% | -48% | -61% | -74% | 0.0105 | $6,048,086 |
| AVW | Avira Resources Ltd | -25% | 0% | -50% | -50% | 0.0015 | $3,200,685 |
| PNT | Panthermetalsltd | -25% | -25% | -26% | -70% | 0.057 | $3,669,000 |
| ARV | Artemis Resources | -28% | 44% | 136% | 4% | 0.026 | $40,608,765 |
| OAU | Ora Gold Limited | -29% | -33% | 25% | 0% | 0.005 | $33,733,005 |
| RDN | Raiden Resources Ltd | -31% | 100% | 1200% | 995% | 0.052 | $134,222,217 |
| OZM | Ozaurum Resources | -33% | 61% | 200% | 105% | 0.135 | $23,018,750 |
| GMR | Golden Rim Resources | -33% | -43% | -63% | -61% | 0.012 | $7,099,060 |
| AYM | Australia United Min | -33% | -33% | -50% | -33% | 0.002 | $3,685,155 |
| ASR | Asra Minerals Ltd | -39% | 21% | -6% | -58% | 0.0085 | $13,105,851 |
| ILT | Iltani Resources | 10% | 31% | -26% | -29% | 0.17 | $7,100,000 |
| ARD | Argent Minerals | -10% | -10% | -10% | -10% | 0.009 | $10,610,000 |