Gold Digger: Are ASX large cap gold stocks a screaming buy?
Pic: John W Banagan / Stone via Getty Images
The valuations of major gold miners remain weak despite falling debt and record dividends, according to the latest Metals Focus Gold Peer Group Analysis.
Australia’s largest gold miners Newcrest (ASX:NCM), Northern Star (ASX:NST), and Evolution (ASX:EVN) are down 24%, 33% and 34% respectively over the past 12 months.
In the mid cap space Regis Resources (ASX:RRL), Silver Lake Resources (ASX:SLR), Ramelius Resources (ASX:RMS) and Gold Road (ASX:GOR) have dropped 60%, 44%, 38% and 21% over the same period.
Perseus Mining (ASX:PRU) is the only standout – if you can call it that — having maintained a 0% return over the past year.
This is partially sentiment driven, with the precious metal struggling to stay above $US1,800 as other commodities boom. The current price of $US1,745/oz is down 15% from all time highs hit last year.
And yet the fundamentals for major miners are strong, Metals Focus says.
“During the last gold bull market, which ended in 2012, gold miners had increasingly been using debt to fund project development in the pursuit of higher production,” it says.
“This changed as prices began declining and margins were squeezed, which led to miners reprioritising cost and capex reduction to maximise cash flow and lower debt.”
This strategy has been largely successful.
Net debt for global large cap gold miners has fallen from a peak of $US32bn in 2013 to its present level of US$6bn, Metals Focus says.
“Improved margins, thanks also to a rising gold price, has allowed companies to boost dividends and in some cases start share buy-back programmes,” it says.
“The weighted average dividend yield for the peer group is still a modest 3.1%, but this is a new high in our records going back to 2009.”

However, despite these improving financial metrics the sector’s rating has lagged.
“The weighted average enterprise value/EBITDA and the adjusted price to earnings ratio in Q2.21 were close to their lowest levels in our records going back to 2009,” Metals Focus says.
“This suggests that these companies are undervalued relative to historic levels despite strong fundamentals.”

Former geologist and experienced stockbroker Guy Le Page said as much in his Stockhead column this week.
“With the gold index off almost 40% from its July 2020 highs I believe it is time to re-enter the mid to large cap gold stocks and I think Evolution Mining (ASX:EVN) is probably a good option,” he says.
“EVN are a little more conservative in their growth strategy, sticking to First World jurisdictions, and somewhat cautious about stretching their balance sheet, however the company provides good leverage to any bounce in gold.”
Winners & Losers
Here’s how ASX-listed gold & silver stocks are performing:
Scroll or swipe to reveal table. Click headings to sort. Best viewed on a laptop
| CODE | COMPANY | 1 WEEK RETURN % | 1 MONTH RETURN % | 6 MONTH RETURN % | 1 YEAR RETURN % | PRICE | MARKET CAP |
|---|---|---|---|---|---|---|---|
| A8G | Australasian Gold | 56 | 179 | 0.405 | $ 12,941,752.29 | ||
| KCN | Kingsgate Consolidated | 44 | 71 | 43 | 35 | 1.23 | $ 261,158,134.54 |
| AVW | Avira Resources Ltd | 40 | 75 | 8 | -13 | 0.007 | $ 10,312,740.00 |
| MTC | Metalstech Ltd | 35 | 155 | 211 | 229 | 0.56 | $ 79,588,819.00 |
| MVL | Marvel Gold Limited | 26 | 28 | 36 | 13 | 0.068 | $ 38,788,498.14 |
| GML | Gateway Mining | 20 | 13 | -36 | -14 | 0.018 | $ 34,265,440.80 |
| AXE | Archer Materials | 18 | -3 | 104 | 259 | 1.94 | $ 454,274,559.27 |
| AAJ | Aruma Resources Ltd | 17 | 52 | 84 | -13 | 0.105 | $ 11,336,535.27 |
| POL | Polymetals Resources | 17 | 0 | 0.14 | $ 5,435,255.98 | ||
| NMR | Native Mineral Res | 16 | 11 | -13 | 0.26 | $ 7,491,510.00 | |
| STN | Saturn Metals | 14 | 7 | 22 | -34 | 0.45 | $ 52,928,819.70 |
| WWI | West Wits Mining Ltd | 14 | -17 | -40 | 47 | 0.05 | $ 74,424,611.63 |
| SMI | Santana Minerals Ltd | 14 | 9 | -11 | -40 | 0.125 | $ 17,675,058.58 |
| NML | Navarre Minerals Ltd | 13 | 14 | -35 | -22 | 0.098 | $ 65,609,382.19 |
| PNM | Pacific Nickel Mines | 11 | 54 | 63 | 74 | 0.08 | $ 16,117,127.70 |
| STK | Strickland Metals | 11 | 37 | 164 | 14 | 0.052 | $ 50,789,751.19 |
| KTA | Krakatoa Resources | 11 | 49 | 16 | -30 | 0.073 | $ 20,924,404.11 |
| GBR | Greatbould Resources | 10 | 96 | 323 | 252 | 0.165 | $ 53,585,371.35 |
| TRM | Truscott Mining Corp | 10 | 3 | 62 | 70 | 0.034 | $ 5,014,070.95 |
| RDT | Red Dirt Metals Ltd | 9 | 88 | 76 | 50 | 0.3 | $ 38,112,728.00 |
| RDS | Redstone Resources | 9 | 9 | 0 | -29 | 0.012 | $ 8,627,988.76 |
| NWM | Norwest Minerals | 9 | 10 | -4 | -28 | 0.075 | $ 13,545,545.63 |
| FML | Focus Minerals Ltd | 9 | 2 | -16 | -45 | 0.255 | $ 46,600,884.08 |
| PNX | PNX Metals Limited | 8 | -19 | -13 | -35 | 0.0065 | $ 25,565,354.58 |
| NAE | New Age Exploration | 8 | 18 | -7 | 8 | 0.013 | $ 18,666,685.83 |
| M2R | Miramar | 8 | 11 | -5 | 0.21 | $ 9,915,154.20 | |
| FAU | First Au Ltd | 8 | 27 | -18 | -18 | 0.014 | $ 7,990,173.80 |
| CHZ | Chesser Resources | 7 | 0 | -12 | -31 | 0.145 | $ 67,496,938.13 |
| TBR | Tribune Res Ltd | 7 | -1 | -2 | -33 | 5.15 | $ 270,210,596.55 |
| PDI | Predictive Disc Ltd | 7 | 24 | 99 | 125 | 0.155 | $ 216,241,656.48 |
| OZM | Ozaurum Resources | 7 | 11 | 3 | 0.155 | $ 8,582,400.00 | |
| SLZ | Sultan Resources Ltd | 6 | 0 | -13 | -17 | 0.17 | $ 11,820,846.13 |
| PF1 | Pathfinder Resources | 6 | 19 | 40 | 0.35 | $ 17,463,684.00 | |
| BYH | Bryah Resources Ltd | 6 | 12 | 2 | -5 | 0.057 | $ 12,331,601.80 |
| TG1 | Techgen Metals Ltd | 5 | 18 | 0.2 | $ 7,705,757.00 | ||
| CWX | Carawine Resources | 5 | -2 | -28 | -13 | 0.205 | $ 22,322,429.91 |
| LEX | Lefroy Exploration | 5 | 11 | -42 | 65 | 0.42 | $ 46,286,496.80 |
| AAU | Antilles Gold Ltd | 5 | 10 | -18 | 127 | 0.085 | $ 21,200,641.39 |
| BBX | BBX Minerals Ltd | 5 | 10 | -19 | -54 | 0.22 | $ 98,474,617.13 |
| SKY | SKY Metals Ltd | 4 | 7 | -40 | -23 | 0.096 | $ 29,846,507.04 |
| GED | Golden Deeps | 4 | 9 | 20 | -25 | 0.012 | $ 9,310,217.28 |
| DEX | Duke Exploration | 4 | -6 | -26 | 0.245 | $ 21,650,676.48 | |
| GIB | Gibb River Diamonds | 4 | 15 | -11 | 60 | 0.075 | $ 15,651,698.93 |
| AGC | AGC Ltd | 4 | 4 | -26 | 0.125 | $ 8,127,274.08 | |
| AGC | AGC Ltd | 4 | 4 | -26 | 0.125 | $ 8,127,274.08 | |
| SNG | Siren Gold | 4 | -12 | -32 | 0.265 | $ 17,206,724.16 | |
| AWJ | Auric Mining | 4 | 4 | -25 | 0.135 | $ 6,034,499.60 | |
| HRN | Horizon Gold Ltd | 3 | 23 | -26 | -4 | 0.35 | $ 37,342,205.60 |
| THR | Thor Mining PLC | 3 | 42 | 23 | -3 | 0.0185 | $ 11,163,348.39 |
| NAG | Nagambie Resources | 3 | -1 | 21 | 43 | 0.08 | $ 40,494,520.03 |
| HWK | Hawkstone Mng Ltd | 3 | 11 | 11 | 193 | 0.041 | $ 68,793,777.24 |
| DCN | Dacian Gold Ltd | 2 | -7 | -45 | -37 | 0.21 | $ 203,160,300.84 |
| KRM | Kingsrose Mining Ltd | 2 | -2 | 5 | 18 | 0.046 | $ 35,770,360.25 |
| CY5 | Cygnus Gold Limited | 2 | 0 | -26 | -31 | 0.125 | $ 13,552,512.25 |
| HAW | Hawthorn Resources | 2 | 16 | -12 | -46 | 0.051 | $ 17,676,327.49 |
| ICG | Inca Minerals Ltd | 2 | 27 | 51 | 150 | 0.14 | $ 64,905,360.75 |
| AME | Alto Metals Limited | 1 | -7 | 10 | -5 | 0.08 | $ 36,020,778.88 |
| ARN | Aldoro Resources | 1 | -1 | 109 | 329 | 0.45 | $ 38,681,979.16 |
| MM8 | Medallion Metals. | 1 | 12 | -8 | 0.235 | $ 19,027,970.21 | |
| NUS | Nusantara Resources | 1 | 2 | 34 | 22 | 0.3475 | $ 80,506,369.93 |
| BGL | Bellevue Gold Ltd | 0 | -9 | -9 | -21 | 0.8375 | $ 842,839,708.64 |
| ALK | Alkane Resources Ltd | 0 | -16 | 15 | -46 | 0.81 | $ 494,172,704.00 |
| PNR | Pantoro Limited | 0 | 16 | 13 | 10 | 0.22 | $ 309,979,713.56 |
| NVA | Nova Minerals Ltd | 0 | 32 | -9 | 32 | 0.145 | $ 252,141,997.05 |
| MGV | Musgrave Minerals | 0 | -5 | -25 | -51 | 0.275 | $ 151,968,540.47 |
| BCN | Beacon Minerals | 0 | -6 | -14 | -4 | 0.032 | $ 114,672,836.64 |
| ARV | Artemis Resources | 0 | 39 | 6 | -22 | 0.086 | $ 105,419,802.68 |
| LCL | Los Cerros Limited | 0 | -7 | -10 | -24 | 0.13 | $ 82,384,751.15 |
| ENR | Encounter Resources | 0 | 55 | 50 | 66 | 0.24 | $ 75,901,565.52 |
| OKU | Oklo Resources Ltd | 0 | 4 | -31 | -57 | 0.12 | $ 60,483,577.44 |
| KSN | Kingston Resources | 0 | 15 | -9 | -15 | 0.195 | $ 57,230,911.40 |
| GWR | GWR Group Ltd | 0 | -27 | -41 | -24 | 0.15 | $ 42,390,102.02 |
| WRM | White Rock Min Ltd | 0 | -5 | -50 | -52 | 0.295 | $ 41,315,073.88 |
| BAT | Battery Minerals Ltd | 0 | 25 | -44 | 0 | 0.015 | $ 31,548,038.00 |
| CTO | Citigold Corp Ltd | 0 | 10 | -15 | -8 | 0.011 | $ 31,170,250.00 |
| IPT | Impact Minerals | 0 | 25 | -38 | -40 | 0.015 | $ 30,356,923.79 |
| TRY | Troy Resources Ltd | 0 | -5 | -46 | -58 | 0.037 | $ 30,073,993.35 |
| ANL | Amani Gold Ltd | 0 | 100 | 100 | 0 | 0.002 | $ 28,410,393.49 |
| ICL | Iceni Gold | 0 | 2 | 0.235 | $ 28,148,298.36 | ||
| KWR | Kingwest Resources | 0 | 89 | 0 | -14 | 0.125 | $ 26,034,648.88 |
| BAR | Barra Resources | 0 | 29 | 29 | 13 | 0.027 | $ 22,151,850.36 |
| MCT | Metalicity Limited | 0 | 11 | -29 | -57 | 0.01 | $ 21,437,715.32 |
| CGN | Crater Gold Min Ltd | 0 | 0 | -23 | 31 | 0.017 | $ 20,867,429.74 |
| LNY | Laneway Res Ltd | 0 | 0 | -9 | -38 | 0.005 | $ 19,520,329.67 |
| SI6 | SI6 Metals Limited | 0 | -8 | -37 | -25 | 0.012 | $ 17,137,727.82 |
| SRN | Surefire Rescs NL | 0 | 0 | -48 | -7 | 0.014 | $ 15,460,345.73 |
| NPM | Newpeak Metals | 0 | 100 | -33 | -33 | 0.002 | $ 13,654,870.31 |
| KGM | Kalnorth Gold Ltd | 0 | 0 | 0 | 0 | 0.013 | $ 11,625,120.78 |
| PUA | Peak Minerals Ltd | 0 | -16 | -36 | -45 | 0.016 | $ 9,835,242.43 |
| ALY | Alchemy Resource Ltd | 0 | 0 | 0 | -33 | 0.014 | $ 9,411,408.34 |
| MLS | Metals Australia | 0 | 33 | 0 | 0 | 0.002 | $ 8,454,376.09 |
| FG1 | Flynngold | 0 | 3 | 0.155 | $ 8,399,999.72 | ||
| TMX | Terrain Minerals | 0 | 13 | -10 | -44 | 0.009 | $ 6,621,849.08 |
| WCN | White Cliff Min Ltd | 0 | 18 | -32 | 8 | 0.013 | $ 6,206,356.79 |
| MAU | Magnetic Resources | 0 | 3 | 3 | 40 | 1.65 | $ 359,986,258.50 |
| CYL | Catalyst Metals | -1 | -2 | -6 | -24 | 1.87 | $ 182,092,826.86 |
| WMC | Wiluna Mining Corp | -1 | 0 | -5 | -53 | 1.03 | $ 161,473,429.68 |
| ARL | Ardea Resources Ltd | -1 | 0 | -7 | 5 | 0.485 | $ 64,185,911.84 |
| MDI | Middle Island Res | -1 | -6 | -63 | -74 | 0.094 | $ 11,507,312.87 |
| AUT | Auteco Minerals | -1 | -11 | -12 | -43 | 0.082 | $ 136,708,672.75 |
| AOP | Apollo Consolidated | -1 | 3 | 7 | 21 | 0.38 | $ 113,732,030.10 |
| TIE | Tietto Minerals | -1 | 6 | -11 | -35 | 0.33 | $ 150,541,200.48 |
| SAU | Southern Gold | -2 | -3 | -24 | -50 | 0.065 | $ 13,653,040.38 |
| VAN | Vango Mining Ltd | -2 | -3 | -21 | -37 | 0.063 | $ 70,346,777.66 |
| MAT | Matsa Resources | -2 | 11 | -24 | -53 | 0.061 | $ 21,847,431.82 |
| MKR | Manuka Resources. | -2 | 2 | -20 | -35 | 0.3 | $ 29,432,408.27 |
| E2M | E2 Metals | -2 | 6 | -10 | 37 | 0.28 | $ 42,131,939.64 |
| MEG | Megado | -2 | -4 | -47 | 0.096 | $ 4,089,635.81 | |
| GBZ | GBM Rsources Ltd | -2 | 2 | 20 | -22 | 0.1175 | $ 58,283,070.31 |
| CST | Castile Resources | -2 | -10 | 0 | -37 | 0.215 | $ 43,936,226.62 |
| HCH | Hot Chili Ltd | -3 | 0 | -15 | -3 | 0.039 | $ 165,957,633.89 |
| RND | Rand Mining Ltd | -3 | -4 | -8 | -25 | 1.46 | $ 83,038,903.06 |
| VMC | Venus Metals Cor Ltd | -3 | -3 | -15 | -26 | 0.17 | $ 24,172,589.28 |
| BGD | Bartongoldholdings | -3 | 0 | 0.17 | $ 15,451,199.28 | ||
| YRL | Yandal Resources | -3 | -2 | 15 | 100 | 0.5 | $ 50,722,176.27 |
| MRR | Minrex Resources Ltd | -3 | -6 | -30 | -36 | 0.016 | $ 9,330,192.88 |
| MKG | Mako Gold | -3 | 9 | -3 | -10 | 0.094 | $ 35,930,710.59 |
| RGL | Riversgold | -3 | -11 | -35 | -43 | 0.031 | $ 11,313,181.49 |
| AGS | Alliance Resources | -3 | 11 | -19 | -37 | 0.15 | $ 31,202,570.10 |
| EMR | Emerald Res NL | -3 | 6 | 3 | 45 | 0.86 | $ 438,087,625.95 |
| AGG | AngloGold Ashanti | -4 | -12 | -24 | -43 | 4.155 | $ 366,643,914.15 |
| GSM | Golden State Mining | -4 | 8 | -10 | -46 | 0.13 | $ 10,757,286.54 |
| PGD | Peregrine Gold | -4 | -13 | 0.37 | $ 12,431,554.15 | ||
| MEU | Marmota Limited | -4 | 11 | 14 | 0 | 0.049 | $ 46,489,617.12 |
| AL8 | Alderan Resource Ltd | -4 | -4 | -36 | -59 | 0.047 | $ 16,076,690.99 |
| G50 | Gold50Limited | -4 | 4 | 0.235 | $ 11,573,140.23 | ||
| FFR | Firefly Resources | -4 | 0 | -15 | -26 | 0.115 | $ 35,459,045.95 |
| NXM | Nexus Minerals Ltd | -4 | 139 | 245 | 324 | 0.335 | $ 85,453,084.85 |
| TCG | Turaco Gold Limited | -4 | -12 | 83 | 57 | 0.11 | $ 38,621,601.50 |
| NES | Nelson Resources. | -4 | 10 | -68 | -38 | 0.044 | $ 8,354,564.39 |
| ERM | Emmerson Resources | -4 | -2 | -4 | -28 | 0.065 | $ 33,381,978.76 |
| DGO | DGO Gold Limited | -4 | -11 | -10 | -17 | 2.8 | $ 229,530,760.20 |
| DTR | Dateline Resources | -4 | -4 | 15 | 15 | 0.086 | $ 38,236,838.90 |
| DTM | Dart Mining NL | -5 | -5 | -36 | -38 | 0.105 | $ 10,494,274.98 |
| A1G | African Gold Ltd. | -5 | 53 | -5 | 78 | 0.24 | $ 23,564,000.22 |
| DEG | De Grey Mining | -5 | -14 | -9 | -25 | 1.01 | $ 1,324,727,487.53 |
| RED | Red 5 Limited | -5 | 11 | 25 | -37 | 0.2 | $ 483,053,933.66 |
| HXG | Hexagon Energy | -5 | 10 | -24 | 40 | 0.08 | $ 35,681,106.16 |
| GMN | Gold Mountain Ltd | -5 | 0 | -47 | -51 | 0.02 | $ 21,402,983.40 |
| PRS | Prospech Limited | -5 | -11 | -43 | 0 | 0.08 | $ 5,475,204.42 |
| SVL | Silver Mines Limited | -5 | 0 | -13 | -3 | 0.195 | $ 251,801,036.57 |
| AUC | Ausgold Limited | -5 | -3 | -26 | 5 | 0.039 | $ 60,243,282.56 |
| NCM | Newcrest Mining | -5 | -7 | -6 | -27 | 23.32 | $ 19,353,419,906.56 |
| M24 | Mamba Exploration | -5 | 9 | -38 | 0.19 | $ 7,030,000.00 | |
| TAM | Tanami Gold NL | -5 | -3 | -14 | 16 | 0.071 | $ 83,431,890.27 |
| SLR | Silver Lake Resource | -5 | -1 | -18 | -44 | 1.325 | $ 1,212,895,947.33 |
| BNR | Bulletin Res Ltd | -5 | 30 | -1 | 13 | 0.07 | $ 17,751,915.24 |
| TAR | Taruga Minerals | -5 | 2 | 16 | -20 | 0.052 | $ 27,139,180.32 |
| ADT | Adriatic Metals | -5 | 9 | 40 | 40 | 2.93 | $ 548,671,851.09 |
| VKA | Viking Mines Ltd | -6 | -26 | -60 | 40 | 0.017 | $ 17,361,393.33 |
| BMO | Bastion Minerals | -6 | 52 | 16 | 0.25 | $ 17,113,565.00 | |
| CMM | Capricorn Metals | -6 | -2 | 39 | 6 | 2.16 | $ 799,222,789.61 |
| VRC | Volt Resources Ltd | -6 | 22 | 94 | 136 | 0.033 | $ 87,376,646.12 |
| RVR | Red River Resources | -6 | 6 | -31 | 27 | 0.165 | $ 85,432,770.56 |
| XAM | Xanadu Mines Ltd | -6 | 18 | -55 | -21 | 0.033 | $ 39,659,689.13 |
| CDR | Codrus Minerals Ltd | -6 | 0 | 0.165 | $ 6,800,000.00 | ||
| CAI | Calidus Resources | -6 | 18 | 28 | -3 | 0.565 | $ 225,959,516.06 |
| MOH | Moho Resources | -6 | 5 | -32 | -44 | 0.062 | $ 6,712,901.13 |
| RSG | Resolute Mining | -6 | -8 | -34 | -55 | 0.4175 | $ 469,154,400.05 |
| BC8 | Black Cat Syndicate | -6 | -4 | -22 | -32 | 0.53 | $ 72,516,022.67 |
| KAI | Kairos Minerals Ltd | -6 | 7 | 7 | -55 | 0.03 | $ 48,619,068.11 |
| CEL | Challenger Exp Ltd | -6 | 13 | -5 | 31 | 0.295 | $ 291,546,127.50 |
| ADN | Andromeda Metals Ltd | -6 | -12 | -58 | 12 | 0.145 | $ 356,925,046.67 |
| IDA | Indiana Resources | -6 | 7 | -28 | 18 | 0.058 | $ 25,197,923.68 |
| HRZ | Horizon | -7 | 2 | 2 | -17 | 0.1075 | $ 59,637,396.00 |
| BDC | Bardoc Gold Ltd | -7 | -11 | -22 | -26 | 0.057 | $ 100,644,927.81 |
| NST | Northern Star | -7 | -7 | -10 | -35 | 8.91 | $ 10,652,906,715.00 |
| LCY | Legacy Iron Ore | -7 | 0 | -7 | 180 | 0.014 | $ 83,261,600.72 |
| BRV | Big River Gold Ltd | -7 | -10 | -30 | -42 | 0.28 | $ 61,443,886.56 |
| AAR | Anglo Australian | -7 | 8 | -13 | -51 | 0.084 | $ 50,079,056.08 |
| CLA | Celsius Resource Ltd | -7 | 17 | -34 | -13 | 0.027 | $ 27,227,930.11 |
| RRL | Regis Resources | -7 | -19 | -32 | -60 | 2 | $ 1,546,126,814.10 |
| EVN | Evolution Mining Ltd | -7 | -8 | -15 | -38 | 3.645 | $ 6,891,851,557.44 |
| MHC | Manhattan Corp Ltd | -7 | 8 | -24 | -73 | 0.013 | $ 19,841,623.01 |
| BTR | Brightstar Resources | -7 | -10 | -42 | -16 | 0.026 | $ 11,433,519.86 |
| CDT | Castle Minerals | -7 | 0 | -24 | 8 | 0.013 | $ 8,790,009.82 |
| ASO | Aston Minerals Ltd | -7 | 4 | 45 | 191 | 0.125 | $ 104,961,717.19 |
| WAF | West African Res Ltd | -7 | -9 | 11 | -9 | 0.935 | $ 852,965,539.05 |
| NSM | Northstaw | -7 | 0 | -28 | -38 | 0.31 | $ 12,439,370.00 |
| TBA | Tombola Gold Ltd | -8 | -12 | -24 | -26 | 0.037 | $ 24,737,535.38 |
| GUL | Gullewa Limited | -8 | 0 | 13 | -11 | 0.085 | $ 17,704,698.30 |
| MZZ | Matador Mining Ltd | -8 | -8 | 13 | -19 | 0.36 | $ 77,081,038.92 |
| RDN | Raiden Resources Ltd | -8 | 14 | 4 | 50 | 0.024 | $ 29,967,395.90 |
| SPQ | Superior Resources | -8 | 0 | -8 | 50 | 0.012 | $ 18,034,235.70 |
| ZAG | Zuleika Gold Ltd | -8 | -17 | -43 | -14 | 0.024 | $ 10,252,334.33 |
| BRB | Breaker Res NL | -8 | 38 | 38 | 29 | 0.29 | $ 87,977,050.83 |
| SVY | Stavely Minerals Ltd | -8 | 1 | -37 | -30 | 0.405 | $ 108,299,002.58 |
| SSR | SSR Mining Inc. | -8 | -7 | 4 | -28 | 20.14 | $ 463,388,317.44 |
| AZS | Azure Minerals | -9 | 5 | -11 | 68 | 0.32 | $ 100,501,609.33 |
| SFM | Santa Fe Minerals | -9 | 4 | -15 | 8 | 0.085 | $ 6,189,597.07 |
| BMR | Ballymore Resources | -9 | 0 | 0 | 0 | 0.265 | $ 18,584,301.06 |
| CHN | Chalice Mining Ltd | -9 | 8 | 51 | 173 | 7.17 | $ 2,583,507,477.60 |
| WGX | Westgold Resources. | -9 | -5 | -23 | -32 | 1.6275 | $ 712,540,036.32 |
| TRN | Torrens Mining | -9 | -30 | -9 | 0.155 | $ 10,798,065.39 | |
| KAU | Kaiser Reef | -9 | -8 | -38 | -49 | 0.205 | $ 21,895,712.57 |
| IVR | Investigator Res Ltd | -9 | -2 | -27 | 22 | 0.061 | $ 80,760,743.03 |
| RMS | Ramelius Resources | -9 | -11 | -16 | -38 | 1.35 | $ 1,135,664,603.55 |
| TSO | Tesoro Resources Ltd | -9 | 0 | -50 | -67 | 0.1 | $ 50,100,686.90 |
| BNZ | Benzmining | -9 | -4 | -11 | 0.7 | $ 34,038,618.60 | |
| AWV | Anova Metals Ltd | -9 | -9 | -20 | -29 | 0.02 | $ 30,094,978.20 |
| AQX | Alice Queen Ltd | -9 | -29 | -60 | -72 | 0.01 | $ 15,072,453.11 |
| RMX | Red Mount Min Ltd | -9 | 11 | -9 | 25 | 0.01 | $ 13,180,124.72 |
| GRL | Godolphin Resources | -9 | -3 | -23 | -25 | 0.15 | $ 13,037,247.01 |
| RML | Resolution Minerals | -9 | -5 | -23 | -61 | 0.02 | $ 10,641,956.74 |
| PUR | Pursuit Minerals | -9 | -18 | -35 | 276 | 0.049 | $ 46,850,695.80 |
| GSN | Great Southern | -9 | -9 | -16 | -55 | 0.049 | $ 24,777,360.58 |
| ONX | Orminexltd | -9 | 0 | 39 | 56 | 0.039 | $ 21,915,780.96 |
| MEI | Meteoric Resources | -9 | -12 | -57 | -40 | 0.029 | $ 41,456,037.71 |
| EMU | EMU NL | -9 | 7 | -44 | -6 | 0.029 | $ 13,238,920.04 |
| FFX | Firefinch Ltd | -9 | 16 | 170 | 288 | 0.62 | $ 587,140,282.24 |
| PRU | Perseus Mining Ltd | -9 | -4 | 19 | 0 | 1.43 | $ 1,828,184,659.30 |
| DRE | Drednought Resources | -10 | -12 | 90 | 65 | 0.038 | $ 107,610,760.64 |
| ANX | Anax Metals Ltd | -10 | 20 | 51 | 289 | 0.095 | $ 34,318,021.22 |
| CBY | Canterbury Resources | -10 | -17 | -14 | -37 | 0.095 | $ 11,418,860.35 |
| AMI | Aurelia Metals Ltd | -10 | -3 | -14 | -31 | 0.32 | $ 407,489,566.44 |
| SIH | Sihayo Gold Limited | -10 | -10 | -36 | -59 | 0.009 | $ 33,169,152.72 |
| MBK | Metal Bank Ltd | -10 | -10 | -10 | 0 | 0.009 | $ 11,890,683.04 |
| GNM | Great Northern | -10 | -10 | -18 | -55 | 0.009 | $ 9,672,407.81 |
| HMX | Hammer Metals Ltd | -10 | -20 | -27 | 71 | 0.07 | $ 57,758,118.23 |
| KZR | Kalamazoo Resources | -10 | -4 | -19 | -49 | 0.35 | $ 46,347,794.73 |
| QML | Qmines Limited | -10 | -13 | 0.305 | $ 14,547,400.69 | ||
| MML | Medusa Mining Ltd | -10 | -5 | -9 | -9 | 0.74 | $ 162,141,174.78 |
| ZNC | Zenith Minerals Ltd | -11 | -7 | 62 | 83 | 0.21 | $ 67,676,071.47 |
| RXL | Rox Resources | -11 | -3 | -43 | -56 | 0.375 | $ 59,890,893.32 |
| CAZ | Cazaly Resources | -11 | -13 | -2 | -15 | 0.041 | $ 15,152,093.95 |
| OAU | Ora Gold Limited | -11 | -11 | -27 | -30 | 0.016 | $ 13,473,523.55 |
| PAK | Pacific American Hld | -11 | 14 | -18 | -31 | 0.016 | $ 5,097,358.40 |
| SBM | St Barbara Limited | -11 | -14 | -34 | -56 | 1.3375 | $ 963,275,630.80 |
| MRZ | Mont Royal Resources | -11 | 24 | 19 | -14 | 0.315 | $ 12,309,932.38 |
| GOR | Gold Road Res Ltd | -12 | -1 | 0 | -21 | 1.2325 | $ 1,114,851,759.84 |
| TLM | Talisman Mining | -12 | -17 | 38 | 32 | 0.145 | $ 27,061,115.83 |
| DDD | 3D Resources Limited | -13 | -13 | -30 | -40 | 0.0035 | $ 15,521,488.37 |
| OBM | Ora Banda Mining Ltd | -13 | -2 | -62 | -73 | 0.096 | $ 94,499,776.99 |
| TMZ | Thomson Res Ltd | -13 | -9 | -29 | 100 | 0.096 | $ 46,265,836.06 |
| G88 | Golden Mile Res Ltd | -13 | -16 | -8 | -25 | 0.047 | $ 8,208,879.74 |
| REZ | Resourc & En Grp Ltd | -13 | 43 | -15 | 82 | 0.04 | $ 17,698,912.35 |
| ADV | Ardiden Ltd | -13 | 0 | -32 | -54 | 0.013 | $ 27,941,604.81 |
| DLC | Delecta Limited | -13 | 160 | 86 | 86 | 0.013 | $ 14,924,438.17 |
| PKO | Peako Limited | -13 | -10 | -4 | -35 | 0.026 | $ 8,019,806.63 |
| PRX | Prodigy Gold NL | -14 | 0 | -21 | -40 | 0.038 | $ 22,644,476.63 |
| EM2 | Eagle Mountain | -14 | 13 | 50 | 177 | 0.72 | $ 146,331,779.76 |
| S2R | S2 Resources | -14 | -28 | -47 | -64 | 0.09 | $ 32,430,111.81 |
| GMR | Golden Rim Resources | -14 | -25 | -33 | -65 | 0.006 | $ 19,772,098.07 |
| OKR | Okapi Resources | -15 | 51 | 220 | 211 | 0.56 | $ 60,142,668.34 |
| AQI | Alicanto Min Ltd | -15 | -15 | -12 | -32 | 0.115 | $ 37,819,758.02 |
| LM8 | Lunnonmetalslimited | -16 | -19 | 0.485 | $ 37,151,075.66 | ||
| DCX | Discovex Res Ltd | -17 | -17 | -29 | -38 | 0.005 | $ 12,843,320.38 |
| SBR | Sabre Resources | -17 | 25 | 0 | -62 | 0.005 | $ 7,573,786.42 |
| TTM | Titan Minerals | -17 | -2 | -7 | -26 | 0.1075 | $ 133,459,036.52 |
| MTH | Mithril Resources | -18 | -18 | -30 | -70 | 0.014 | $ 35,983,262.57 |
| TNR | Torian Resources Ltd | -18 | 17 | -52 | 27 | 0.028 | $ 24,342,840.26 |
| AYM | Australia United Min | -18 | 29 | -10 | 125 | 0.009 | $ 16,583,197.37 |
| XTC | Xantippe Res Ltd | -20 | 33 | 0 | 0 | 0.002 | $ 8,149,128.80 |
| GTR | Gti Resources | -22 | 93 | 53 | 67 | 0.034 | $ 28,084,943.77 |
| CXU | Cauldron Energy Ltd | -25 | 6 | -20 | -11 | 0.033 | $ 16,703,983.42 |
| KCC | Kincora Copper | -26 | -24 | 0.14 | $ 10,038,994.28 | ||
| AM7 | Arcadia Minerals | -26 | 5 | 0.195 | $ 6,840,000.00 | ||
| TSC | Twenty Seven Co. Ltd | -31 | 83 | -15 | -21 | 0.0055 | $ 13,304,069.53 |
| CODE | COMPANY | 1 WEEK RETURN % | 1 MONTH RETURN % | 6 MONTH RETURN % | 1 YEAR RETURN % | PRICE | MARKET CAP |
WEEKLY SMALL CAP STANDOUTS
KINGSGATE CONSOLIDATED (ASX:KCN)
There’s light at the end of the tunnel for this once high-flying gold producer, with a settlement in sight to restart the flagship ‘Chatree’ gold mine in Thailand.
For much of its life Kingsgate was a success story on the ASX thanks to the prolific Chatree mine, enjoying a share-price ride from $2.37 in late 2008 to $12.15 just two years later.
Since that peak it’s been a long downhill slide – especially after the Thai government ordered the closure of Chatree in December 2016.
“A successful re-start of the Chatree gold mine combined with the sustained rise in both the gold and silver prices could give Kingsgate significant optionality with the asset, and a path forward which may include continuing operations, selling the asset or listing [Thai subsidiary] Akara Resources on the Thai Stock Exchange,” the company now says.
The $250m market cap stock is up 15% year-to-date.
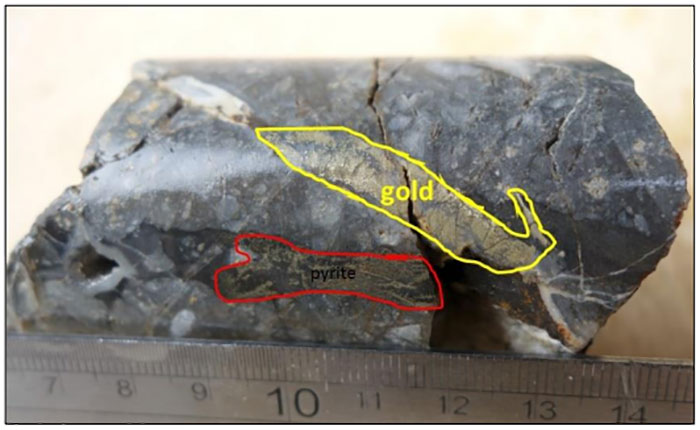
The near-term gold miner is up 140% over the past month on some strong newsflow.
Recent drilling at the 1.5moz gold, 10.9moz silver ‘Sturec’ mine has hit a potentially mineralised 37m-long zone, highlighted by a big chunk of gold at 81m depth:
This follows news that $6 billion market cap Chifeng Gold Mining would buy ~5.8m shares at 34c apiece for a total investment of $2m.
This is a pretty big deal, MTC says.
“Chifeng is widely considered to be one of the most successful precious metals investors in China owing largely to the experience of their chairman Mr Wang Jianhua who before transforming Chifeng, served as CEO of $62bn capped Zijin Mining and before that, chairman of $17bn capped Shandong Gold,” MTC chairman Russell Moran says.
MTC also reminded investors that they need to finalise their shareholdings by October 7 to receive free shares in lithium spinout Winsome Resources (ASX:WR1).
Related Topics

Related Stories


UNLOCK INSIGHTS
Discover the untold stories of emerging ASX stocks.
Daily news and expert analysis, it's free to subscribe.
By proceeding, you confirm you understand that we handle personal information in accordance with our Privacy Policy.


