The VIX or Fear Index has spiked again. Here’s why investors shouldn’t panic just yet

The VIX or Fear Index has spiked again. Picture Getty
- The fear gauge or VIX index has spiked in last two days
- What is the VIX index and what does it tell us?
- How to track the VIX Index on the ASX
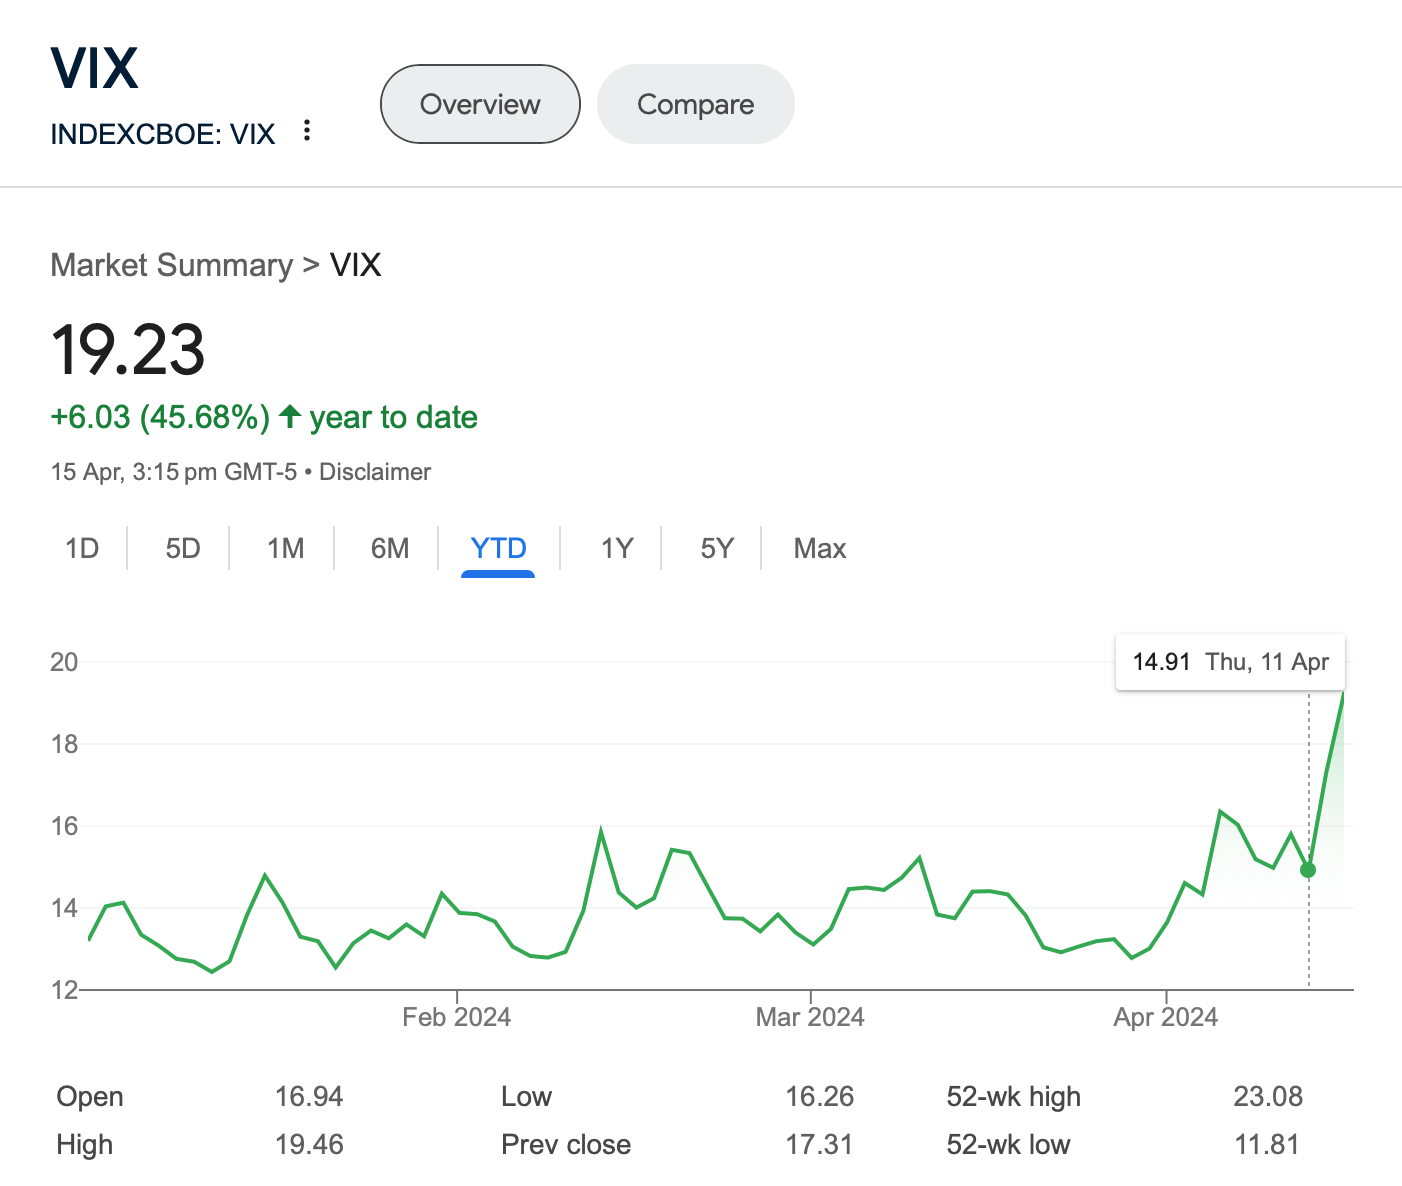
Wall Street’s CBOE VIX Index has jumped to levels unseen this year.
The Index spiked by almost 15% on Friday, and 11% more on Monday, as US traders weighed the possibility of less Fed rate cuts and the prospect of a direct conflict between Iran and Israel.
On a year to date basis, the Index is currently up by 45% – much lower than the 80% spike we saw in 2022 but still something that investors should be concerned about.
VIX Index has spiked recently
Often called Wall Street’s “fear gauge”, the VIX (short for volatility index) essentially predicts how volatile S&P 500 stock prices could be in the next 30 days.
High levels of volatility are typically associated with fear, and the moniker “fear index” is used because it is seen as a gauge of investors’ anxiety or apprehension about the market.
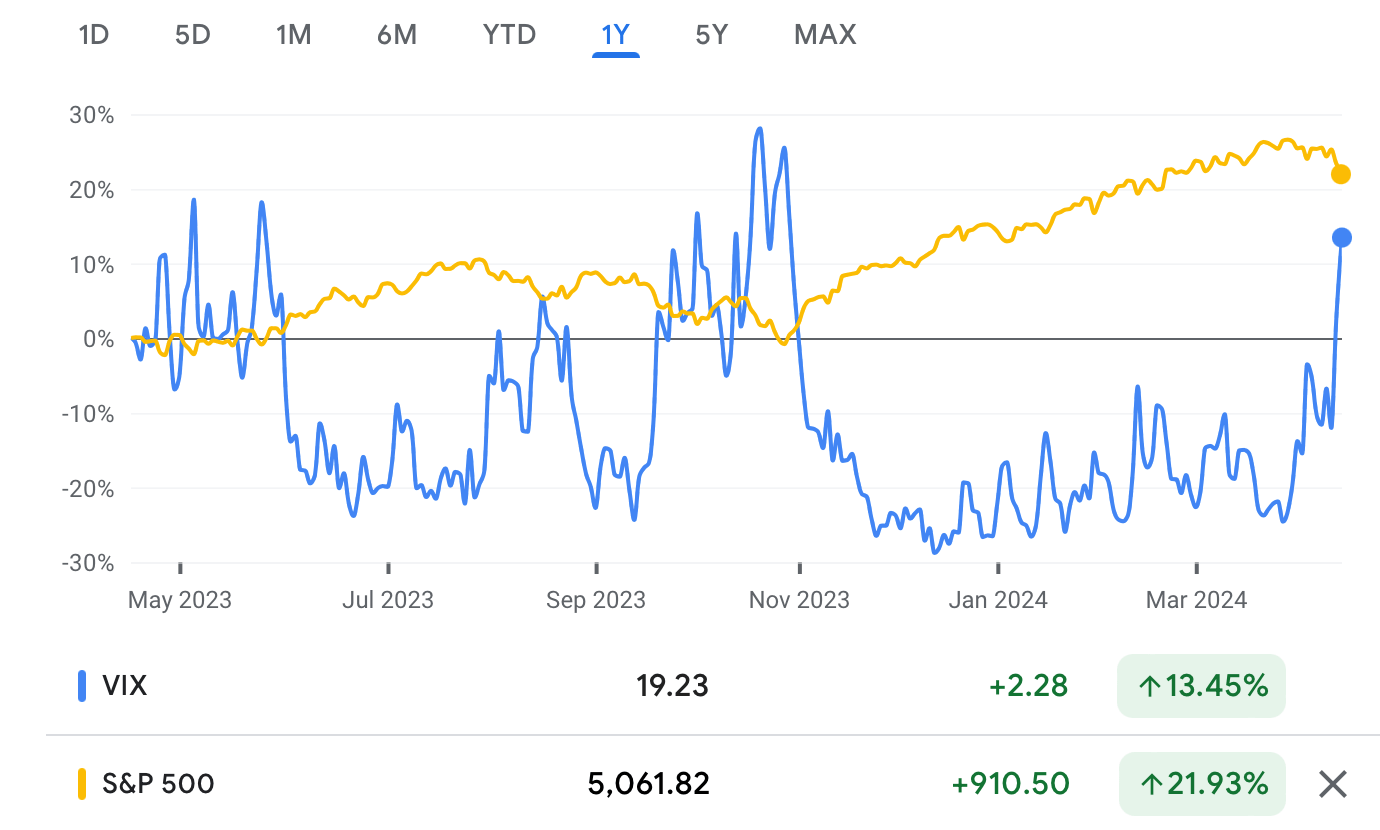
The VIX index is also inversely correlated with the stock market, ie; when the VIX goes up, stocks tend to decline.
VIX is inversely correlated with stock market’s return
In general, when the US VIX index is at 12 or lower, the market is considered to be in a period of low volatility.
From 20 to 30, the market is thought to be experiencing high volatility, while a VIX reading above 30 is viewed as a signal of increased uncertainty and risk in the market.
At the current level of 19, the Index is telling us that we are far from where we need to start panicking.
How is the VIX Index calculated?
In short, the CBOE (Chicago Board of Exchange) calculates the VIX Index by implying volatilities from existing options prices.
To calculate it, the exchange compiles near-dated S&P 500 index options (both calls and puts) which are expiring in the next 30 days.
A volatility figure can be implied from each option price, as volatility is one of the inputs to the option pricing model (the Black-Scholes model).
The volatilities of these options would then be aggregated and averaged into one simple VIX index number, which is essentially the market’s expectations of volatility in the market.
To get more in the detail of the calculations, read here: The ‘Fear Index’ ain’t as bad as it sounds. Here’s a way to trade and profit from volatility
Does the ASX have its own VIX Index?
Yes, the S&P/ASX 200 VIX is under the ticker ASX:XVI.
The XVI is up by around 1% this year, which reflects the resilience of Australian stocks in the face of global events.
The ASX’s own VIX Index, called the XVI

The ASX has defined the ASX 200 XVI reading as follows:
- XVI below 15 – low volatility, bullish market
- XVI from 15 to 20 – more volatility ahead, but still a slight bullish bias
- XVI above 20 – bearish, more uncertainties and risks in the market
At the current level of 11, the Index is telling us that we are in fact on a bullish trend.
How should investors use the VIX index to make decisions?
The answer depends on your risk tolerance levels, and how each perceives the risk/reward proposition.
Investors who have a high risk tolerance might be comfortable with buying stocks when the market is volatile, hoping to catch a spike. This however comes with obvious risks.
Institutional investors often use the VIX index to help with asset allocation decisions, moving funds from equities to cash when the VIX Index is high, and vice versa.
Can we make money from trading the VIX Index?
Yes, but only for those who are comfortable with trading in derivatives or Option contracts.
Traders can profit from fluctuations in volatilities by buying and selling Options.
In general, the higher the Implied Volatility of an option (for both calls and puts), the higher the value of the option and vice versa.
By buying and selling options before they expire, traders can capture and monetise volatility in the market.
Related Topics
Related Stories


UNLOCK INSIGHTS
Discover the untold stories of emerging ASX stocks.
Daily news and expert analysis, it's free to subscribe.
By proceeding, you confirm you understand that we handle personal information in accordance with our Privacy Policy.


