Fear Index spikes to highest level since Covid – can ASX traders capitalise?

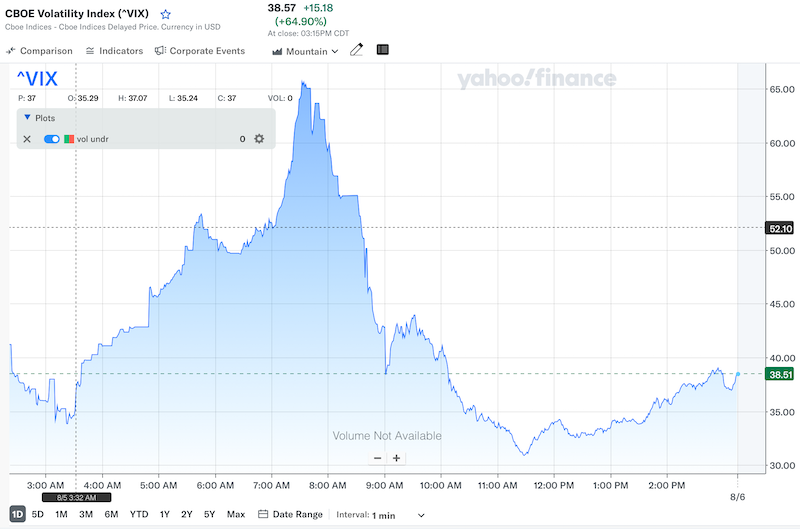
The CBOE VIX soared 65pc on Monday night, its highest since 2020. Picture Getty
- The CBOE VIX soared 65pc on Monday night, its highest since 2020
- VIX measures expected volatility; levels above 30 signal high market fear
- The ASX 200 has its own volatility measure, and here’s how you can trade it
Wall Street’s famous fear gauge, the CBOE Volatility Index (VIX), surged to its highest level since 2020 on Monday amid the global market crash.
The index spiked by a massive 65% to to 38.57 as traders fled riskier assets.

The CBOE VIX essentially predicts how volatile S&P 500 stock prices could be in the next 30 days.
It’s called the Fear Gauge because when the index spikes, it suggests that investors are nervous about potential market downturns in the short term.
Generally, VIX values above 30 indicate increased market volatility and heightened investor fear.
When the VIX is at 15 or lower, the market is considered to be in a period of low volatility.
To summarise, this is how most traders read the VIX index:
0-15: This range suggests market optimism and very low volatility
15-25: This range shows moderate volatility but nothing too severe
25-30: This range indicates rising market turbulence and increasing volatility
30 and above: This range signals high market volatility with potential for significant swings
The VIX typically moves opposite to the S&P 500 — when the VIX goes up, the S&P 500 usually goes down.
How is the VIX Index calculated?
In short, the CBOE (Chicago Board of Exchange) calculates the VIX Index by implying volatilities from existing options prices linked to the S&P 500.
To calculate it, the exchange compiles near-dated S&P 500 index options (both calls and puts) which are expiring in the next 30 days.
A volatility figure can be implied from each option price, as volatility is one of the inputs to the option pricing model (the Black-Scholes model).
These volatilities would then be aggregated and averaged into one simple VIX index number.
Read more: The ‘Fear Index’ has spiked recently. What is it and should investors care?
How should investors use the VIX index to make decisions?
The answer depends on your risk tolerance levels, and how each perceives the risk/reward proposition.
Investors who have a high risk tolerance might be comfortable with buying stocks when the market is volatile, hoping to catch a spike.
This however comes with obvious risks.
Institutional investors often use the VIX index to help with asset allocation decisions, moving funds from equities to cash when the VIX Index is high, and vice versa
The ASX 200 Fear Index
The ASX 200 index has its own market volatility measure, listed under the ticker ASX:XVI.
Similar to CBOE VIX, the XVI tracks ASX 200 index option prices to gauge short-term volatility in the Australian stock market.

The ASX has defined the ASX 200 XVI reading as follows:
XVI below 15 – low volatility, bullish market
XVI from 15 to 20 – more volatility ahead, but still a slight bullish bias
XVI above 20 – bearish, more uncertainties and risks in the market
Can you trade the XVI index?
Unfortunately no, you cannot directly trade the ASX:XVI index as it only provides a measure of market volatility, but is not itself a tradable security.
However, you can trade options that are linked to the ASX 200 to profit from spiking volatility.
In general, the higher the Implied Volatility of an option (for both calls and puts), the higher the value of the option and vice versa.
This is particularly true for longer dates options, as opposed to shorter dated ones.
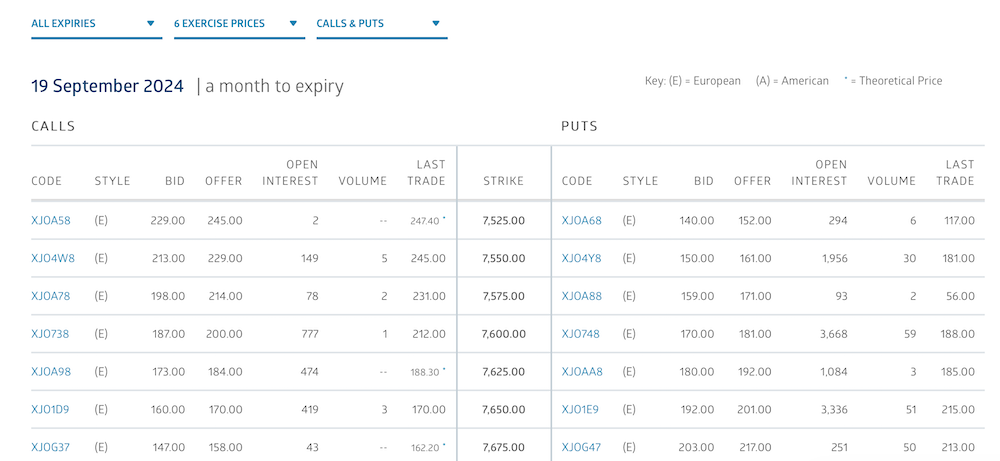
Here’s a screenshot of the option contracts on the ASX 200 that you can trade.

The full list of option contracts linked to the ASX 20o index, with all the difference exercise prices can be seen here.
Related Topics
SUBSCRIBE
Get the latest breaking news and stocks straight to your inbox.
It's free. Unsubscribe whenever you want.
By proceeding, you confirm you understand that we handle personal information in accordance with our Privacy Policy.


