The ‘Fear Index’ has spiked recently. What is it and should investors care?

Picture Getty Images
Vaccine rollouts in 2021 have finally provided the markets with a sense of certainty and stability.
As a result, the Chicago Board of Trade Volatility Index (CBOE VIX) has dropped by more than 30% this year, after rocketing by 400% in March 2020 when the pandemic first struck.
Worryingly however, the index has spiked again since the end of June, rising by 15%.
But what does it mean, and why should investors care?
First, the CBOE VIX index measures near-term volatility of the S&P 500 benchmark, which is made up of the top 500 largest companies listed on stock exchanges in the US.
In other words, it measures how volatile the stock prices of these 500 companies could be in the next 30 days.
Volatility itself is a measure of how fast a stock/index price changes. It’s not about the direction (up or down), but more to do with price swings in either direction.
Market volatility is usually an indication of turmoil, so in effect, the VIX index is used as a tool to gauge market sentiment, and has been widely called the “Fear Index”.
How is CBOE VIX calculated
There are two ways to calculate the volatility of a particular stock/index.
Mathematically speaking, volatility is just the standard deviation (SD) of the price over a certain period of time.
It’s easy to calculate. First you would need to get daily historical closing prices of the stock/index for the period in question, and calculate the average price.
A simple SD would then calculate how much the price swings (up or down) away from this average price.
Another way to calculate volatility, which is the method used by CBOE, is to imply it from existing options prices.
To calculate the CBOE VIX index, the exchange compiles near-dated S&P 500 index options (calls and puts), which are expiring in the next 30 days.
A volatility number can then be implied from each option price, as it is one of the inputs to the option pricing model (usually the Black-Scholes model). These volatilities would then be aggregated and averaged into one simple VIX index number.
The calculation is actually more technical than that, but it gives a quick picture of what’s involved.
The ASX 200 Fear Index
The ASX 200 index also has a market volatility index, and can be seen under the ticker ASX:XVI.
Similar to CBOE VIX, it tracks ASX 200 index option prices to calculate levels of near-term volatility in the Australian stock market.
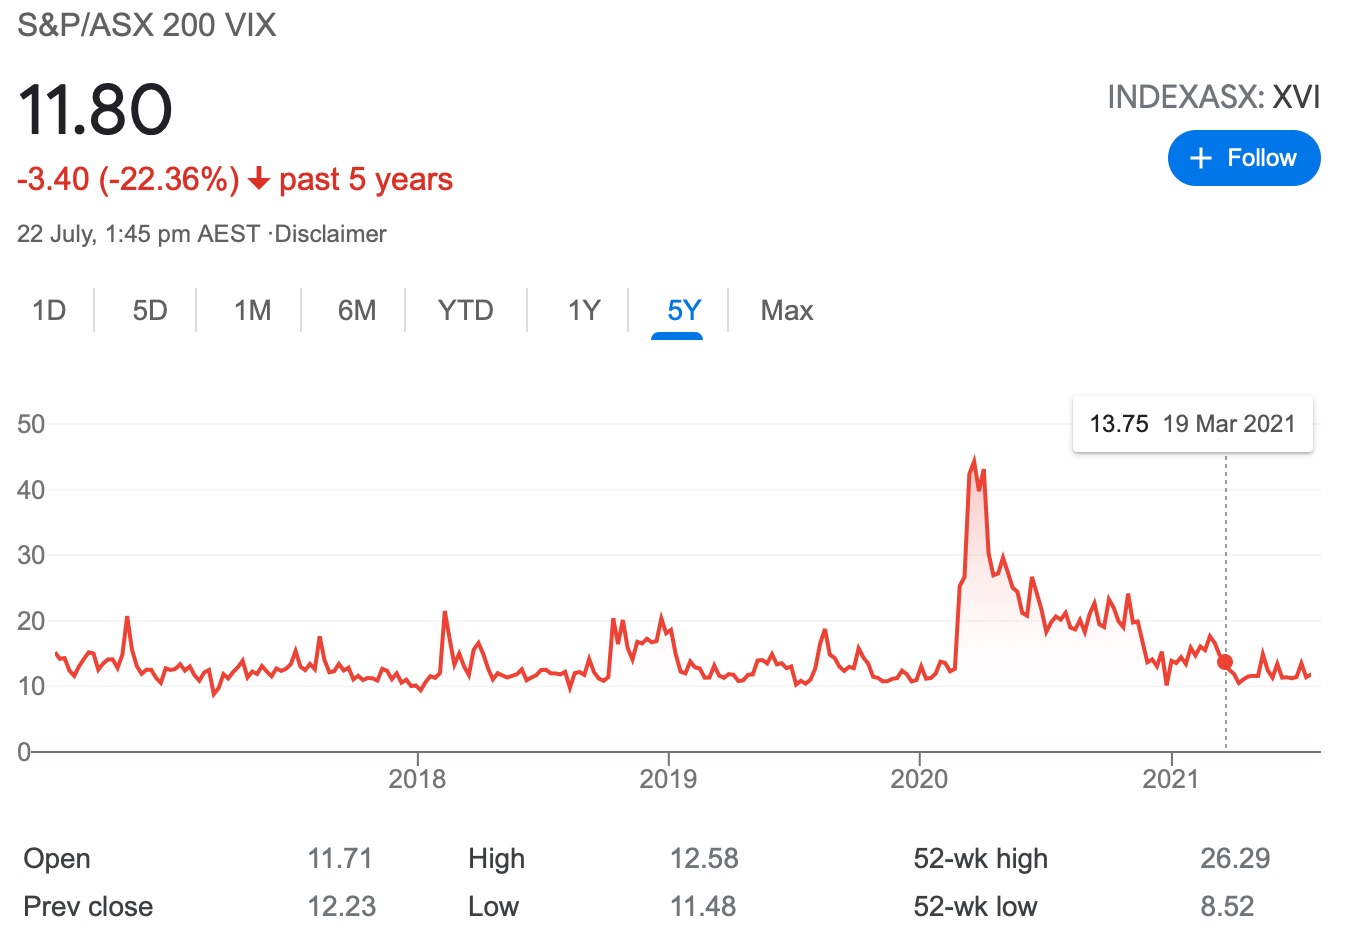
Movements in the ASX 200 VIX index pretty much track that of CBOE VIX.
Needless to say, high levels imply an expectation of large changes in the ASX 200, while a low VIX value implies a market expectation of very little change.
So how should investors use the VIX index to help with trading decisions?
The answer depends on your risk tolerance levels, and how each perceives the risk/reward proposition.
Investors who have a high risk tolerance might be comfortable with buying stocks when the market is volatile, hoping to catch a spike. This however, comes with obvious risks.
Institutional investors meanwhile, often use the VIX index to help with asset allocation decisions, moving funds between equities and cash along with movements in VIX.
Related Topics
Related Stories


UNLOCK INSIGHTS
Discover the untold stories of emerging ASX stocks.
Daily news and expert analysis, it's free to subscribe.
By proceeding, you confirm you understand that we handle personal information in accordance with our Privacy Policy.


