Hot Money Monday: Using Bollinger Bands to identify buying opportunities on the ASX
News
News
“Bollinger Bands” are a technical analysis tool used by traders and investors to gauge the volatility and potential price movements of a financial asset such as a stock.
They help us understand and predict how much a stock might move up or down in price, identifying potential trading opportunities.
Bollinger Bands were developed by John Bollinger, a renowned technical analyst and author, in the 1980s.
John Bollinger introduced Bollinger Bands in his book “Bollinger on Bollinger Bands,” published in 2001.
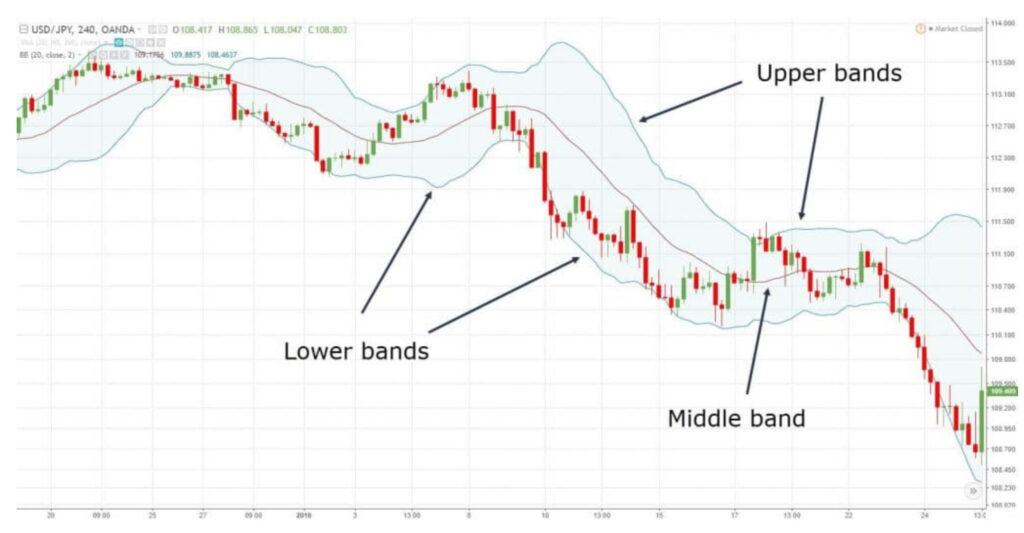
Bollinger Bands basically consist of three lines:
The Middle Band:
This line represents the average price of the stock over a specified period, typically 20 days.
Think of this line as the “middle ground” for the stock’s price over the past few weeks.
This centre line of the Bollinger Bands helps us see if the stock’s price is going up, down, or staying steady.
It’s kind of like a guide that tells us the general direction the stock’s price is heading.
The Upper Band:
The ‘upper bound’ line is drawn above the middle line and shows us how far the stock’s price might go up from its average.
It’s usually set at a certain distance, like two standard deviations away from the middle band.
So, when the stock’s price moves above this line, it might mean it’s getting higher than usual.
It serves as an upper boundary or resistance level, indicating a potential overbought condition when prices approach or exceed it.
The Lower Band:
This line is drawn below the middle line, showing us how far the stock’s price might drop from its average.
It’s usually set at a certain distance, like two times the average, but in the opposite direction.
So, when the stock’s price falls below this line, it might mean it’s getting lower than usual.
This can signal that the stock is potentially “on sale” or oversold, which could be a buying opportunity for investors.

When a stock’s price falls below the lower Bollinger Band, it indicates that the stock might be trading at a level lower than its usual value, suggesting it could be oversold or undervalued.
This may present an opportunity for traders to consider buying the stock.
The buy signal is confirmed when the price subsequently moves back inside the Bollinger Bands, suggesting a potential reversal in the downtrend.
This movement back toward the middle of the bands is known as a “reversion to the mean,” indicating that the oversold condition may be easing, and the stock price could begin to rise again.
Traders often seek additional confirmation signals, such as bullish candlestick patterns or increasing trading volume, to strengthen the buy signal and validate the potential reversal.
It’s important to remember that while a buy signal based on Bollinger Bands can provide valuable insights, it’s not a guarantee of success, and traders should always consider other factors before making trading decisions.
These are just some ASX small caps where the stock prices have fallen below the Lower Bound over the past 10 days.
Data from Commsec. Note: This list is a sample and does not include all the stocks.
| Code | Name | 10 Day +/-1.5 Std Dev | 20 Day +/-2 Std Dev | 50 Day +/-2 Std Dev |
|---|---|---|---|---|
| ANG | Austin Engineering | Below Lower | Between Bands | Between Bands |
| ERA | Energy Resources Of Australia | Below Lower | Between Bands | Crossed Below Lower |
| IIQ | Inoviq | Below Lower | Between Bands | Between Bands |
| RFT | Rectifier Technologies | Below Lower | Between Bands | Between Bands |
| LMG | Latrobe Magnesium | Below Lower | Between Bands | Between Bands |
| RDN | Raiden Resources | Below Lower | Between Bands | Between Bands |
| MGX | Mount Gibson Iron | Below Lower | Between Bands | Between Bands |
| LRK | Lark Distilling | Below Lower | Between Bands | Between Bands |
| SPA | Spacetalk | Below Lower | Between Bands | Between Bands |
| MAN | Mandrake Resources | Below Lower | Between Bands | Between Bands |
| SMN | Structural Monitoring | Below Lower | Between Bands | Between Bands |
| STX | Strike Energy | Below Lower | Between Bands | Between Bands |
| AHC | Austco Healthcare | Below Lower | Between Bands | Below Lower |