The Candlestick: Filthy lovely dirty wonderful troubling coal
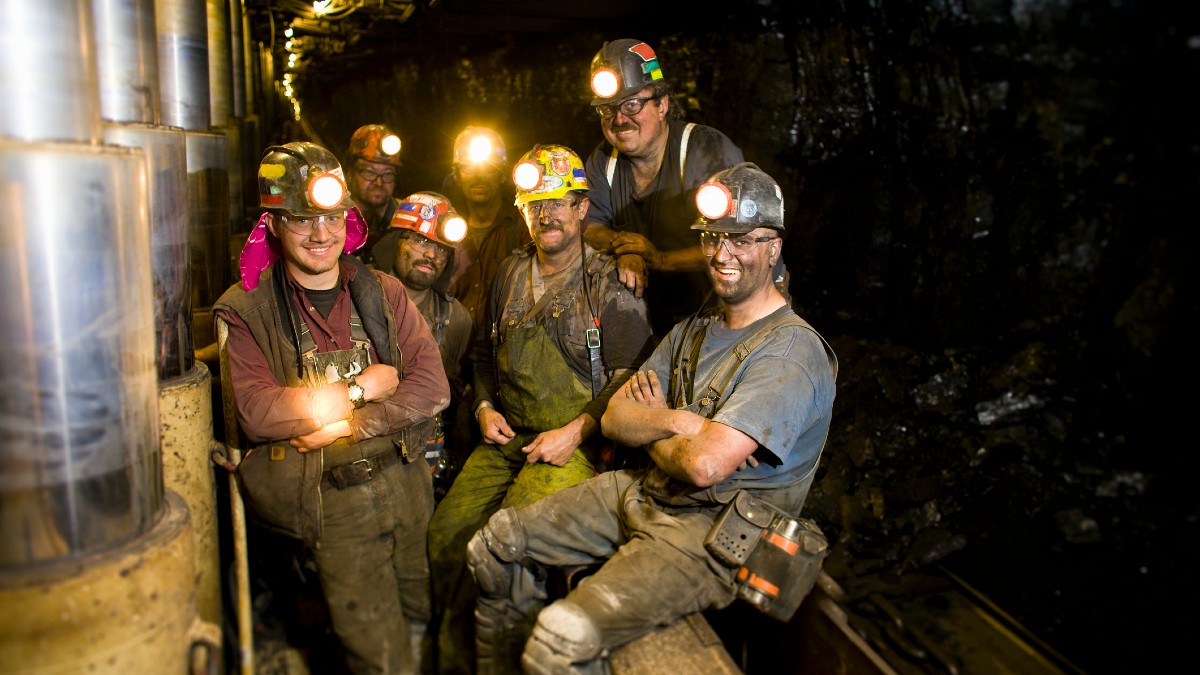
Coal - these guys love it! Picture: Getty Images
Carl Capolingua is one of Australia’s leading technical analysts. Admired for his wildly unique, possibly taunting Nick Kyrgios style of price action-based trend tracking.
Capo has been honing his art over some 30 years of investing, advising, and managing funds.
Every week in The Candlestick, Carl will be plotting, for your sheer madness, a data-trove of unleavened technical analysis covering markets globally, then drilling fearlessly down into stock-specifics.
Here is his picture. (Just in case you see him crossing the street…)

Third iteration: Green or Greed
Instead of the usual whip around the grounds, I thought I’d do something a little different in week three of The Man, The Candlestick. Easily bored, every day on Twitter I publish a shortlist of ASX stocks which I feel have the strongest technical analysis trends.
Without doubt, there has been one particular group of stocks which have dominated my thoughts, dreams and lists since the start of this year. Filthy, lovely and perplexing they are too.
Coal is all mine
Some of these stocks are up well over 100 per cent over that time, and this is even more horrific/impressive when you consider how terrible/terrible the rest of the market has been. So, in this Candlestick, I thought I’d take you on a quick (but hopefully) enlightening tour of the ASX coal sector.
Thermal Coal Spot
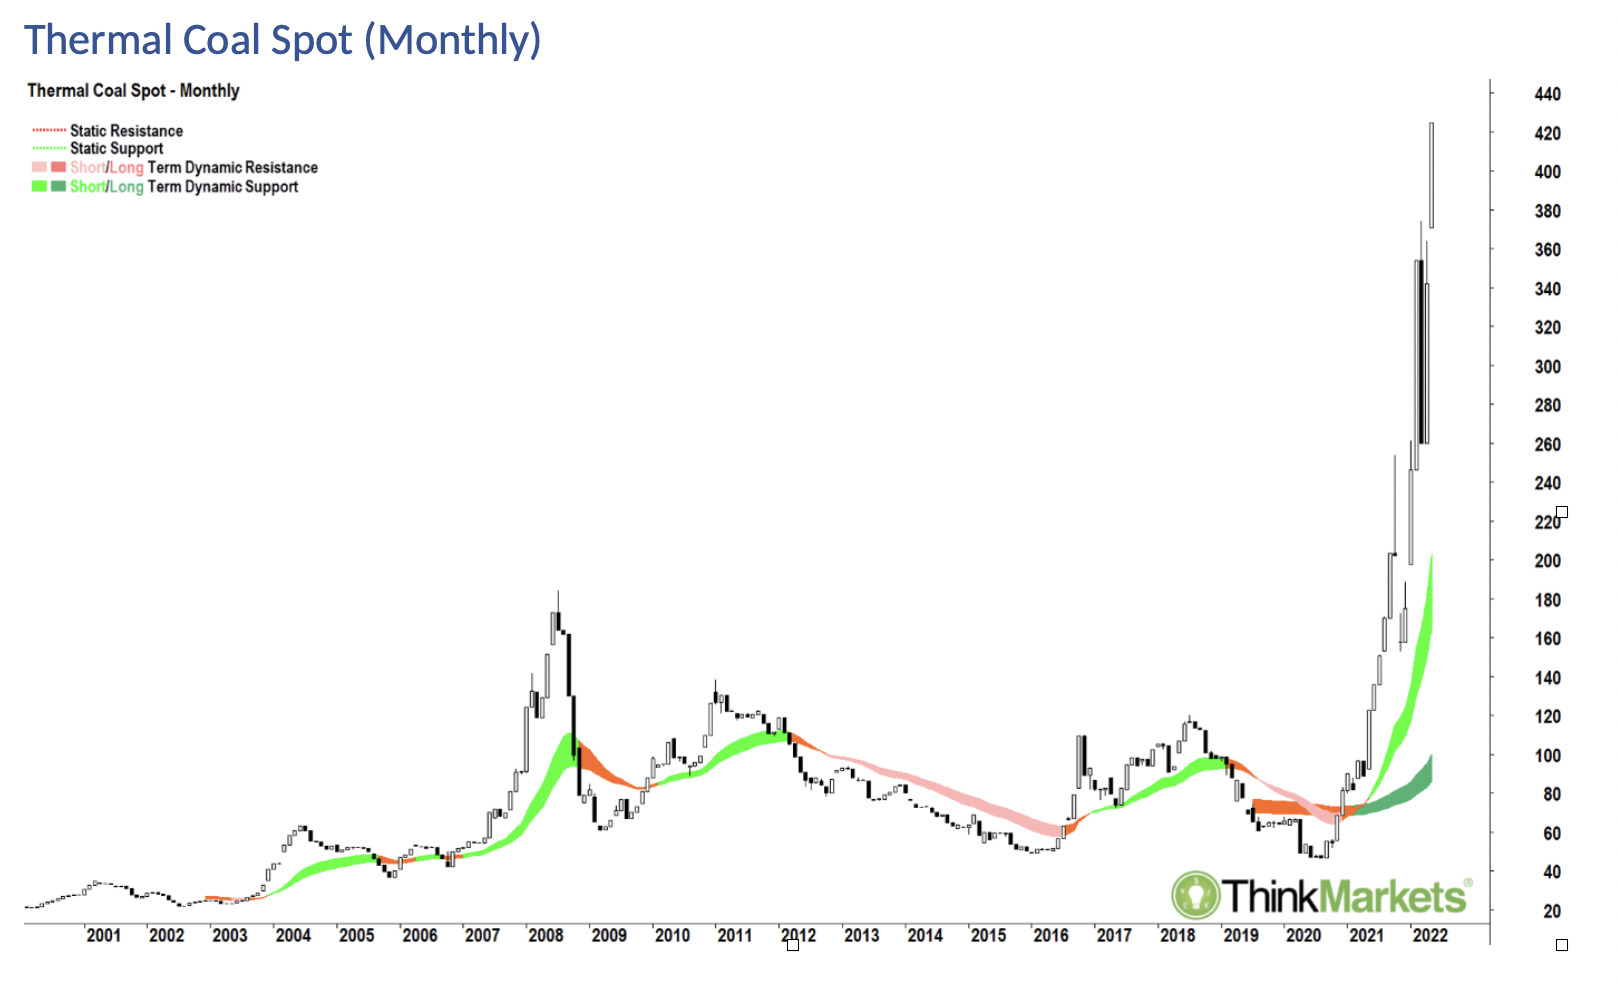
Let’s kick off with the chart of Thermal Coal Spot.
I’ve used a monthly chart here to give you some idea of the magnitude of this year’s rally. It is unprecedented. An obscene beauty.
Certainly, it now dwarfs the bull market which occurred between 2003 and 2008 triggered by the awakening of China’s insatiable demand for commodities. Then came the GFC, and then came 12 years of range-bound action between US$50/tonne and US$120/tonne. Cue Russia’s invasion of Ukraine – and here we are now.
The charts today might want to disagree so the most important thing I’m going to say first is this: Coal prices won’t continue this breathtaking vertical trajectory forever. Inevitably, sadly and/or spectacularly – they will fall. And if history is anything to go by, they will fall hard.
Trends end. Full stop.
This doesn’t mean we shouldn’t participate in a trend simply because we know it’s going to eventually fall out from under us.
But trends tend to bend before they end (see: Hardy, Ed).
We discussed the tell-tale signs a trend is bending and ending in last week’s surprise blockbuster of The Candlestick: How a Bull turns into a Bear in Nine charts. Looking at the Thermal Coal chart, I do not see at this moment any clear signs the trend is bending, and certainly not that it is ending.
This doesn’t mean I won’t start seeing them from tomorrow, I can’t see the future (I can plot a trend), but that’s how technical analysis works: one day, one piece of the puzzle at a time…
Coal Capo’s Sector Overview
You would have had to have been living under a dirty great big black rock made of fossilised dinosaurs and ferns to not have heard of the incredible performance of local coal stocks in 2022.
Love it or hate it, coal is the stuff probably making those photons blast from your phone, stimulating your retina, and allowing you to read this gloriously unrenewable sentence. At least for now.
Yes, needless to scream, we need to transition to solar, wind, geothermal and blah blah blah (all hail Bob Brown!), but in the meantime, coal is the stuff which delivers the base load to keep the economy ticking along (and your backside warm and toasty for the next few months!). It is reliable. It has certainty. A rare quality in business or markets of late.
There are two types of coal which companies are generally trying to find and flog. The ‘thermal’ variety, which as the name suggests, is burned by power stations to produce the steam to power the turbines which generate electricity. Then there’s ‘metallurgical’, or ‘met’ coal.
As the name also suggests on this one, it’s used in combination with iron ore to produce steel. Met coal’s price tends to ebb and flow with the demand for steel which is used in construction (think reinforced concrete, beams, machinery, and autos), and this has been largely dependent on demand from China.
Whilst making another tonne of steel to build a dam, bridge, or 100 apartment blocks in the middle of nowhere is somewhat optional, keeping the lights on and stopping people from getting cold enough to overthrow your disorganised arse is another thing entirely.
The reason for the big fuss in 2022 comes right back – as so much does – to the Russian invasion of Ukraine. The two sparring neighbours supply over 70% of Europe’s thermal coal requirements (and around 30% of its met coal needs).
Several Asian countries most importantly China also have an exposure, but perhaps in this case, some have a lower aversion to continuing to purchase Russian coal as sanctions came into play. Either way, when we look at the demand side, according to the International Energy Agency (IEA), the world is expected to experience its greatest ever demand for thermal coal by 2024.
Add to the mix, years of underinvestment in new coal production (it is downright dirty, ESG investors abhor it, it’s political poison et al). Global coal supply has not been able to keep up with the continuously building demand. IEA figures suggest global coal production has been flat-to-slightly-lower since 2018.
The result of high, growing and non-negotiable demand, versus (sudden and acute) limited supply is what I like to call, and then draw: “double rocket emojis under coal prices!”
Now, if you can stifle the vomit or suck back the rising bile or perhaps hide the grin when you think about profiting from coal and focus on the short-term opportunity here (i.e: green is good vs greed is good), the fantastic news is the ASX is laden with a bunch of very good coal businesses.
Let’s look at the absolute superstars of my daily feature charts now and ask the question… is it too late to get on that coal train?
Bathurst Resources (ASX:BRL)
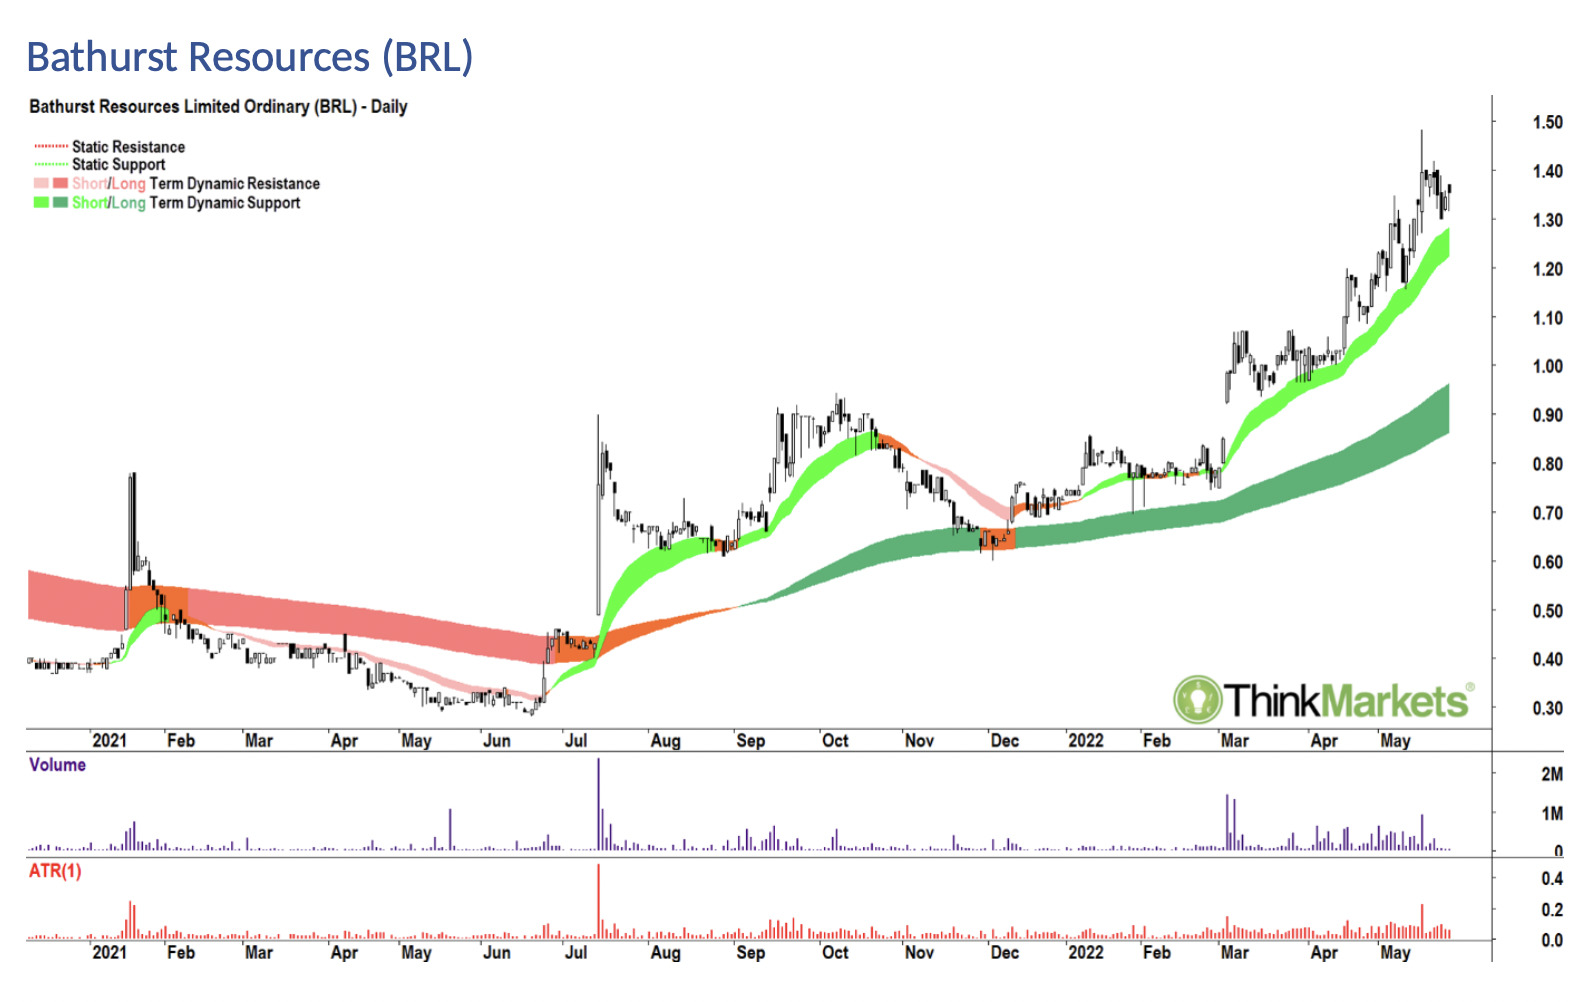
This is one of my favourite stocks of 2022. It’s just been such a reliable trend since the cluster of white candles occurring at the start of March.
Note, that cluster includes a nice gap which indicates a major shift in the demand-supply dynamics towards the demand-side.
Gaps of this nature, especially when they are not challenged, are a reliable indicator of higher prices ahead. We can see my short-term trend indicator ‘ribbon’, i.e., the light green zone, is well established to the upside, as is the long-term trend ribbon, i.e., the dark green zone.
I have a couple of concerns about the recent price action, however.
Firstly, we are seeing a compression in peaks and troughs beneath 1.50 and above 1.30, simply, the trend is slowing down in the very short term. But I also note this is largely happening above key demand candles around 1.30 – so it’s more likely indicative of some pesky supply rather than anything too sinister.
Secondly, there’s a few too many black candles over the last couple of weeks than I’d typically like. So, whilst I’d be happy to go ‘strong hold’ on this one, I’d like to see the two issues identified resolved before swinging back to a confident ‘buy’.
View: Bullish, buy dips until a close below 1.150.
New Hope Corporation (ASX:NHC)
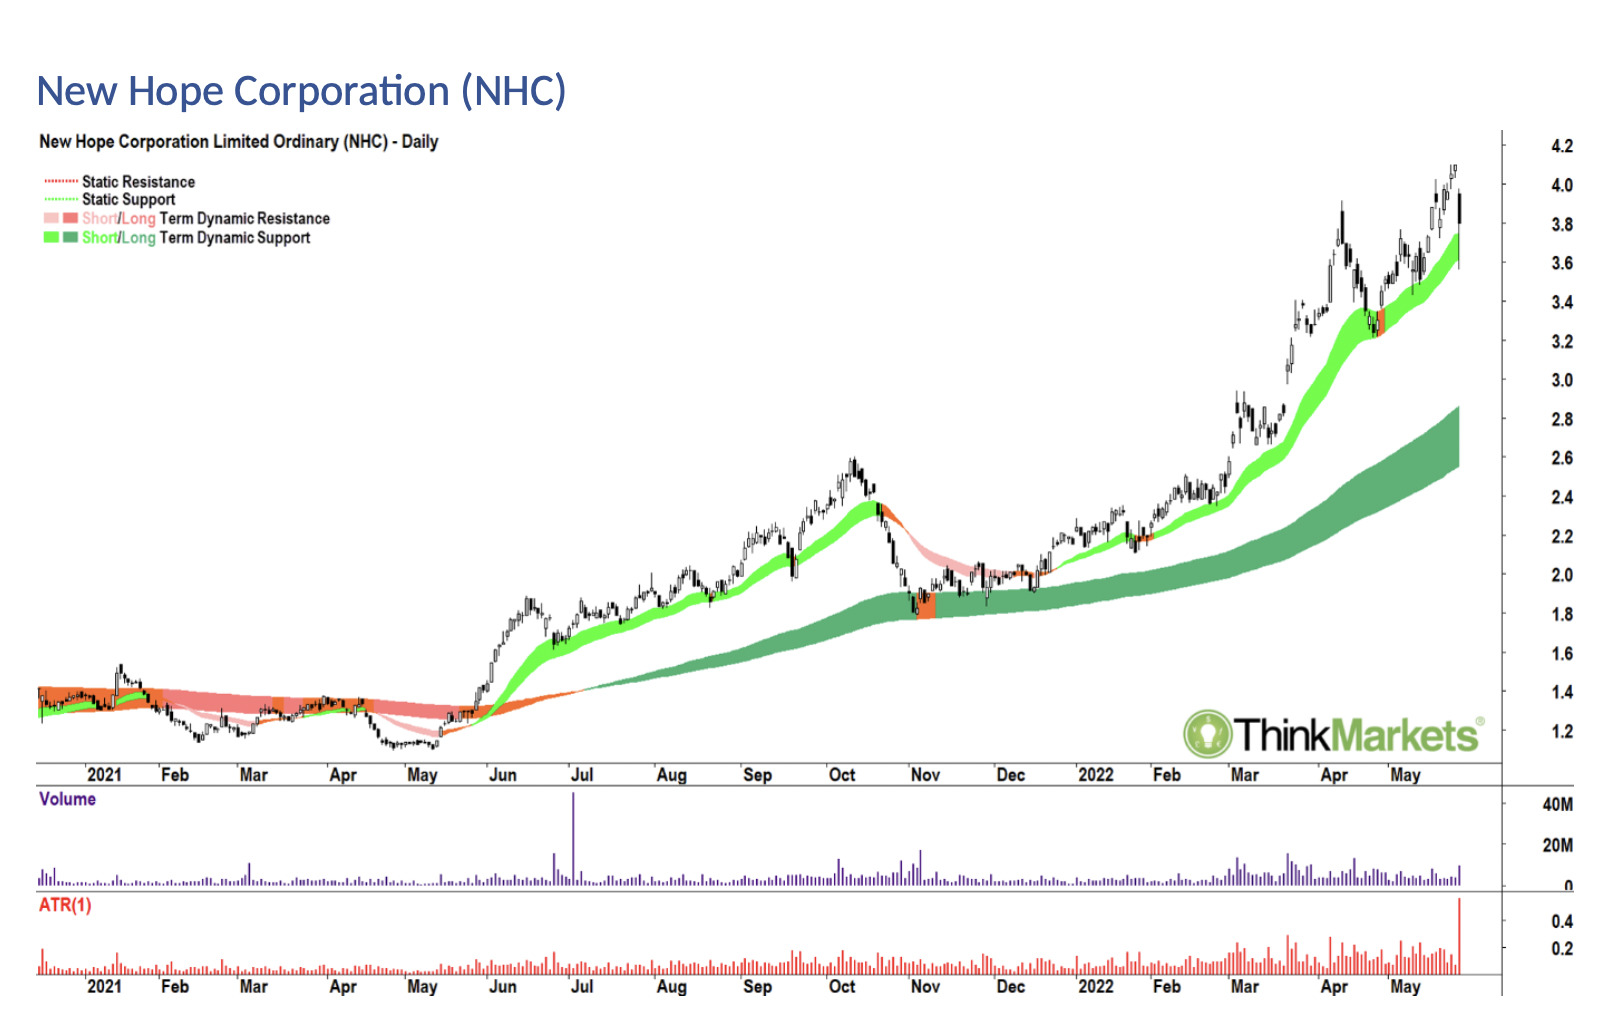
This has been another superstar for us in 2022.
Ditto on fantastic short- and long-term trends. The price action here is much cleaner than in BRL though – at least up until the last candle (26 May).
Prior to 26 May, we can see higher peaks and higher troughs with a predominance of demand-side candles (i.e., large white candles and or large lower shadows).
And then there’s the last candle.
It’s still live at the time of writing, but as it stands, it indicates not everyone is still drinking the same Kool-Aid. There was a focussed, almost sell at any price supply pulse early in the session. This caught the demand-side, which has so clearly been in the system up until today, off guard. The developing lower shadow does suggest demand has regrouped, and a buy the dip mentality remains intact – at least for now.
The candle is still live, but assuming it closes around here or better, it is still a shot across the bow for bulls. It appears some shareholders are getting tetchy – and why not? Quite a few of them are sitting on some nice accumulated profits now. They’ll probably toe the line, hold, and wait to ensure further supply is not forthcoming before acting decisively on the supply side.
But, if we get another supply event (read as: large black candle and or large upper shadow), chances are they will bail.
Large black candles indicate supply (almost) at any cost, and a corresponding demand vacuum – despite the temptation of suddenly lower prices. Don’t ignore them!
View: Neutral due to 26 May candle, bullish on a close above 4.10, bearish on confirming signal or close below 3.43.
Terracom (TER)
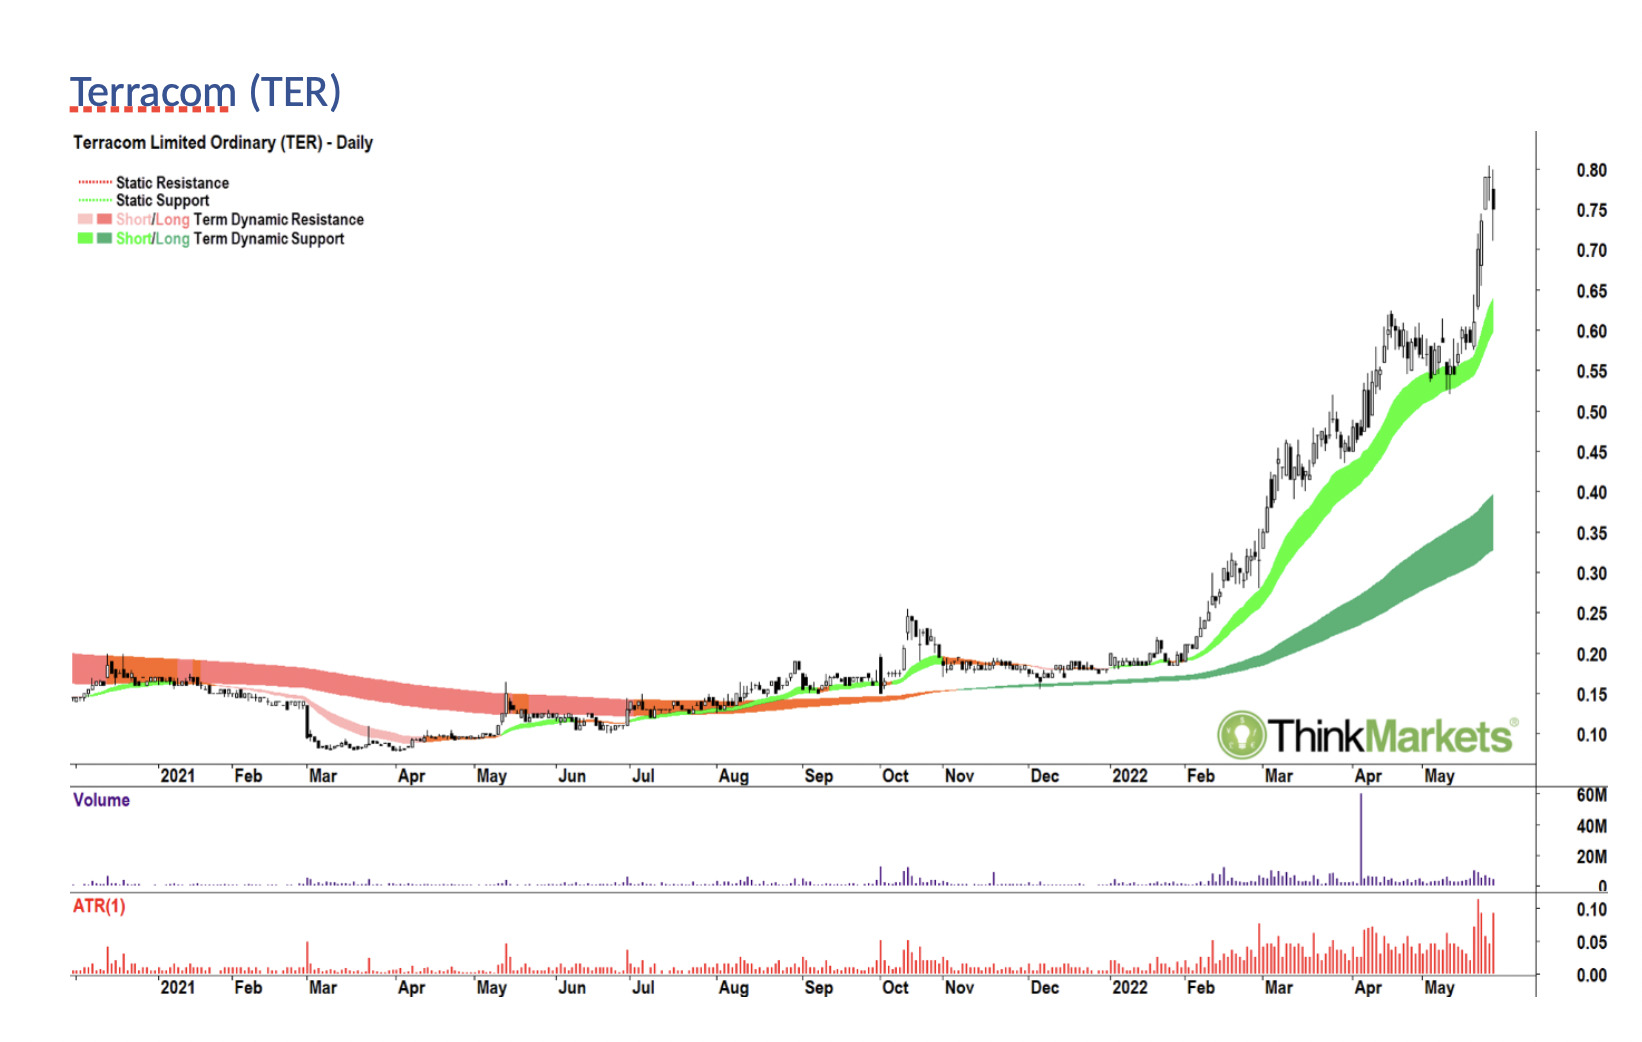
This isn’t the first time I’ve discussed Terracom. Mrs Capolingua says I do it in my sleep, so I simply couldn’t leave it out of my list of coal sector favourites.
Terracom is the picture of excess demand. As in, print this chart out and stick it on your wall!
It’s exactly how you want the stocks in your portfolio to look.
The weird thing is, so many investors look at a chart like this and say: “It’s too high to buy. I can’t buy that, as soon as I do it’s going to crash!”. Maybe… or maybe the market doesn’t care what you think or do and the stock is going up regardless! One of these two options is more likely.
What I can say about the Terracom chart is you will only get a chart like this if investors with cash are falling over themselves to buy, and simultaneously, existing shareholders are holding on for more. So, when you think of it this way, it appears the people with money think Terracom is going up, and Terracom shareholders think it’s going up.
If you don’t, it says more about you than them. Yeah, yeah, that can change the instant you get in, but that’s why Munehisa Homma, a Japanese rice trader, came up with the concept of candlestick charting around about the 1700s.
Anyways, Terracom still looks great. Today’s “mini-wobble” has got my attention though, but I don’t think it’s anything too sinister just yet. Again, the candle is live at the time of writing, so this may change.
The only factor preventing me from calling this an ‘outright buy’ here is the fact the last move has propelled it so far from the short-term trend ribbon. Ideally, I like to buy on pullbacks to this ribbon with some nice candles. So, it’s still a ‘hold it if you’ve got it’, and ‘watch it for a buy if you don’t’.
View: Bullish until a close below 0.575.
Whitehaven Coal (ASX:WHC)

Another stalwart in my feature charts, and you can clearly see why. It has been the most fantastic and consistent trend since January.
The short-term trend ribbon appears to be supporting the trend very well, and there have been numerous demand-side candles (i.e., large white candles and orange candles with large lower shadows) occurring in this zone. Price action up until the 26 May candle looks solid, and I really respect the work it did to overcome supply at the psychological $5 round number.
Assuming the 26 May candle closes at or above the current price, as with the others, I’m prepared to give this one the benefit of the doubt based upon its broader trends. But, like the others, Whitehaven Coal will now receive extra attention with respect to any further supply signals.
All uptrends eventually bend, and all uptrends eventually end. If we’re lucky, they bend a bit before they end – and we can use those cues to exit with some great profits.
However, the goal of a trend follower is to ride the trend until the evidence is clear the trend is changing.
By doing so, hopefully we extract as much profit from a trend as possible.
View: Neutral due to 26 May candle, bullish on a close above 5.35, bearish on a close below 4.60.
Yancoal (ASX:YAL)
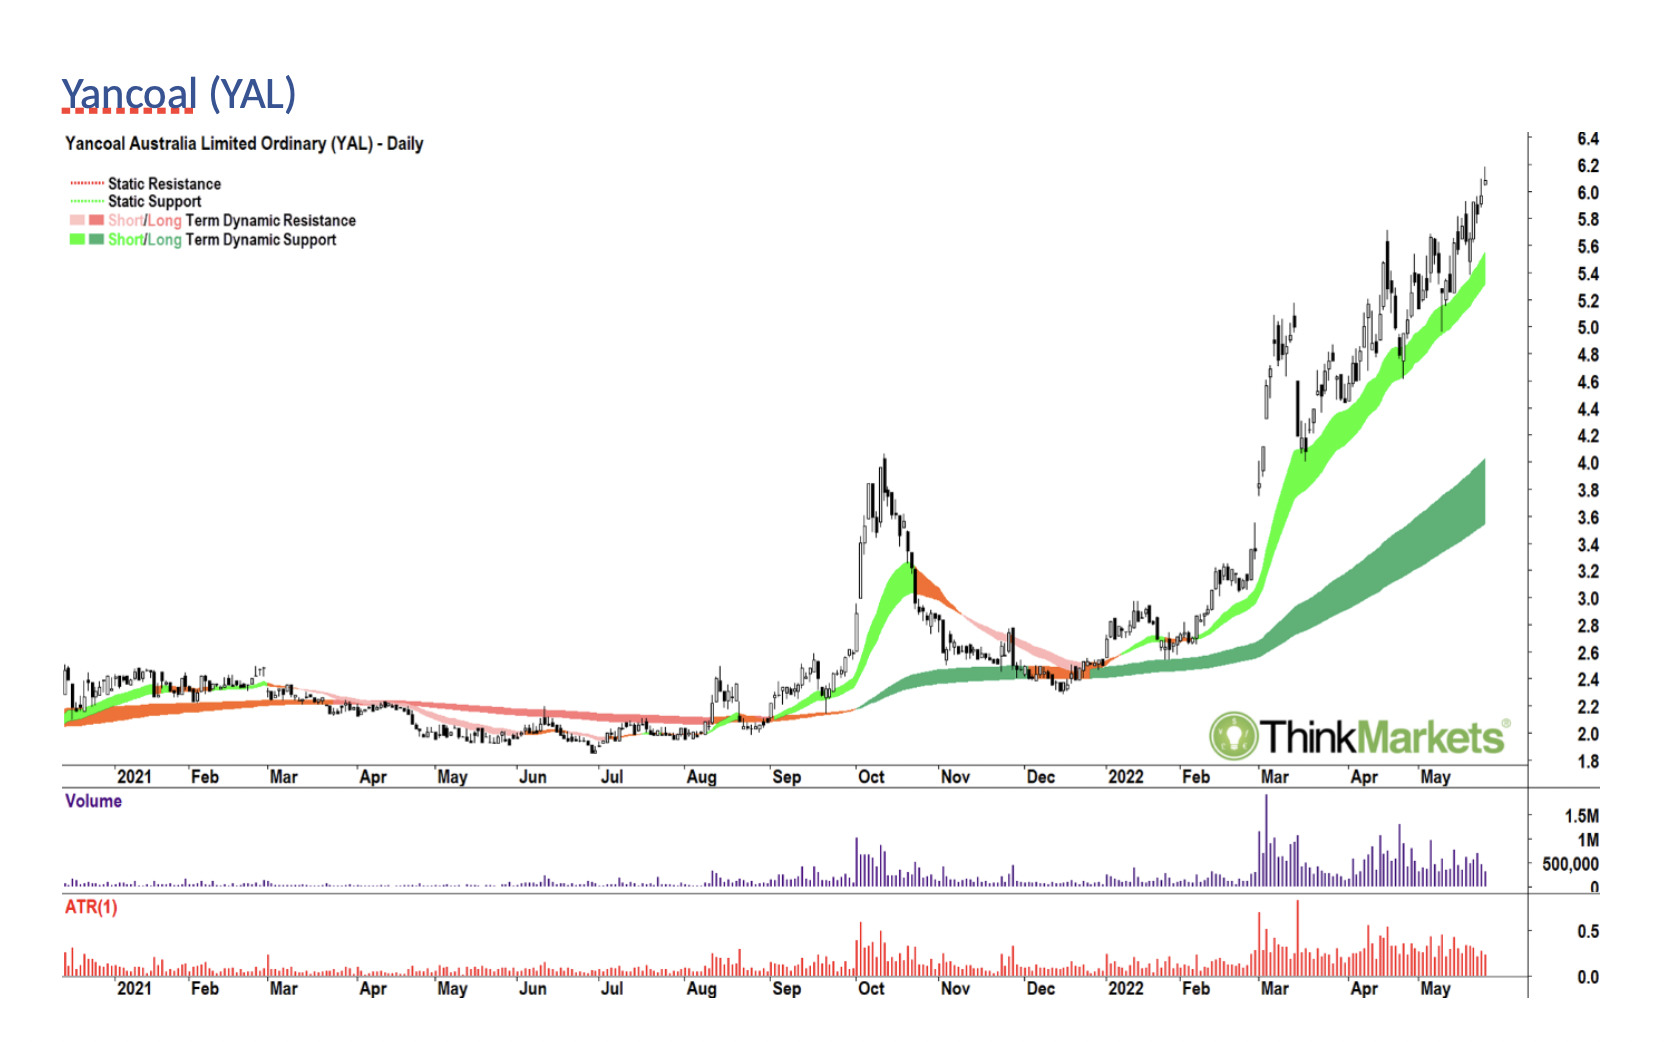
I think it’s fair to say most of my clients hadn’t even heard of Yancoal until I started showing them its chart.
It’s an Australian-based coal producer majority owned by Hong Kong listed Yankuang (which itself is backed by Chinese interests). And in breaking news, Thursday, Yancoal placed itself in a trading halt due to what it calls the “an announcement relating to a potential material transaction”.
Most likely, Yankuang is going to mop up the rest of Yancoal it doesn’t own. Either way, the chart is still an excellent example of all the things you want to see. The overall trends, price action, and particularly the candles on 19-20 May are very strong here.
View: Bullish until a close below 5.38
The views, information, or opinions expressed in the interviews in this article are solely those of the interviewees and do not represent the views of Stockhead. Stockhead does not provide, endorse or otherwise assume responsibility for any financial product advice contained in this article.
Related Topics
Related Stories


UNLOCK INSIGHTS
Discover the untold stories of emerging ASX stocks.
Daily news and expert analysis, it's free to subscribe.
By proceeding, you confirm you understand that we handle personal information in accordance with our Privacy Policy.


