Carl Capolingua gets charty for Stockhead, and bullish on energy stocks – welcome to The Candlestick

Picture: Getty Images
Carl Capolingua is one of Australia’s leading technical analysts. Admired for his unique style – reminiscent of the Brutalist-school of price action-based trend tracking – Capo has been honing his art over some 30 years of investing, advising, and managing funds.
Every week in The Candlestick, Carl will be plotting, for your sheer madness, a data-trove of unlevened technical analysis covering markets globally, then drilling it down remorselessly-locally.
Here is his picture. (It’s good to put a face to this sort of work)

First iteration: Top Down, Bottom Up
Even for these rodeo-like times, it was a wild ride for markets last week, with stocks, bonds and industrial commodities all heading south. About the only things heading north weren’t very helpful for investors at all…energy prices, volatility, and interest rates.
Let’s break it down from the top:
US 10-year T-Note yields:
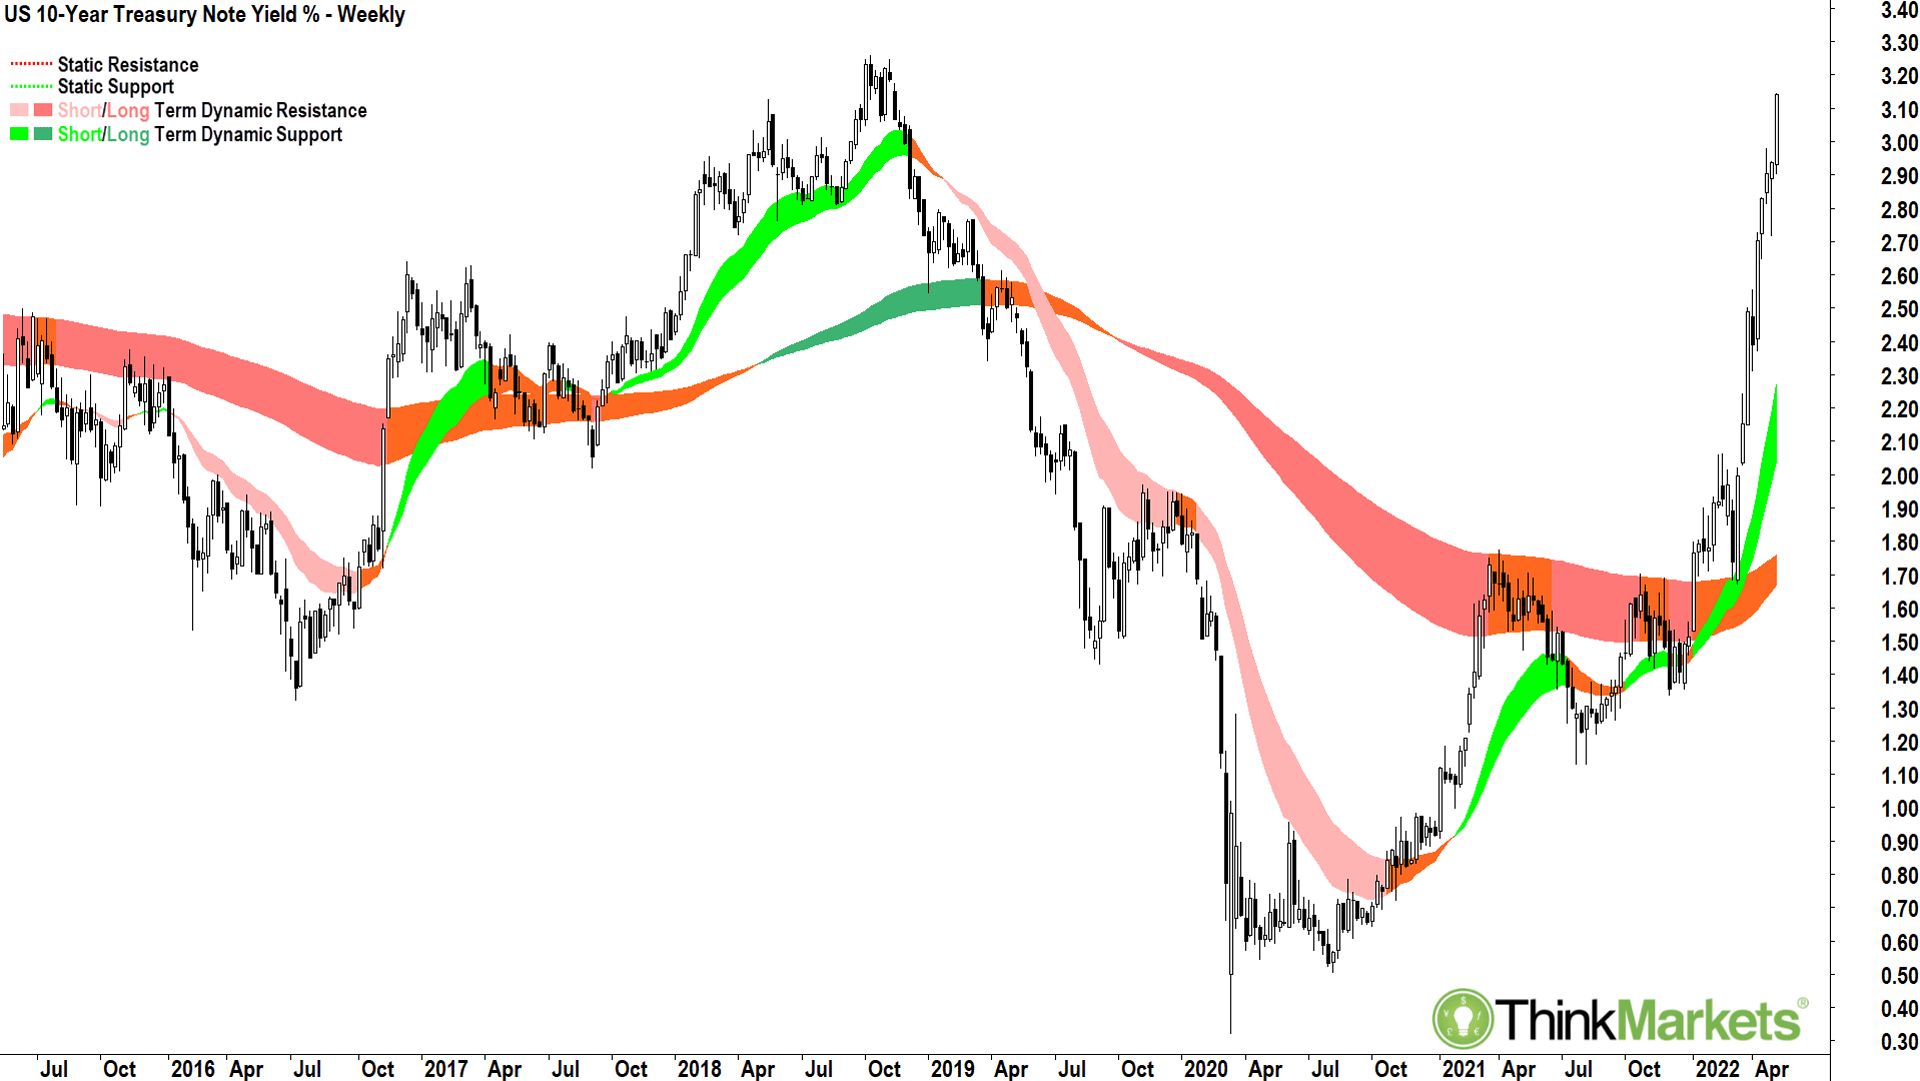
US 10-year T-Note yields have spiked since US Federal Reserve Chairman Jerome Powell’s reappointment in November last year.
Immediately following his ascension to USFRC, JP flipped from dove to hawk, and markets have not been the same since.
The yield on the US 10-year T-Notes was around 1.5% just before JP’s flip, and in the space of just six months, they have more than doubled to close out last week at 3.14%.
Such dislocations in markets are rare, and hence the massive impact on assets which struggle under higher rates (we’ll talk about those in a sec!).
The key to the above chart is “normalisation”.
Markets always knew interest rates couldn’t remain at their ultra-low emergency settings triggered by the COVID-19 pandemic. But markets also thought (based upon central bank commentary) we’d have potentially a couple years or so more of it.
Most didn’t foresee the massive inflation pulse that COVID-19 brought as supply chains ground to a crawl – and therefore central banks’ almost unanimous on-the-spot pivot.
It appears fighting inflation is non-negotiable. The good news is – regardless of the concept’s subjective nature – we’re now pretty close to “normal”.
For the sake of math, anything between 2.5% and 3.5% has been the general ‘norm’ over the last 20 years, and over the last 10, it’s probably closer to 2.5% to 3.0%.
So if anything, we’re closer to the top of the range than the bottom. Still, if this were the chart of a stock, as a trend follower, you’d be buying it with your ears pinned back! So, there’s potentially more pain ahead for markets in the short-term.
We need to see a meaningful top set here if we are to see markets stabilise.
Nasdaq Composite Index
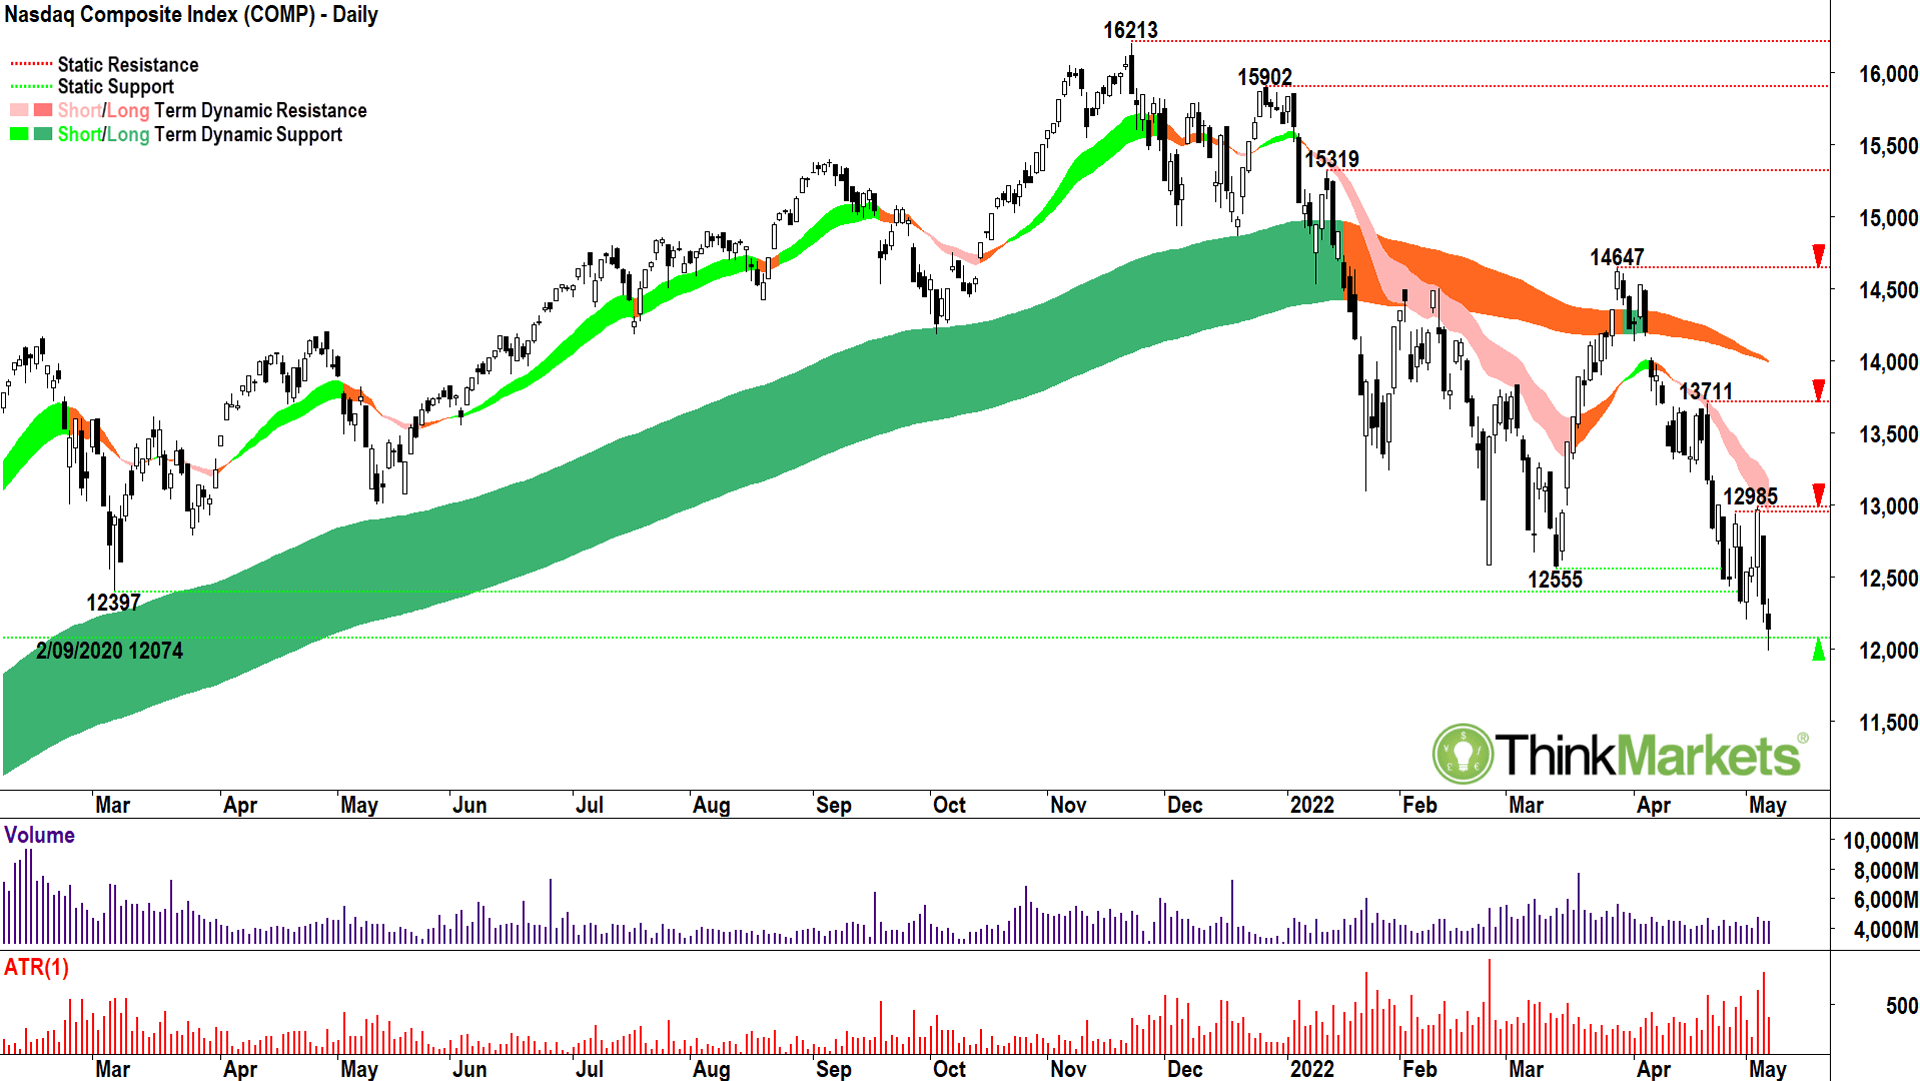
The high-PE, long duration tech stocks of the Nasdaq were always going to suffer the most at the hands of a surge in interest rates.
Their earnings are way out, their valuations are sky-high (or at least they were at the November all time highs!), and often, their debt levels are elevated. As rates rise, so too does the cost to an investor of hanging on without any return until the distant future.
It’s no coincidence the Nasdaq’s all time high is November 22, 2021 – the same day JP was reappointed as Fed Chairman!
The trends on the Nasdaq Composite are set to the downside. The short-term trend (light pink zone) is well established and is developing a nice little track record of impeding upward price moves.
The long-term trend (orange zone) has turned lower and has also resisted attempts to reclaim it.
Price action is clear lower peaks and lower troughs. Candles are skewed to the supply-side. This chart shows the bull market in US tech stocks ended in January, but a new bear market is potentially beginning.
I see some support at 12074, but if it goes, there’s not a great deal until 10519. View: Bearish, sell rallies until a close above 4 May high of 12985.
COPPER LME
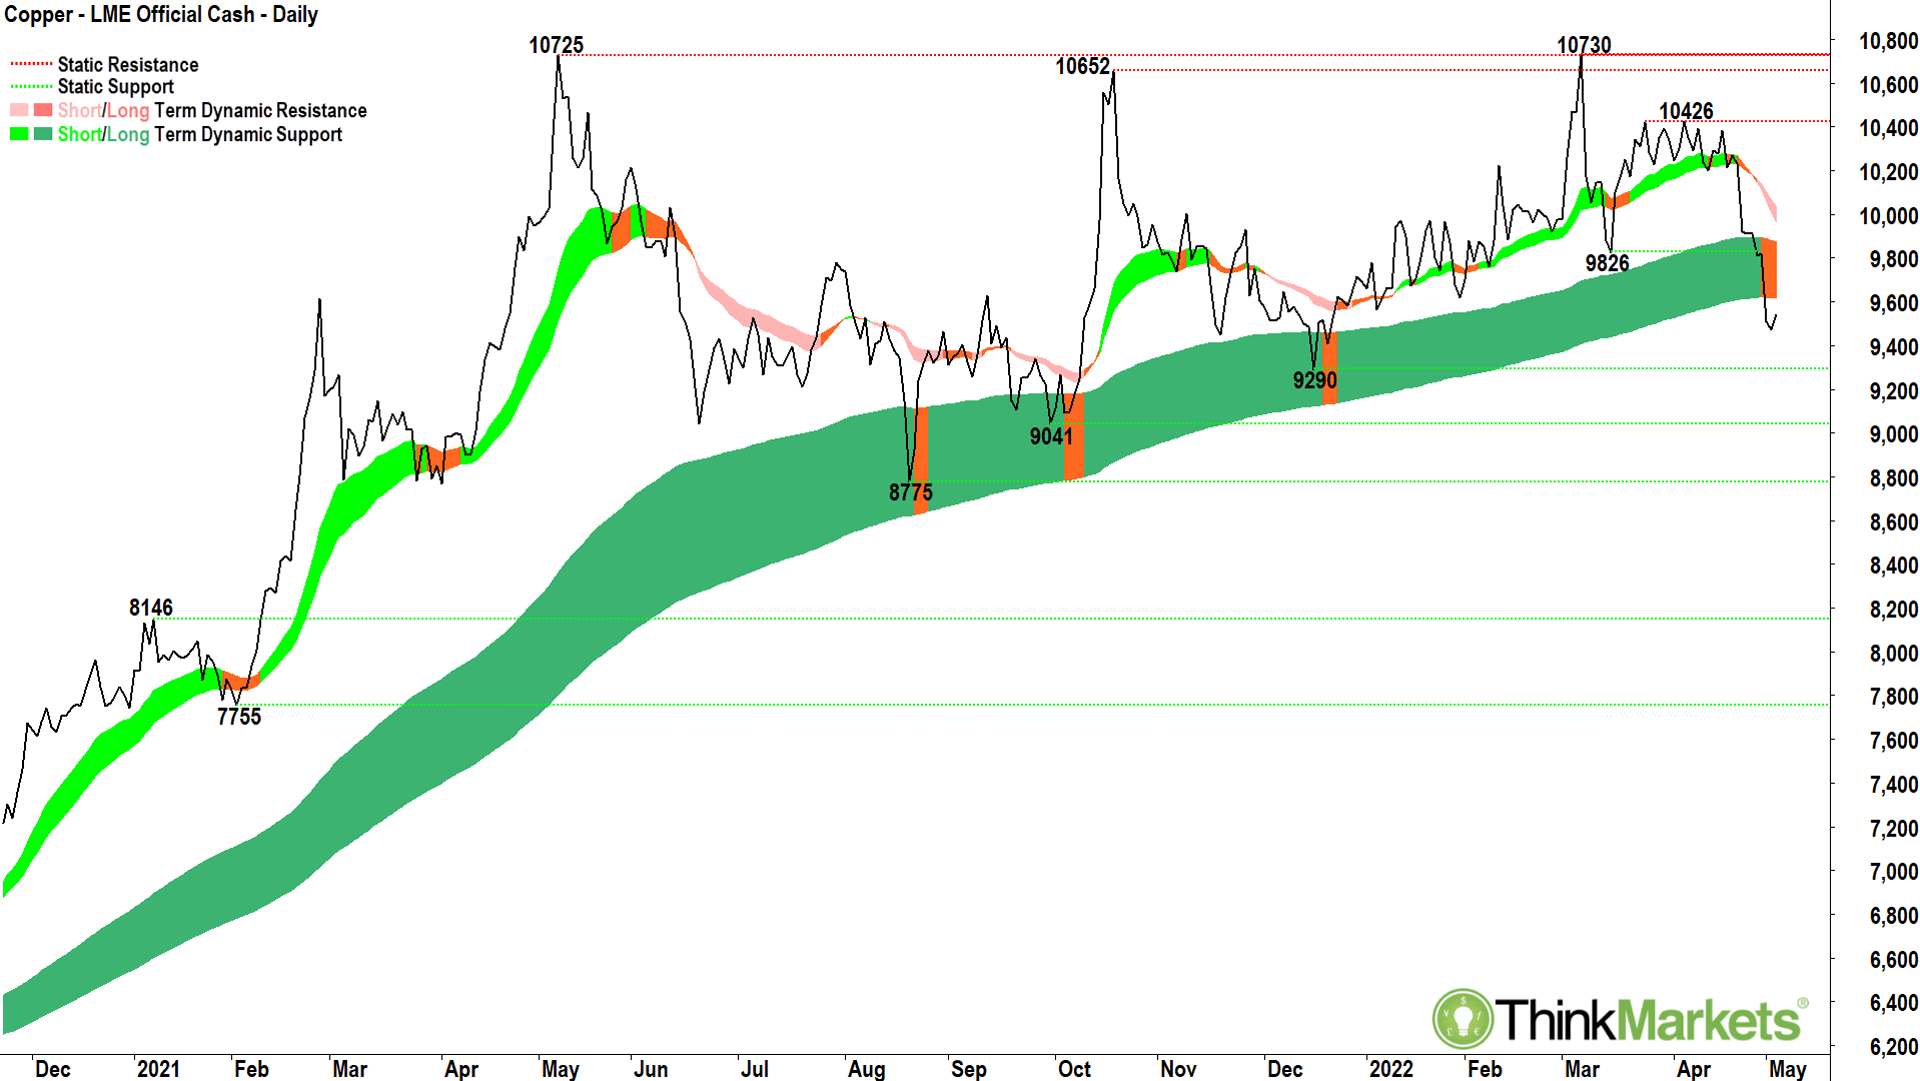
Just very quickly on a few commodities here… I’m growing concerned about the next couple of charts – and each has a major impact on our local resources stocks.
LME Copper, above, appears to have broken below its long-term uptrend zone (dark green zone).
Not great for copper bulls (and copper stocks like BHP, RIO et. al!). But at least it does give us an imminent trigger to act.
If we see a peak (could be series of peaks) set in the long-term uptrend zone, the zone is swinging from dynamic support to dynamic resistance.
Check the Nasdaq Composite chart around Jan-Feb this year. That’s how long-term trends change – it could be happening in LME Copper. If we can reclaim the long-term uptrend zone without too much trouble, then all is good again. View: Neutral, awaiting price action signals in long term trend zone.
Singapore Iron Ore 62%
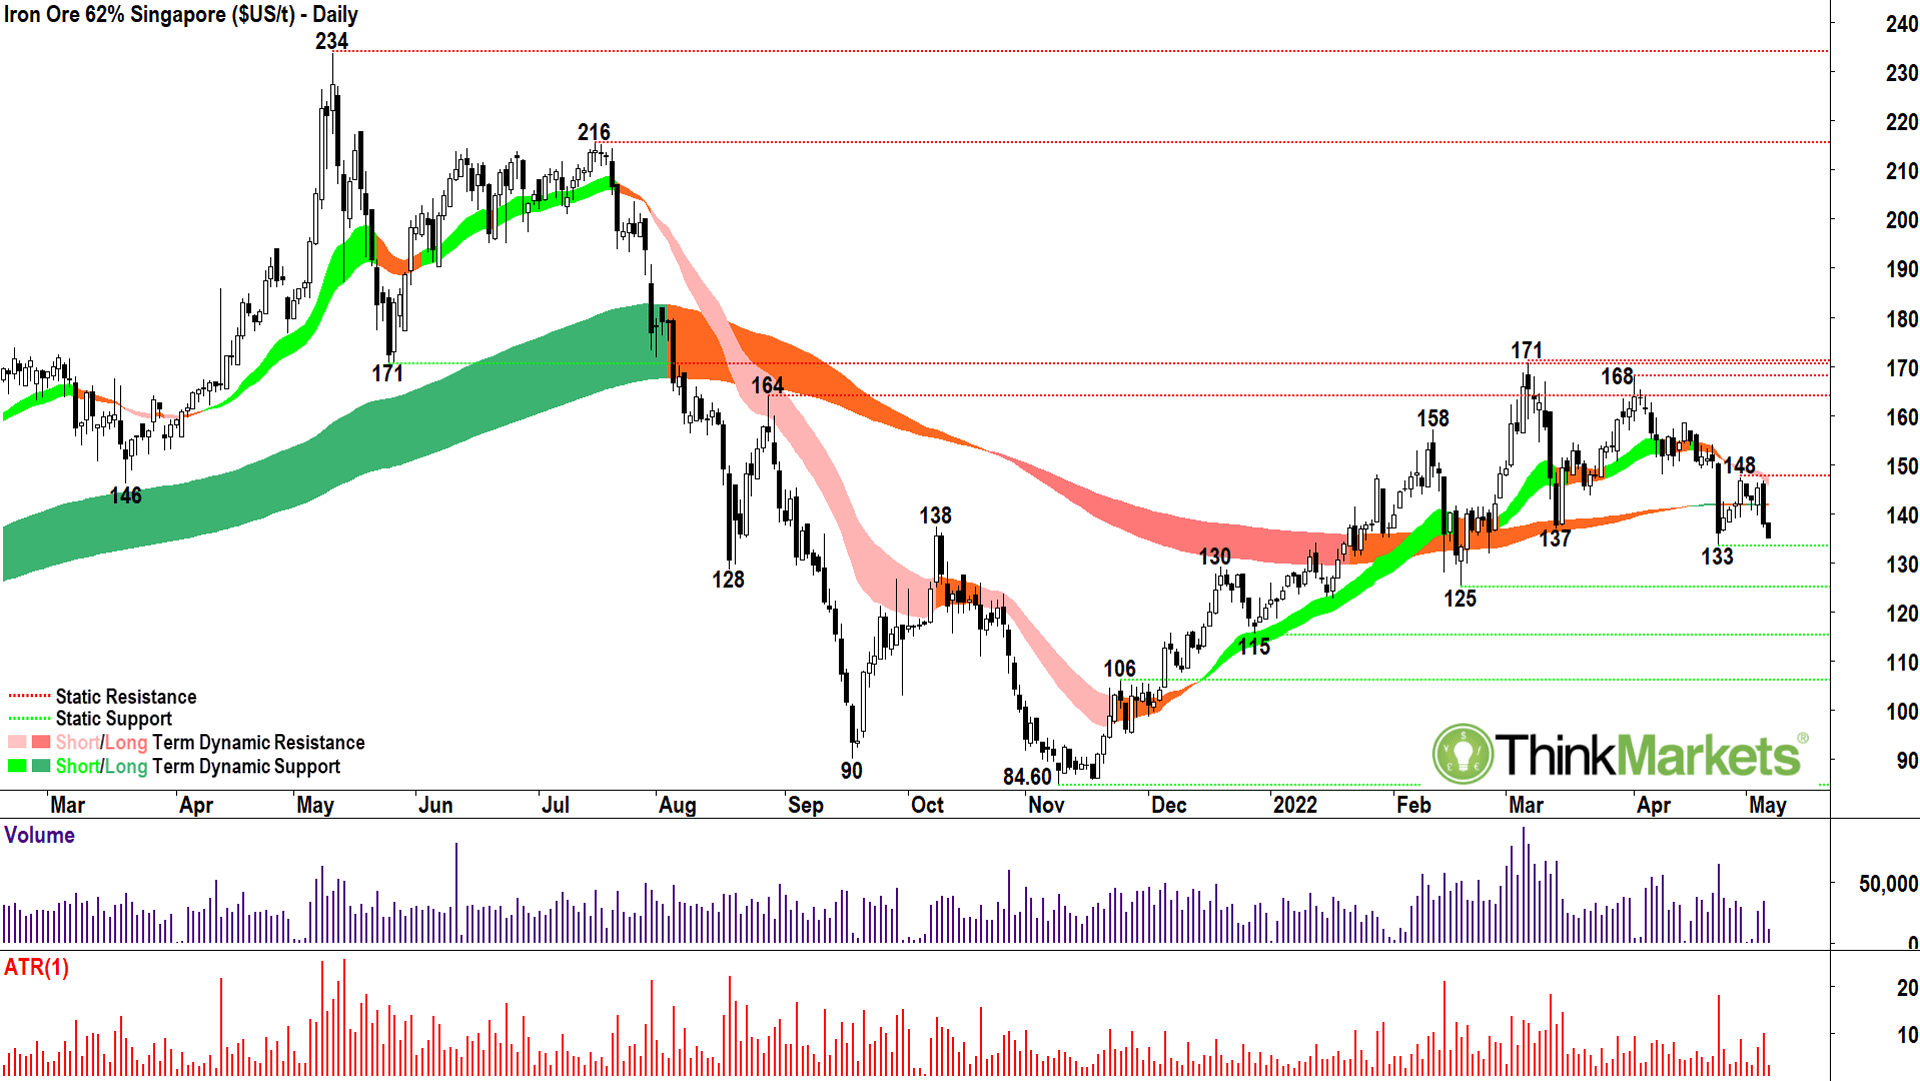
Also, I’m growing increasingly concerned about Singapore Iron Ore 62%. It’s slipping. The trends and the price action are showing the tell-tale signs of distribution. A crack of the 24 April low of 133 could be curtains for the mini-bull run that’s followed the July 2021-Nov 2021 rout. View: Neutral until a close below 24 April low of 133 (bearish) or a close above 28 April high of 148 (bullish).
S&PASX200
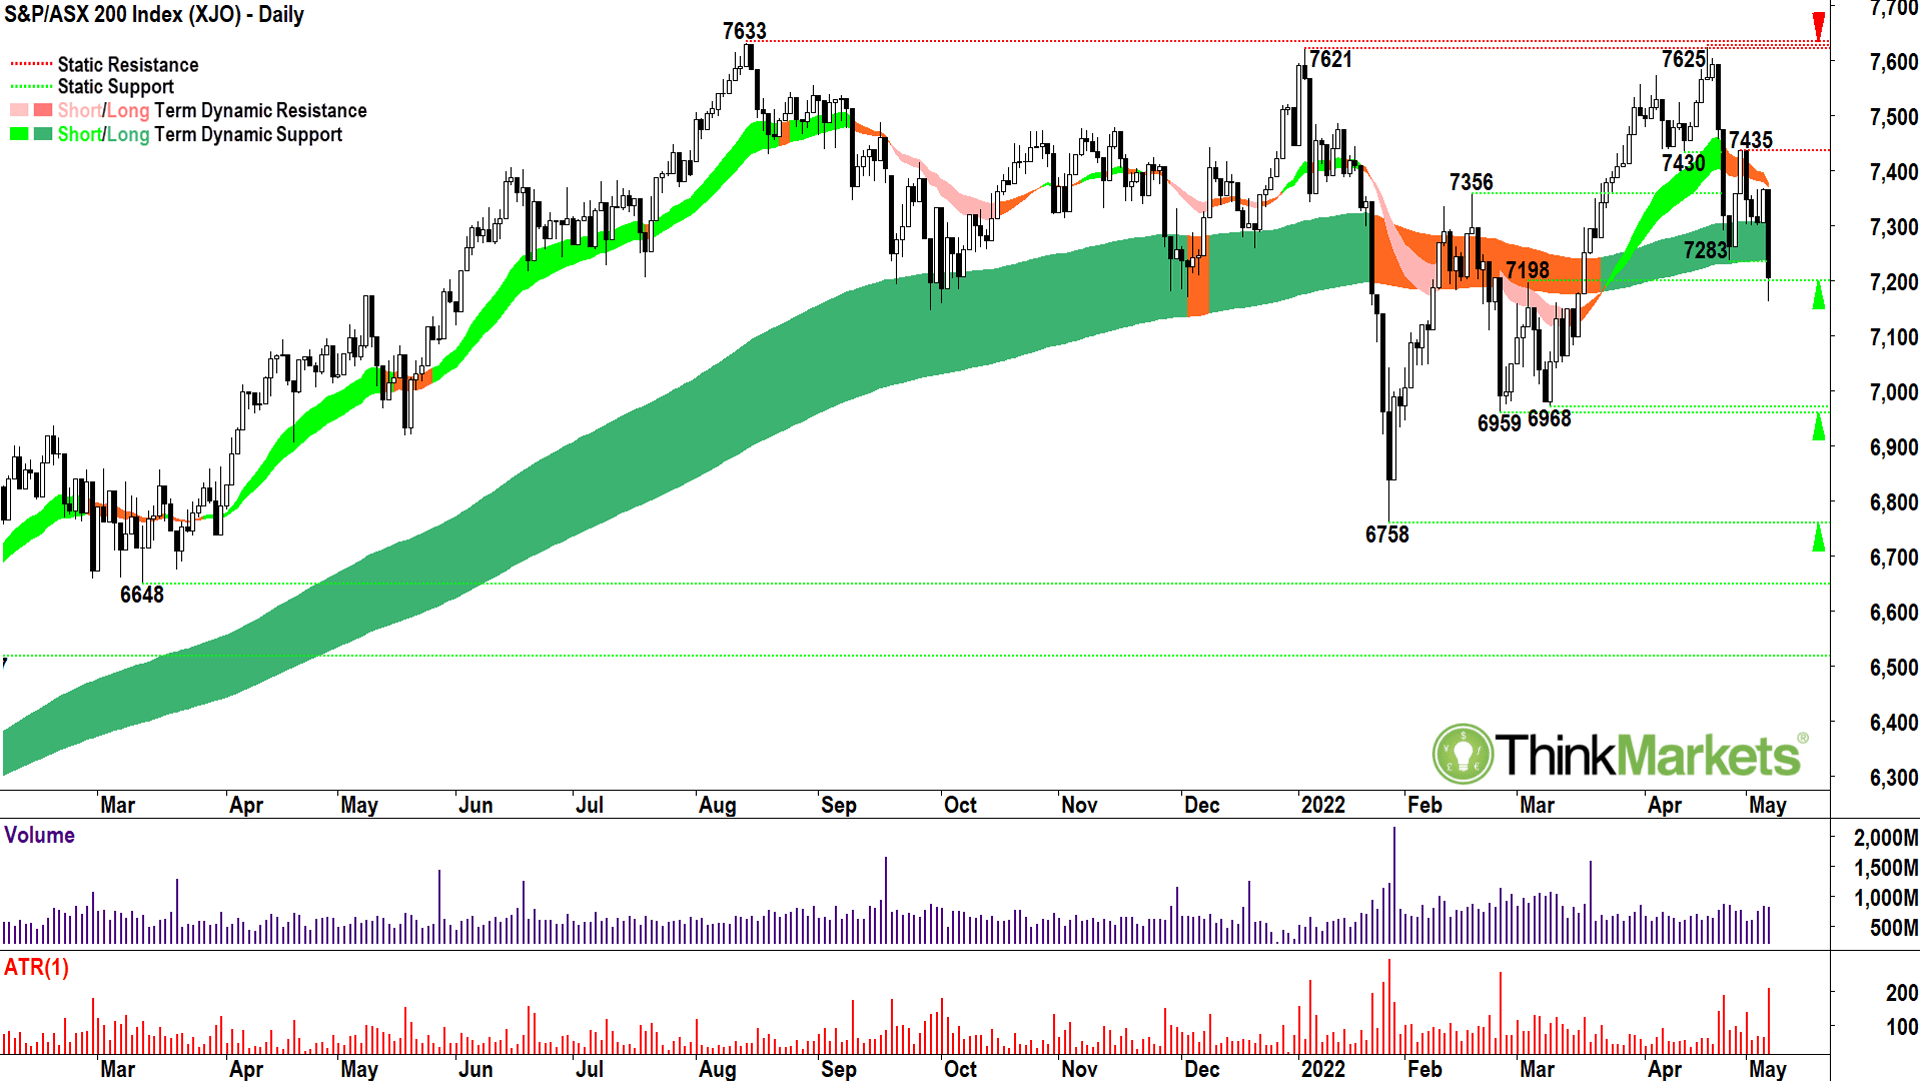
Bringing it back home now. The benchmark S&PASX200.
It’s mostly dodged the big sell-off in other major global industries – largely due to our banking and resources stocks.
But as we’ve seen in the charts above, the prices of at least a couple key commodities are slipping under the weight of those ongoing China COVID-19 lockdowns.
The price action is back to lower peaks and lower troughs, and the propensity for large black candles hardly inspires confidence.
The close on Friday below the long-term uptrend zone is also significantly concerning.
Much like copper, though, this item does give us some impending clues as to where we’re going next because, if we see further supply-side candles in that zone, we’re likely headed lower.
If we can reclaim the zone quickly, preferably with some nice long white candles/long lower shadows, we’re still in the Bull. Until a move one way or the other, best to sit on your hands!
View: Neutral, until a close below 3 March high of 7198 (bearish) or a close above 29 April high of 7435 (bullish).
Rio Tinto (ASX:RIO)
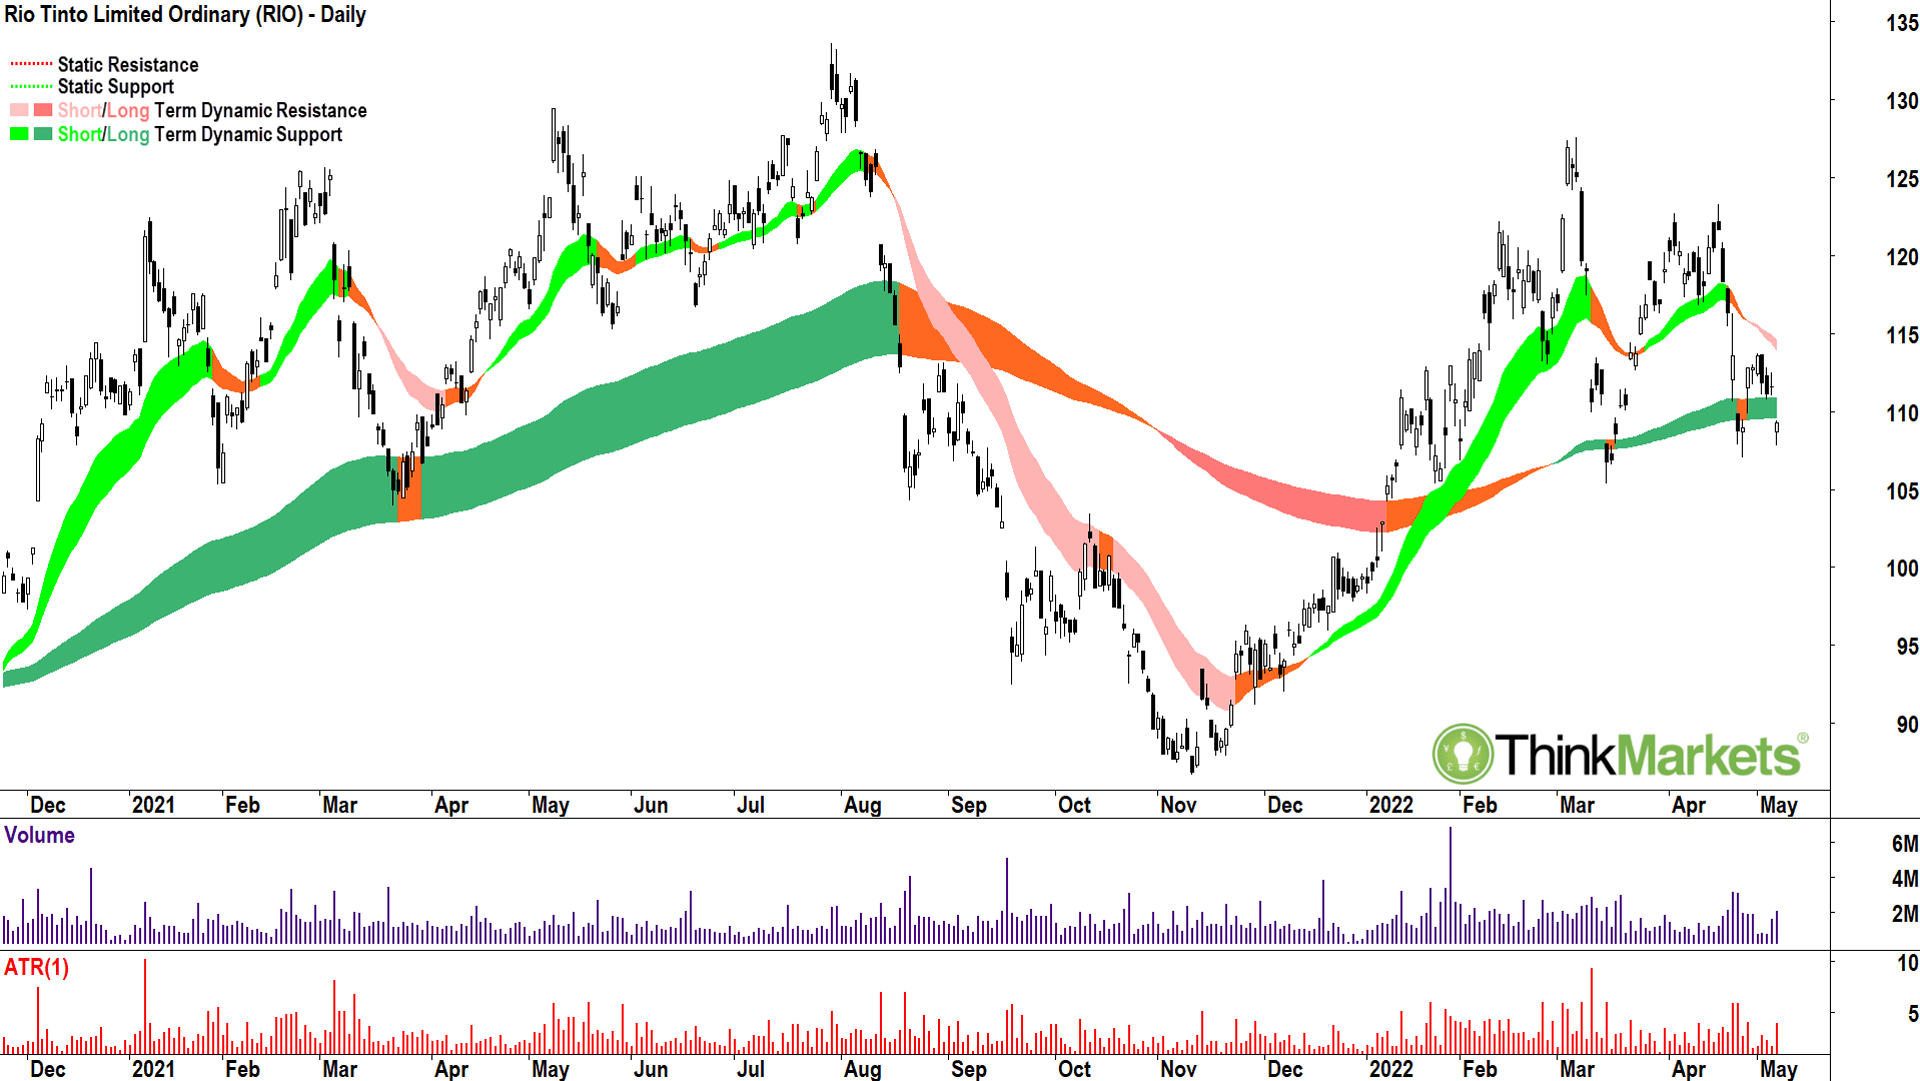
We can’t mention concerns about copper and iron ore without looking at one of the ASX mining majors.
Today I thought RIO looked the more concerning of the BHP-RIO pair.
I call the the pattern which starts at the 7 March high of 127.63 and extends to current the “bouncing ball pattern”.
Imagine you bounce a ball on a tabletop. Each time it hits the table it bounces a little lower. At some stage it misses the end of the table, and wooshka!
I would suggest the end of RIO’s table is the 15 March low of 105.35. Below this it could get ugly. Price action and short-term trends are also bearish, and disturbingly, we’re now below the long-term uptrend zone.
View: Bearish, until a close above 2 May high of 113.80.
Ok, I’ve depressed the hell out of you right? Sorry, not sorry. This is how trend following works.
And this is a musical version of the above expression in the context of a musical about the six wives of Henry VIII:
It has also trended, I suppose. But for now, just take a break and let your mind vacate:
Thank you, England.
Now, back to the ‘sticks…
You try and measure the trends: direction, strength, sustainability; and stay on the right side of them.
Never fall in love with a stock (or any chart), they’re just cattle. You’re just trading cattle here. When a farmer sends another truck of cattle off to market, she’s not crying into her custard as they go (oh, Betsy, Daisy, Lucinda…how I’ll miss you…whatever will I do without you!). Nope, it’s off you go, see you at Coles and where do I collect my money? Cold hearted, blood-thirsty even!? You betcha!
And this is how you need to treat your investing.
Let’s get stock specific.
Terracom (ASX:TER)
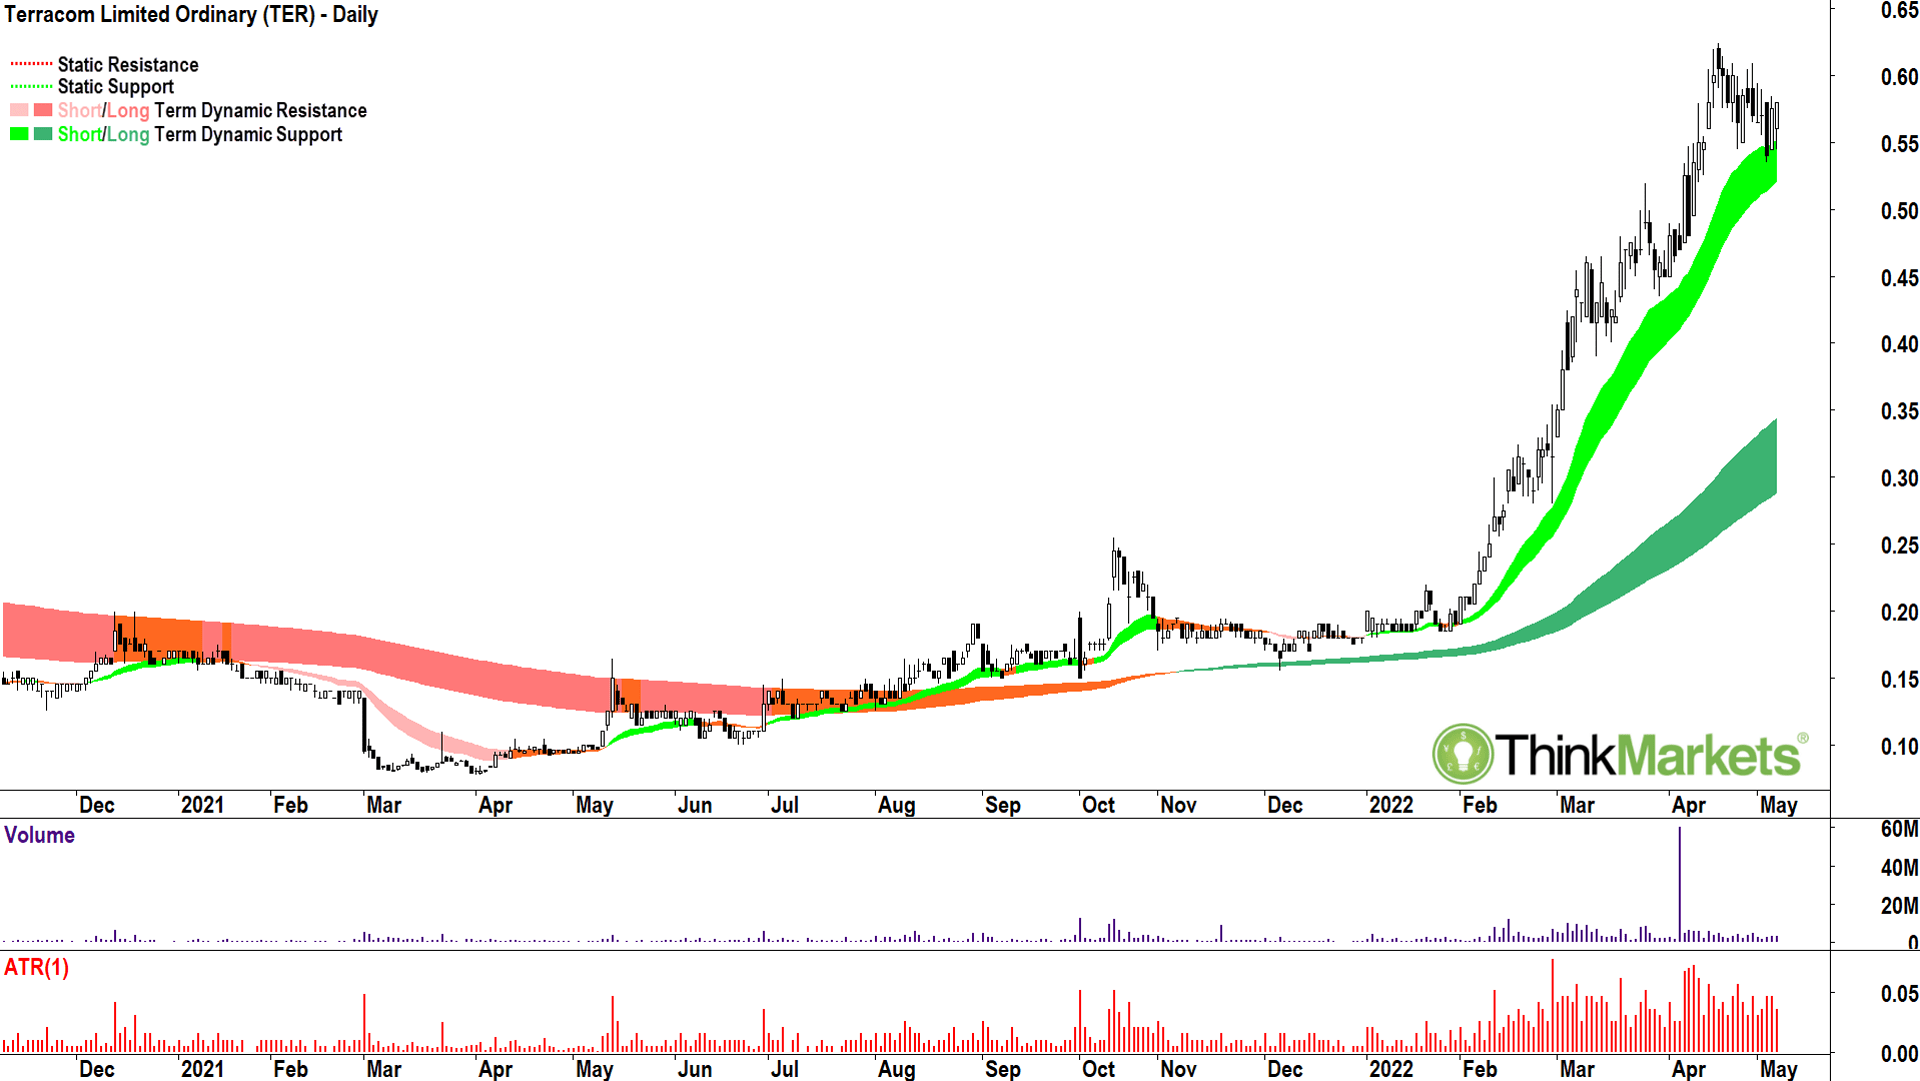
Anyways. It’s not all bad news for ASX stocks.
Just as say, crude oil appears to be re-establishing its short-term uptrend. The local energy sector still looks solid.
Terracom (ASX:TER) is a coal producer with operations in South Africa and Australia. It’s literally doing the same thing except now that is printing cash thanks to some absurdly spiking coal prices.
I feel it looks cheap here with respect to the valuation, and its appears to back this up – it’s a picture of excess demand. I’d be happy to continue to own TER whilst the short-term tend (light green zone) remains intact. View: Bullish, until a close below 4 May low of 0.535.
Worley (ASX:WOR)
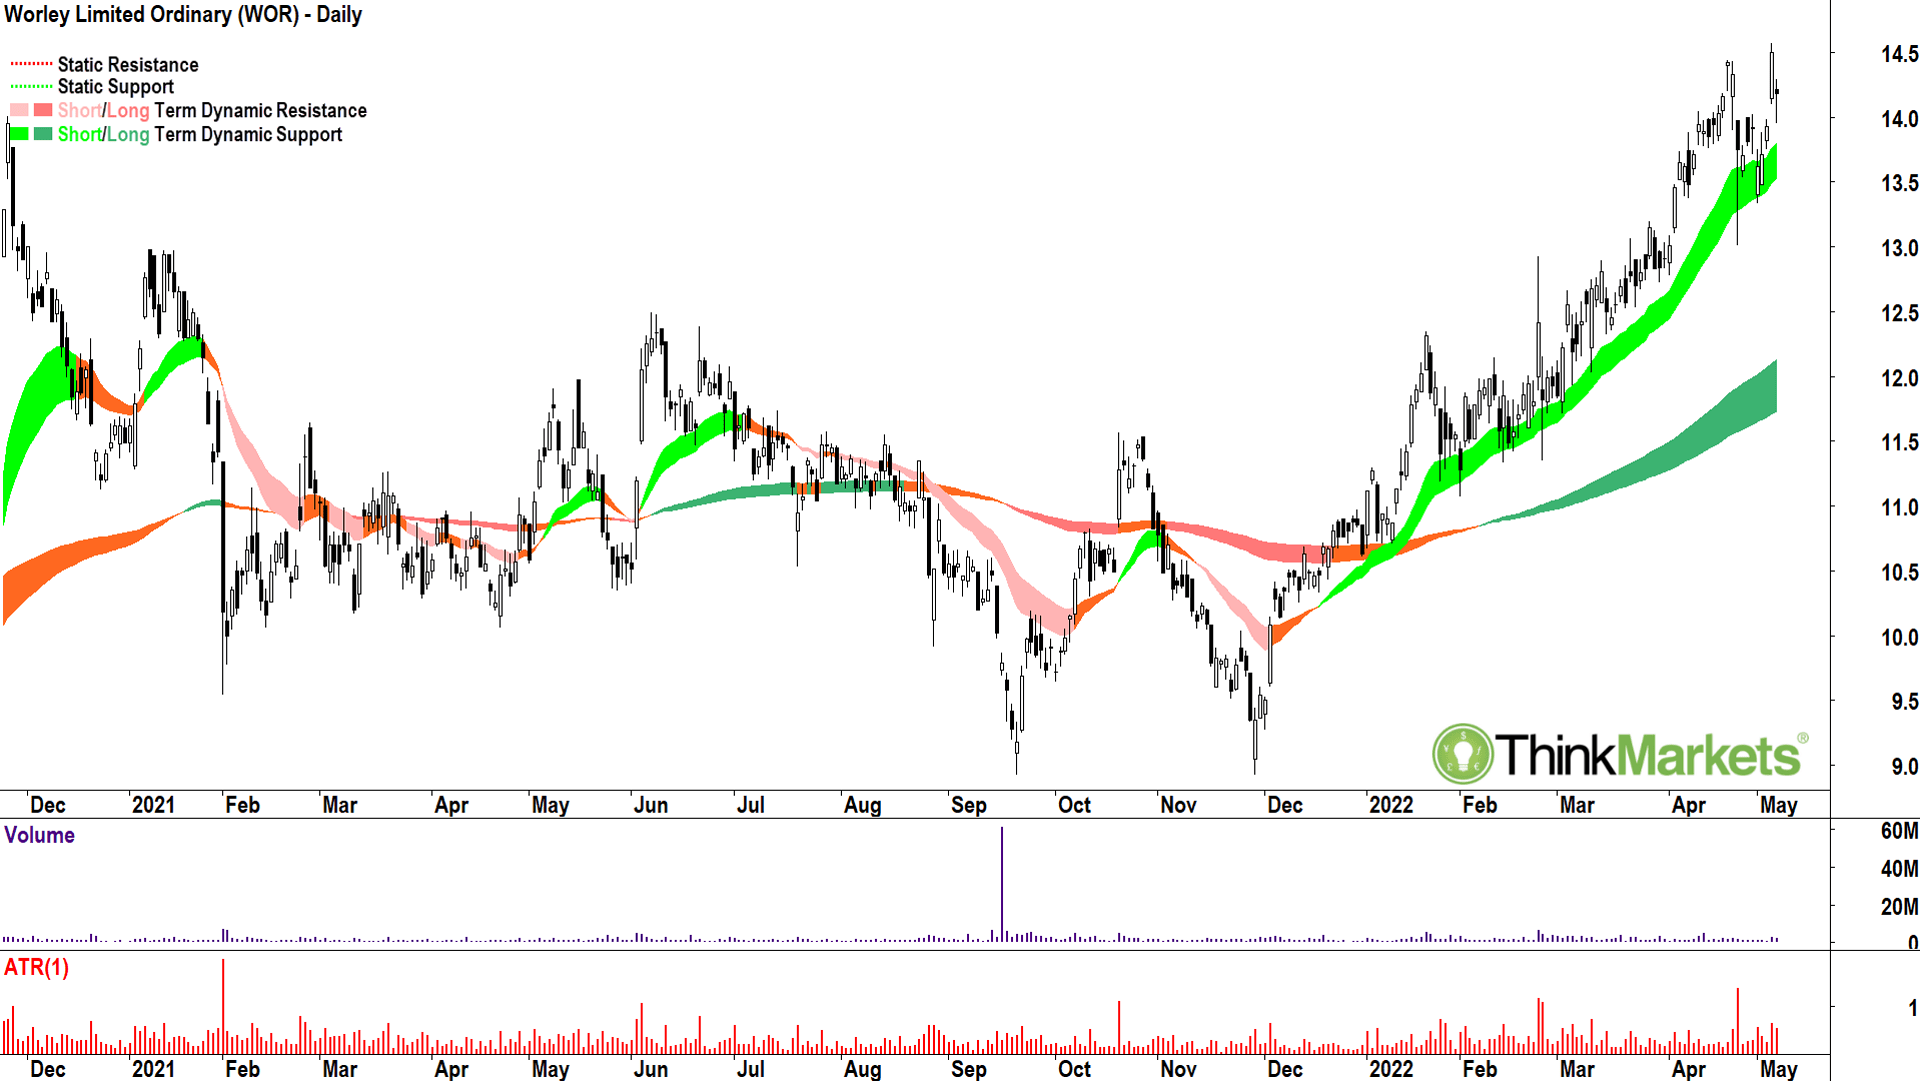
Another stock which is likely to do well in an environment of strong energy prices is engineering contractor Worley (ASX:WOR).
The chart is developing a nice bottom-left-top-right feel about it. Price action and candles are solidly skewed to the demand side. The 25 November, 2020 high of $14.01 has been taken out and we’ve seen the price pullback to, hold, and launch off this level. It points to concerted buy-the-dip activity.
View: Bullish, until a close below 2 May low of 13.33.
Beach Energy (ASX:BPT)

Finally, Beach Energy (ASX:BPT) appears to be warming up.
Its chart is not overtly bullish like TER or WOR, but I do like the consolidation pattern put in place since the 7 March high of 1.77.
The candles are improving, and the price action is just sliding back to higher peaks and higher troughs. Clearly a break above 1.77 is the key, but I’d be happy with a little accumulation in advance, and as long as we keep closing above Friday’s low of 1.61. View: Bullish, until a close below 6 May low of 1.61.
Carl out.
Carl Capolingua is Market Analyst at ThinkMarkets, For more of Carl’s work watch him tweet here.
The views, information, or opinions expressed in the interviews in this article are solely those of the interviewees and do not represent the views of Stockhead. Stockhead does not provide, endorse or otherwise assume responsibility for any financial product advice contained in this article.
Related Stories


UNLOCK INSIGHTS
Discover the untold stories of emerging ASX stocks.
Daily news and expert analysis, it's free to subscribe.
By proceeding, you confirm you understand that we handle personal information in accordance with our Privacy Policy.


