
Mining
Monsters of Rock: Gold bears pick forecasts above US$2000 for the 'first time ever'

Mining
Monsters of Rock: Rio quiet on whether it wants to join BHP's copper race for Anglo American

Mining
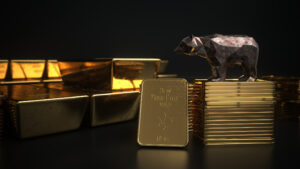
Pic: via Getty
Mining
Our Gold Digger column wraps all the news driving ASX stocks with exposure to precious metals.
Consumer demand for gold in Australia increased from 7.2 tonnes in Q1 2021 to 8.9t in Q1 2022, a year-on-year (YoY) increase of 24%, the World Gold Council says.
This overall demand was driven by a 19% YoY increase in bar and coin demand, as well as an estimated 40% increase y-o-y in jewellery demand.
While positive consumer sentiment is a key driver of retail demand for gold (like jewellery), investors often use physical gold bars as a diversifier and a hedge, World Gold Council APAC CEO Andrew Naylor says.
“[This] is increasingly important in an economy where many have strong exposures to property and pro-cyclical assets,” he says.
Net buying by central banks more than doubled from the previous quarter, adding over 84t to official gold reserves during Q1 2022, dominated by countries such as Egypt and Turkey.
While 29% lower than Q1 2021, central banks continue to value gold’s performance during times of uncertainty, WGC senior analyst Louise Street says.
“The first quarter of 2022 has been a turbulent one, marked by geopolitical crises, supply chain difficulties and surging inflation,” she says.
“These global events and market conditions have solidified gold’s status as a safehaven holding, not just for investors but also for retail consumers thanks to its unique position as a dual-natured asset class.
“Given the current market dynamics, investment demand is expected to remain strong as the combination of high inflation and heightened geopolitical tensions will likely fuel demand for gold amongst investors.”
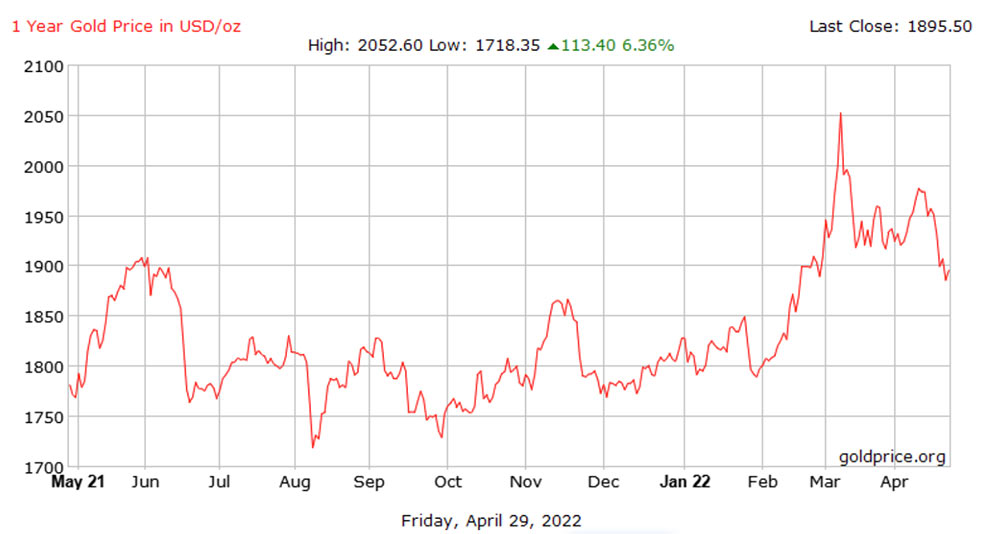
“The rot finally stopped in gold overnight, which tested support at $US1880.00 an ounce, as well as its 100-day moving average, before rallying to close 0.45% higher at $US1904.25 an ounce,” OANDA senior analyst Jeffrey Halley said Friday arvo.
Significantly, it achieved that even as the US Dollar continued to rally in New York markets.
When the value of the US dollar increases against other global currencies, the price of gold often falls in USD terms.
In Asia, pre-weekend hedging and a weaker US Dollar lifted it another 0.53% higher to $1904.60 an ounce.
“There is a definite sense that gold is benefitting from haven flows in the past 12 hours,” Halley says.
“That makes complete sense given the month-end and weekend risks in the world, as well as regional investors looking to hedge risk over the barrage of holidays next week.
“However, it is too soon to say that gold has completed its medium-term corrective sell-off as nothing breaks bullish traders’ hearts like gold.”
Here’s how ASX-listed gold & silver stocks are performing:
Scroll or swipe to reveal table. Click headings to sort. Best viewed on a laptop
>> Stocks missing from this list? Email [email protected]
| CODE | COMPANY | 1 WEEK RETURN % | 1 MONTH RETURN % | 6 MONTH RETURN % | 1 YEAR RETURN % | PRICE | MARKET CAP |
|---|---|---|---|---|---|---|---|
| ALY | Alchemy Resource Ltd | 100% | 192% | 192% | 159% | 0.038 | $36,189,105.82 |
| SRN | Surefire Rescs NL | 70% | 225% | 200% | 56% | 0.039 | $45,601,204.68 |
| POL | Polymetals Resources | 40% | -3% | 4% | 0% | 0.14 | $5,407,636.41 |
| MEU | Marmota Limited | 25% | 33% | 33% | 36% | 0.06 | $49,984,147.12 |
| SMI | Santana Minerals Ltd | 22% | 59% | 256% | 474% | 0.89 | $106,109,830.40 |
| BMO | Bastion Minerals | 22% | 34% | -25% | 0% | 0.195 | $14,806,205.70 |
| MXR | Maximus Resources | 21% | 46% | 16% | 9% | 0.099 | $27,339,896.05 |
| BMR | Ballymore Resources | 16% | 10% | -8% | 0% | 0.22 | $13,593,444.99 |
| RDN | Raiden Resources Ltd | 15% | 25% | -35% | -48% | 0.015 | $22,692,900.52 |
| PDI | Predictive Disc Ltd | 14% | 17% | 30% | 153% | 0.24 | $309,273,372.90 |
| TG1 | Techgen Metals Ltd | 14% | 45% | -16% | -36% | 0.16 | $5,660,481.58 |
| CTO | Citigold Corp Ltd | 13% | 6% | -10% | -31% | 0.009 | $25,502,931.82 |
| PRS | Prospech Limited | 12% | 15% | -39% | -58% | 0.055 | $3,910,860.30 |
| FEG | Far East Gold | 11% | 46% | 0% | 0% | 0.365 | $46,984,325.85 |
| HMX | Hammer Metals Ltd | 10% | 0% | 83% | 5% | 0.11 | $85,574,435.42 |
| ZAG | Zuleika Gold Ltd | 10% | 6% | 65% | -18% | 0.033 | $15,646,518.75 |
| SFM | Santa Fe Minerals | 9% | -20% | 41% | 20% | 0.12 | $8,738,254.68 |
| SNG | Siren Gold | 9% | 35% | 29% | 38% | 0.44 | $35,886,967.28 |
| TRM | Truscott Mining Corp | 8% | 63% | 63% | 126% | 0.052 | $7,749,018.74 |
| GIB | Gibb River Diamonds | 8% | 7% | -14% | 3% | 0.07 | $13,536,604.48 |
| CXU | Cauldron Energy Ltd | 7% | 14% | -38% | -57% | 0.016 | $8,031,169.16 |
| ICL | Iceni Gold | 6% | 50% | -37% | -25% | 0.165 | $18,588,482.06 |
| CST | Castile Resources | 6% | 13% | -32% | -33% | 0.18 | $36,946,372.39 |
| HAW | Hawthorn Resources | 6% | 147% | 246% | 221% | 0.18 | $56,697,654.21 |
| NML | Navarre Minerals Ltd | 6% | -1% | 9% | -27% | 0.095 | $120,091,149.38 |
| KWR | Kingwest Resources | 6% | 19% | 52% | 65% | 0.19 | $46,164,874.75 |
| PKO | Peako Limited | 6% | 6% | -10% | -51% | 0.019 | $5,552,173.82 |
| TBA | Tombola Gold Ltd | 5% | 62% | 43% | 28% | 0.06 | $45,067,482.22 |
| CAZ | Cazaly Resources | 5% | -2% | -11% | -11% | 0.041 | $14,462,049.93 |
| STK | Strickland Metals | 4% | 27% | -21% | 233% | 0.07 | $88,308,925.50 |
| RGL | Riversgold | 4% | 50% | 236% | 45% | 0.076 | $37,908,300.46 |
| DTR | Dateline Resources | 4% | 33% | 48% | 30% | 0.13 | $55,382,550.00 |
| FFX | Firefinch Ltd | 4% | 15% | 84% | 209% | 1.1125 | $1,139,899,708.27 |
| SVY | Stavely Minerals Ltd | 4% | -6% | -12% | -33% | 0.4 | $109,603,809.84 |
| TNR | Torian Resources Ltd | 4% | 0% | 7% | -34% | 0.029 | $38,859,298.78 |
| AGC | AGC Ltd | 3% | 19% | -5% | -41% | 0.1 | $6,434,091.98 |
| AGC | AGC Ltd | 3% | 19% | -5% | -41% | 0.1 | $6,434,091.98 |
| REZ | Resourc & En Grp Ltd | 2% | 15% | 0% | 18% | 0.047 | $22,991,066.29 |
| HCH | Hot Chili Ltd | 2% | 21% | -33% | -14% | 1.64 | $181,626,744.78 |
| NSM | Northstaw | 2% | -3% | -9% | -23% | 0.29 | $11,436,195.00 |
| G88 | Golden Mile Res Ltd | 2% | 7% | 26% | -33% | 0.063 | $12,646,154.68 |
| BNZ | Benzmining | 1% | 7% | -1% | -14% | 0.695 | $35,529,527.29 |
| MRZ | Mont Royal Resources | 1% | 44% | -5% | 10% | 0.375 | $20,900,863.83 |
| SFR | Sandfire Resources | 1% | -1% | 1% | -7% | 5.69 | $2,386,094,617.26 |
| MKG | Mako Gold | 1% | -1% | -9% | -14% | 0.086 | $31,343,811.36 |
| CPM | Coopermetalslimited | 1% | 11% | 0% | 0% | 0.455 | $12,159,000.00 |
| KNB | Koonenberrygold | 1% | -9% | -44% | 0% | 0.1 | $7,305,390.60 |
| NAG | Nagambie Resources | 1% | -6% | -38% | -29% | 0.0505 | $25,913,880.98 |
| NPM | Newpeak Metals | 0% | 0% | -50% | -50% | 0.001 | $8,849,750.03 |
| GED | Golden Deeps | 0% | 100% | 67% | 67% | 0.02 | $24,258,346.27 |
| DCX | Discovex Res Ltd | 0% | 0% | 45% | 14% | 0.008 | $17,980,648.53 |
| PNX | PNX Metals Limited | 0% | 10% | -29% | -33% | 0.0055 | $24,442,317.94 |
| TMX | Terrain Minerals | 0% | 38% | 22% | 0% | 0.011 | $7,357,610.09 |
| LM8 | Lunnonmetalslimited | 0% | 25% | 156% | 0% | 1.09 | $116,468,694.62 |
| PUA | Peak Minerals Ltd | 0% | 23% | -5% | -36% | 0.016 | $16,661,932.02 |
| SMS | Starmineralslimited | 0% | 0% | -2% | 0% | 0.2 | $5,250,000.00 |
| PRX | Prodigy Gold NL | 0% | -8% | -32% | -48% | 0.023 | $13,400,434.94 |
| CWX | Carawine Resources | 0% | 0% | 5% | -29% | 0.21 | $28,945,212.87 |
| SIH | Sihayo Gold Limited | 0% | -40% | -67% | -80% | 0.003 | $11,056,384.24 |
| AWV | Anova Metals Ltd | 0% | 0% | -38% | -46% | 0.013 | $19,475,224.60 |
| TIE | Tietto Minerals | 0% | -13% | 26% | 79% | 0.51 | $410,968,474.29 |
| TRY | Troy Resources Ltd | 0% | 0% | 0% | -47% | 0.037 | $31,631,563.33 |
| KGM | Kalnorth Gold Ltd | 0% | 0% | 0% | 0% | 0.013 | $11,625,120.78 |
| CGN | Crater Gold Min Ltd | 0% | 0% | 0% | -15% | 0.017 | $21,063,473.65 |
| LNY | Laneway Res Ltd | 0% | -17% | 4% | -13% | 0.005 | $31,510,082.05 |
| TSC | Twenty Seven Co. Ltd | 0% | 0% | -20% | -27% | 0.004 | $10,643,255.62 |
| GUL | Gullewa Limited | 0% | 8% | 0% | -1% | 0.081 | $15,420,221.10 |
| G50 | Gold50Limited | 0% | 6% | 4% | 0% | 0.25 | $14,004,500.25 |
| ADV | Ardiden Ltd | 0% | 0% | 27% | 8% | 0.014 | $37,356,694.98 |
| AGS | Alliance Resources | 0% | -3% | -8% | 5% | 0.175 | $40,953,448.03 |
| DDD | 3D Resources Limited | 0% | 0% | -13% | -30% | 0.0035 | $14,631,302.32 |
| RMX | Red Mount Min Ltd | 0% | 0% | -14% | -5% | 0.0095 | $14,781,274.72 |
| XTC | Xantippe Res Ltd | 0% | 100% | 250% | 460% | 0.014 | $107,302,746.59 |
| PGD | Peregrine Gold | 0% | 4% | 24% | 79% | 0.51 | $19,526,201.19 |
| FG1 | Flynngold | 0% | 14% | 3% | 0% | 0.16 | $8,968,547.00 |
| HMG | Hamelingoldlimited | 0% | 3% | 0% | 0% | 0.155 | $17,050,000.00 |
| PF1 | Pathfinder Resources | 0% | 25% | 68% | 108% | 0.5 | $26,560,505.00 |
| SI6 | SI6 Metals Limited | 0% | 0% | -17% | -23% | 0.01 | $14,281,439.85 |
| NWM | Norwest Minerals | 0% | -10% | -31% | -21% | 0.055 | $10,836,443.22 |
| IDA | Indiana Resources | 0% | 16% | 14% | -20% | 0.066 | $28,574,703.37 |
| CAI | Calidus Resources | 0% | 1% | 71% | 167% | 1 | $394,251,067.84 |
| MAT | Matsa Resources | 0% | 4% | 18% | 4% | 0.071 | $23,691,004.92 |
| BDC | Bardoc Gold Ltd | 0% | -5% | 42% | 22% | 0.52 | $154,075,451.40 |
| PRU | Perseus Mining Ltd | 0% | 2% | 23% | 68% | 1.975 | $2,357,070,733.77 |
| SPQ | Superior Resources | 0% | -7% | 208% | 233% | 0.04 | $66,347,596.30 |
| DLC | Delecta Limited | 0% | 0% | -27% | 83% | 0.011 | $13,253,995.76 |
| AWJ | Auric Mining | 0% | -3% | -36% | -54% | 0.086 | $4,821,964.70 |
| ANL | Amani Gold Ltd | 0% | 0% | -33% | 0% | 0.002 | $34,940,161.69 |
| MAU | Magnetic Resources | -1% | -1% | -14% | -9% | 1.43 | $325,297,087.55 |
| BRV | Big River Gold Ltd | -1% | 20% | 37% | -11% | 0.3425 | $74,924,275.10 |
| RMS | Ramelius Resources | -1% | -3% | -5% | -7% | 1.505 | $1,288,066,886.87 |
| MI6 | Minerals260Limited | -1% | -9% | 4% | 0% | 0.48 | $103,400,000.00 |
| AAU | Antilles Gold Ltd | -1% | -10% | -15% | -30% | 0.066 | $22,971,322.47 |
| KAI | Kairos Minerals Ltd | -2% | 5% | -5% | 2% | 0.0295 | $56,900,711.24 |
| BYH | Bryah Resources Ltd | -2% | 19% | 4% | -21% | 0.057 | $13,120,016.15 |
| VAN | Vango Mining Ltd | -2% | 77% | -15% | -26% | 0.053 | $68,036,632.13 |
| A8G | Australasian Metals | -2% | 8% | -26% | 0% | 0.495 | $19,281,837.12 |
| RSG | Resolute Mining | -2% | 7% | -16% | -24% | 0.3525 | $364,297,401.60 |
| MVL | Marvel Gold Limited | -2% | 0% | -36% | -8% | 0.045 | $31,694,371.65 |
| ZNC | Zenith Minerals Ltd | -2% | 24% | 87% | 38% | 0.44 | $137,561,662.00 |
| DRE | Dreadnought Resources Ltd | -2% | 8% | 16% | 126% | 0.043 | $119,224,709.14 |
| BNR | Bulletin Res Ltd | -2% | 2% | 200% | 207% | 0.21 | $62,368,486.56 |
| RED | Red 5 Limited | -2% | 11% | 63% | 118% | 0.415 | $989,671,473.84 |
| ADN | Andromeda Metals Ltd | -2% | -43% | -43% | -53% | 0.1025 | $310,423,509.90 |
| NMR | Native Mineral Res | -2% | -13% | -16% | -31% | 0.2 | $8,384,403.60 |
| VMC | Venus Metals Cor Ltd | -3% | 8% | 3% | 5% | 0.195 | $28,704,949.77 |
| WAF | West African Res Ltd | -3% | 3% | 5% | 45% | 1.33 | $1,312,023,219.76 |
| MRR | Minrex Resources Ltd | -3% | 17% | 250% | 233% | 0.07 | $62,144,918.52 |
| KSN | Kingston Resources | -3% | 6% | -17% | -17% | 0.175 | $72,234,651.83 |
| TLM | Talisman Mining | -3% | 0% | 21% | 25% | 0.175 | $31,915,714.49 |
| AZS | Azure Minerals | -3% | -4% | -21% | 6% | 0.335 | $102,542,787.93 |
| LEX | Lefroy Exploration | -3% | -3% | -25% | -73% | 0.33 | $48,138,640.44 |
| AQI | Alicanto Min Ltd | -3% | -16% | -35% | -19% | 0.097 | $36,357,793.62 |
| S2R | S2 Resources | -3% | -9% | 90% | -3% | 0.16 | $55,238,102.53 |
| ADT | Adriatic Metals | -3% | 2% | -12% | 16% | 2.52 | $504,577,925.50 |
| OGC | OceanaGold Corp. | -3% | 15% | 35% | 57% | 3.43 | $223,585,567.86 |
| AAR | Anglo Australian | -3% | -16% | 11% | -20% | 0.092 | $54,848,489.99 |
| PGO | Pacgold | -3% | 8% | 139% | 0% | 0.75 | $35,122,438.71 |
| SLZ | Sultan Resources Ltd | -3% | -3% | -17% | -17% | 0.15 | $12,909,080.30 |
| TAM | Tanami Gold NL | -3% | 5% | -17% | -22% | 0.06 | $70,505,822.76 |
| AME | Alto Metals Limited | -3% | -3% | -11% | -4% | 0.089 | $48,579,451.10 |
| FAU | First Au Ltd | -3% | 26% | 32% | -31% | 0.0145 | $12,133,664.24 |
| GSN | Great Southern | -3% | 16% | -12% | 5% | 0.058 | $30,877,290.99 |
| ARN | Aldoro Resources | -3% | -10% | -42% | -26% | 0.285 | $27,283,736.98 |
| QML | Qmines Limited | -3% | 2% | -22% | 0% | 0.28 | $18,626,070.12 |
| BGL | Bellevue Gold Ltd | -4% | -3% | 13% | 3% | 0.955 | $954,031,223.98 |
| NAE | New Age Exploration | -4% | 4% | 23% | -36% | 0.0135 | $18,666,685.83 |
| RXL | Rox Resources | -4% | 3% | 4% | -29% | 0.395 | $65,042,264.60 |
| GSM | Golden State Mining | -4% | -6% | -27% | -43% | 0.077 | $8,097,542.86 |
| AUT | Auteco Minerals | -4% | -3% | -4% | -14% | 0.075 | $144,711,151.76 |
| FML | Focus Minerals Ltd | -4% | -6% | -16% | -20% | 0.235 | $68,774,074.80 |
| GBZ | GBM Rsources Ltd | -4% | -8% | -21% | 0% | 0.115 | $62,151,081.24 |
| NES | Nelson Resources. | -4% | 10% | -42% | -70% | 0.023 | $6,474,537.61 |
| CDR | Codrus Minerals Ltd | -4% | -13% | -35% | 0% | 0.091 | $3,640,000.00 |
| OKU | Oklo Resources Ltd | -4% | -2% | -36% | -40% | 0.09 | $45,404,683.11 |
| CHZ | Chesser Resources | -4% | -12% | -31% | -19% | 0.11 | $64,363,542.10 |
| CEL | Challenger Exp Ltd | -4% | -3% | 14% | -11% | 0.32 | $324,765,178.08 |
| TCG | Turaco Gold Limited | -5% | -5% | -31% | 54% | 0.1 | $41,060,800.22 |
| ICG | Inca Minerals Ltd | -5% | -33% | -20% | -20% | 0.1 | $48,155,992.70 |
| AXE | Archer Materials | -5% | -2% | -41% | 1% | 0.87 | $218,123,142.16 |
| AM7 | Arcadia Minerals | -5% | 14% | 54% | 0% | 0.285 | $10,672,712.50 |
| BTR | Brightstar Resources | -5% | -5% | -49% | -19% | 0.0285 | $17,465,243.46 |
| RND | Rand Mining Ltd | -5% | -5% | -5% | -1% | 1.5 | $85,313,941.50 |
| GCY | Gascoyne Res Ltd | -5% | -5% | -40% | -47% | 0.28 | $112,869,873.25 |
| HAV | Havilah Resources | -5% | -8% | -5% | -20% | 0.175 | $54,216,182.48 |
| CHN | Chalice Mining Ltd | -6% | -3% | 4% | 4% | 6.85 | $2,332,504,224.18 |
| BCN | Beacon Minerals | -6% | -8% | 6% | -3% | 0.034 | $123,802,665.27 |
| XAM | Xanadu Mines Ltd | -6% | 21% | 21% | -51% | 0.034 | $43,780,066.67 |
| EMR | Emerald Res NL | -6% | 3% | 20% | 26% | 1.18 | $684,280,802.40 |
| WWI | West Wits Mining Ltd | -6% | -6% | -18% | -59% | 0.033 | $55,146,973.83 |
| DGO | DGO Gold Limited | -6% | 21% | 20% | -10% | 3.3 | $272,135,385.12 |
| A1G | African Gold Ltd. | -6% | -13% | -28% | -33% | 0.165 | $18,508,600.84 |
| GWR | GWR Group Ltd | -6% | 3% | 14% | -46% | 0.16 | $49,788,581.53 |
| PAK | Pacific American Hld | -6% | 0% | 0% | -18% | 0.016 | $7,646,038.43 |
| CY5 | Cygnus Gold Limited | -6% | -6% | 19% | 7% | 0.16 | $18,877,650.40 |
| SAU | Southern Gold | -6% | -8% | -35% | -44% | 0.048 | $10,239,780.29 |
| OAU | Ora Gold Limited | -6% | 0% | 6% | -19% | 0.016 | $16,701,574.67 |
| ERM | Emmerson Resources | -6% | -12% | 40% | 55% | 0.115 | $62,421,626.25 |
| RML | Resolution Minerals | -6% | -17% | -21% | -44% | 0.015 | $9,980,498.99 |
| THR | Thor Mining PLC | -6% | 7% | -12% | 7% | 0.015 | $14,194,478.63 |
| ENR | Encounter Resources | -6% | 0% | -19% | -2% | 0.15 | $50,690,692.16 |
| SSR | SSR Mining Inc. | -6% | 6% | 41% | 51% | 30.7 | $588,452,052.15 |
| GOR | Gold Road Res Ltd | -6% | -4% | 12% | 26% | 1.555 | $1,350,277,287.75 |
| E2M | E2 Metals | -6% | -10% | -12% | -27% | 0.22 | $38,089,016.68 |
| DTM | Dart Mining NL | -6% | -15% | -34% | -44% | 0.073 | $9,087,837.89 |
| ASO | Aston Minerals Ltd | -6% | -9% | 16% | 4% | 0.145 | $153,239,158.52 |
| DEX | Duke Exploration | -6% | -19% | -26% | -59% | 0.145 | $12,629,561.28 |
| AGG | AngloGold Ashanti | -7% | -10% | 14% | 4% | 5.75 | $490,642,707.50 |
| AQX | Alice Queen Ltd | -7% | 0% | -30% | -63% | 0.007 | $9,197,088.06 |
| GMR | Golden Rim Resources | -7% | -3% | -22% | -58% | 0.07 | $20,634,808.49 |
| GRL | Godolphin Resources | -7% | -3% | -10% | -26% | 0.14 | $11,355,035.09 |
| TRN | Torrens Mining | -7% | 4% | -13% | -10% | 0.14 | $9,928,091.32 |
| NCM | Newcrest Mining | -7% | 0% | 6% | 1% | 26.865 | $23,864,253,159.84 |
| AMI | Aurelia Metals Ltd | -7% | -7% | 18% | 12% | 0.4475 | $538,119,558.80 |
| MKR | Manuka Resources. | -7% | -4% | -28% | -35% | 0.275 | $32,493,376.30 |
| EVN | Evolution Mining Ltd | -7% | -9% | 9% | -13% | 4.04 | $7,332,030,732.00 |
| TTM | Titan Minerals | -7% | -4% | -15% | -11% | 0.093 | $131,104,009.57 |
| RRL | Regis Resources | -7% | -1% | 3% | -19% | 2.09 | $1,532,195,884.94 |
| SVL | Silver Mines Limited | -7% | -9% | 3% | 1% | 0.2275 | $284,203,071.46 |
| M24 | Mamba Exploration | -7% | -10% | -33% | -45% | 0.13 | $5,482,750.39 |
| BRB | Breaker Res NL | -7% | 2% | -20% | 21% | 0.26 | $83,089,436.90 |
| STN | Saturn Metals | -7% | 1% | -13% | -10% | 0.385 | $49,361,687.26 |
| WRM | White Rock Min Ltd | -7% | -7% | -43% | -61% | 0.19 | $30,749,577.50 |
| KAU | Kaiser Reef | -7% | -16% | -3% | -43% | 0.19 | $25,246,789.23 |
| CYL | Catalyst Metals | -7% | -9% | -16% | -19% | 1.75 | $179,189,825.36 |
| NVA | Nova Minerals Ltd | -8% | -9% | -50% | -50% | 0.73 | $125,240,588.08 |
| M2R | Miramar | -8% | 13% | 0% | -23% | 0.18 | $8,966,703.60 |
| HRZ | Horizon | -8% | 4% | -4% | 4% | 0.12 | $70,996,900.00 |
| GML | Gateway Mining | -8% | 0% | -33% | -56% | 0.012 | $27,121,276.40 |
| KTA | Krakatoa Resources | -8% | 131% | 82% | 94% | 0.12 | $32,418,090.87 |
| MBK | Metal Bank Ltd | -8% | -14% | -25% | -37% | 0.006 | $15,646,908.96 |
| TBR | Tribune Res Ltd | -8% | -7% | -9% | -14% | 4.5 | $248,174,004.21 |
| BBX | BBX Minerals Ltd | -8% | -8% | -32% | -57% | 0.115 | $55,202,577.00 |
| MEK | Meeka Gold Limited | -8% | -12% | 2% | 0% | 0.046 | $42,337,722.19 |
| IVR | Investigator Res Ltd | -8% | -10% | -21% | -27% | 0.0615 | $79,938,819.42 |
| MZZ | Matador Mining Ltd | -8% | -5% | -38% | -32% | 0.2475 | $52,084,681.20 |
| AVW | Avira Resources Ltd | -8% | 0% | -8% | -31% | 0.0055 | $11,653,345.00 |
| BEZ | Besragoldinc | -8% | -20% | -61% | 0% | 0.055 | $9,451,747.80 |
| GNM | Great Northern | -8% | -8% | -31% | -50% | 0.0055 | $10,254,305.86 |
| KCC | Kincora Copper | -9% | -23% | -31% | -64% | 0.096 | $7,103,855.04 |
| KRM | Kingsrose Mining Ltd | -9% | -11% | 28% | 46% | 0.073 | $54,715,435.89 |
| MEI | Meteoric Resources | -9% | 3% | -18% | -71% | 0.0155 | $22,894,460.57 |
| SBM | St Barbara Limited | -9% | -9% | -9% | -29% | 1.335 | $1,064,533,872.24 |
| MM8 | Medallion Metals. | -9% | 2% | 34% | 4% | 0.255 | $26,509,914.00 |
| CDT | Castle Minerals | -9% | -9% | 183% | 240% | 0.051 | $51,973,635.17 |
| ARV | Artemis Resources | -9% | -12% | -38% | -38% | 0.061 | $84,688,190.02 |
| KZR | Kalamazoo Resources | -9% | 8% | 9% | -10% | 0.405 | $59,529,693.34 |
| GTR | Gti Resources | -9% | -29% | -31% | -6% | 0.02 | $26,025,029.05 |
| RDS | Redstone Resources | -9% | 11% | -29% | -9% | 0.01 | $7,368,323.96 |
| MGV | Musgrave Minerals | -9% | 5% | -12% | -9% | 0.34 | $177,267,073.17 |
| PNT | Panthermetalsltd | -10% | 0% | 0% | 0% | 0.235 | $6,580,000.00 |
| KAL | Kalgoorliegoldmining | -10% | -18% | 0% | 0% | 0.14 | $10,140,844.00 |
| WCN | White Cliff Min Ltd | -10% | 12% | 100% | 40% | 0.028 | $18,300,894.14 |
| CBY | Canterbury Resources | -10% | -30% | -51% | -49% | 0.056 | $7,391,911.80 |
| LCY | Legacy Iron Ore | -10% | 40% | 115% | 47% | 0.028 | $172,984,307.37 |
| BGD | Bartongoldholdings | -10% | -12% | 35% | 0% | 0.23 | $19,743,199.08 |
| NXM | Nexus Minerals Ltd | -10% | -28% | -26% | 254% | 0.315 | $88,351,036.96 |
| GSR | Greenstone Resources | -10% | -15% | 31% | 66% | 0.0315 | $30,242,971.74 |
| MDI | Middle Island Res | -10% | 13% | 23% | 8% | 0.135 | $16,526,459.97 |
| BC8 | Black Cat Syndicate | -10% | -9% | -5% | -33% | 0.53 | $92,884,188.60 |
| GMD | Genesis Minerals | -10% | -1% | 14% | 135% | 1.455 | $365,706,817.10 |
| TSO | Tesoro Resources Ltd | -10% | -8% | -19% | -64% | 0.07 | $49,464,247.42 |
| CMM | Capricorn Metals | -10% | 4% | 66% | 134% | 4.14 | $1,493,753,340.66 |
| BAT | Battery Minerals Ltd | -11% | -6% | -35% | -55% | 0.0085 | $21,127,181.14 |
| HRN | Horizon Gold Ltd | -11% | -10% | -14% | -3% | 0.38 | $41,609,886.24 |
| RDT | Red Dirt Metals Ltd | -11% | -20% | -22% | 184% | 0.525 | $160,373,098.54 |
| PNR | Pantoro Limited | -11% | -8% | 24% | 37% | 0.28 | $448,837,847.97 |
| LYN | Lycaonresources | -11% | -2% | 0% | 0% | 0.4 | $11,805,000.00 |
| WGX | Westgold Resources. | -11% | -14% | -16% | -25% | 1.63 | $748,123,942.28 |
| AUC | Ausgold Limited | -11% | 6% | 67% | 46% | 0.07 | $133,244,268.79 |
| LCL | Los Cerros Limited | -11% | -23% | -38% | -50% | 0.093 | $58,366,021.95 |
| AL8 | Alderan Resource Ltd | -12% | 10% | -43% | -70% | 0.023 | $10,213,585.92 |
| DEG | De Grey Mining | -12% | 2% | 7% | -17% | 1.1975 | $1,669,479,577.13 |
| MML | Medusa Mining Ltd | -12% | -15% | 5% | -1% | 0.795 | $185,784,385.32 |
| ANX | Anax Metals Ltd | -12% | 29% | 10% | 33% | 0.11 | $46,049,238.40 |
| MLS | Metals Australia | -12% | 45% | 263% | 190% | 0.145 | $57,522,492.30 |
| NST | Northern Star | -12% | -9% | 4% | -7% | 9.85 | $11,359,980,664.50 |
| MCT | Metalicity Limited | -13% | 17% | -22% | -46% | 0.007 | $17,888,682.04 |
| AAJ | Aruma Resources Ltd | -13% | 9% | 21% | 38% | 0.105 | $14,440,458.28 |
| GMN | Gold Mountain Ltd | -13% | -22% | -63% | -83% | 0.007 | $8,352,044.19 |
| SKY | SKY Metals Ltd | -13% | -1% | -7% | -37% | 0.091 | $36,924,780.06 |
| MHC | Manhattan Corp Ltd | -13% | -7% | 8% | -7% | 0.013 | $18,315,344.32 |
| SLR | Silver Lake Resource | -13% | -15% | 10% | 8% | 1.8525 | $1,744,066,783.13 |
| ARL | Ardea Resources Ltd | -14% | 1% | 255% | 255% | 1.625 | $274,975,190.64 |
| HXG | Hexagon Energy | -14% | -22% | -57% | -75% | 0.038 | $16,963,930.85 |
| TAR | Taruga Minerals | -14% | -27% | -62% | -65% | 0.019 | $11,560,964.80 |
| RVR | Red River Resources | -14% | 0% | 2% | 0% | 0.22 | $116,654,509.80 |
| ALK | Alkane Resources Ltd | -14% | -5% | 14% | 44% | 1.03 | $589,627,585.80 |
| AYM | Australia United Min | -14% | -14% | -40% | -40% | 0.006 | $11,055,464.91 |
| MTC | Metalstech Ltd | -15% | -6% | -29% | 158% | 0.25 | $39,999,501.60 |
| VKA | Viking Mines Ltd | -15% | 0% | -45% | -68% | 0.011 | $11,277,842.74 |
| CLA | Celsius Resource Ltd | -15% | -21% | -15% | -45% | 0.022 | $28,093,712.66 |
| YRL | Yandal Resources | -16% | -8% | -41% | -53% | 0.24 | $30,183,803.78 |
| TMZ | Thomson Res Ltd | -16% | -23% | -58% | -68% | 0.037 | $24,301,248.13 |
| IPT | Impact Minerals | -16% | 12% | -4% | -29% | 0.013 | $24,095,077.45 |
| LRL | Labyrinth Resources | -16% | -11% | 17% | -16% | 0.041 | $33,187,936.69 |
| MEG | Megado | -17% | 43% | 63% | 0% | 0.15 | $6,457,319.70 |
| MOH | Moho Resources | -17% | 4% | -10% | -27% | 0.053 | $6,766,692.09 |
| EM2 | Eagle Mountain | -18% | -22% | -50% | -71% | 0.345 | $95,486,729.76 |
| DCN | Dacian Gold Ltd | -18% | -2% | -2% | -38% | 0.23 | $249,567,724.49 |
| KCN | Kingsgate Consolid. | -18% | -6% | -16% | 60% | 1.4 | $309,848,634.20 |
| EMU | EMU NL | -18% | 0% | -40% | -65% | 0.018 | $10,996,289.68 |
| PUR | Pursuit Minerals | -18% | 29% | -23% | -63% | 0.027 | $24,584,279.04 |
| OZM | Ozaurum Resources | -18% | 41% | 3% | -6% | 0.155 | $9,440,640.00 |
| GBR | Greatbould Resources | -19% | -22% | -35% | 87% | 0.097 | $41,343,472.95 |
| PNM | Pacific Nickel Mines | -19% | -14% | -22% | 80% | 0.097 | $28,483,964.88 |
| MTH | Mithril Resources | -20% | -30% | -43% | -53% | 0.008 | $26,282,097.37 |
| SBR | Sabre Resources | -21% | -8% | 10% | 10% | 0.0055 | $15,340,406.70 |
| WMC | Wiluna Mining Corp | -22% | -19% | -28% | -27% | 0.73 | $156,373,059.30 |
| VRC | Volt Resources Ltd | -22% | 31% | -30% | -9% | 0.021 | $63,052,275.54 |
| OBM | Ora Banda Mining Ltd | -24% | -25% | -50% | -82% | 0.039 | $57,707,466.73 |
| OKR | Okapi Resources | -24% | 4% | -49% | 57% | 0.29 | $35,141,751.90 |
It was a short but busy week for quarterlies. Here is a pick of some of the big boys.
Australia’s biggest gold miner produced 480,000oz of gold and 31,000t of copper in the three months to March 31 at all in sustaining costs of US$1008/oz.
That’s an AISC margin of US$809/oz.
It expects production to keep rising in the June quarter after narrowing FY22 guidance to 1.925-2.025Moz of gold and 125,000-130,000t copper, up on previous estimates thanks to the acquisition of Pretium Resources and its Brucejack mine in Canada.
SILVER LAKE RESOURCES (ASX:SLR)
The WA gold miner sensationally dumped guidance this week, prompting a major sell off.
Silver Lake produced 53,811oz of gold and 262t of copper in Q1 at an AISC of $1634/oz.
Despite reporting year to date production of 182,778oz of gold and 756t of copper at $1643/oz and average sales of $2441/oz, SLR said COVID cases at WA mines ‘Mount Monger’ and ‘Deflector’ in March and April led it to withdraw guidance.
The company said while it is positioned to meet its FY22 guidance, the “severe disruption caused by COVID-19 related labour shortages” and related supply chain disruptions are likely to continue.
A problem also felt by SBM, which reported a massive climb in all in sustaining costs from $1587/oz in the December quarter to $2290/oz in the March quarter on production of 61,819oz of gold.
The owner of the Gwalia gold mine in Leonora said its WA operations were impacted by skilled labour shortages as well as lower grades and third-party ore feed. It also suffered a major COVID outbreak at the Simberi mine in PNG as well as lower grades at the Atlantic gold operations in Canada.
Managing director Craig Jetson said competition for labour was so fierce in WA at the moment that critical maintenance staff were being poached in the days and weeks before shutdowns.
RRL reported gold production of 103,100oz at AISC of $1574/oz in the March quarter.
That included 74,800oz at its flagship Duketon project at $1672/oz and 28,300oz at $1216/oz from Regis’ 30% share in AngloGold Ashanti’s Tropicana mine.
RBC’s Alex Barkley said COVID and labour issues sent gold production 8% short on its estimates but AISC impacts were “controlled”.
Australia’s second biggest gold miner upped its cost guidance for 2021-22 after a March quarter where input costs and labour pressures continued to be felt.
Northern Star’s AISC has risen from $1593/oz in the September quarter to $1631/oz in December and $1656/oz in March on gold sales of 380,075oz and all in costs of $2171/oz.
Much of that had been driven by issues at the Pogo mine, where NST is expecting an improved run rate of 240,000ozpa for the second half after completing a mill upgrade and improving underground development rates.
Its average realised price of $2468/oz delivered sales revenue of $937m, with cash and bullion of $533m and net cash of $433m on hand at the end of the quarter.
Ramelius meanwhile says it plans to hit the lower end of its guidance of 260,000-265,000oz at $1475-1525/oz after producing 58,602oz at $1596/oz in the March quarter as road train driver shortages hit their peak in January and February.
It is planning a big ramp up to 69,000-74,000oz at $1525/oz in the June quarter.
Mining
Mining
Mining

Mining

Mining

Mining


Get the latest Stockhead news delivered free to your inbox.