Canada Unearthed: Turn up the volume, please TSXV

Pic: Via getty
- TSXV has turned into “a ghost town of trading” as the small cap exchange continues to suffer from weakening volumes
- The TSX’s biggest +$1bn capped resources winners for June: NexGen, Ivanhoe, Cameco, Filo, Denison
- Top TSXV June winners: Solis, Grid Battery Metals, Trench Metals, Canuc
Our Canada Unearthed column wraps the news driving mining and exploration stocks listed on the TSX and TSX.V.
Canada’s TSXV has turned into “a ghost town of trading” as the small cap exchange continues to suffer from weakening volumes since its February 2021 peak.
Low trading volume can indicate a lack of interest in either buying or selling; generally not what you want as a trader, and certainly not what you want as a broker.
According to PI Financial investment advisor Justin Hayek, trading volumes historically move in tandem with the overall value of the TSXV, which has been trading sideways for some time:
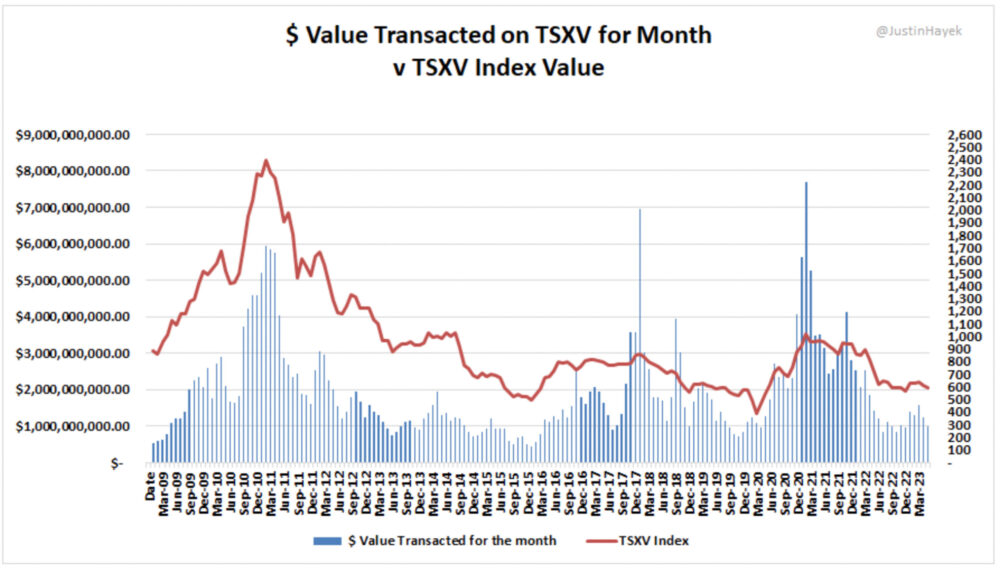
Which makes sense. Hot market = more trades, and vice versa.
The difference in $ volume transacted between ‘bull’ and ‘bear’ markets is notable, Hayek says, with roughly two to four times more liquidity and turnover during a bull market v bear market.
“… market tops are when buyers, capital invested and therefore turnover are at their greatest,” Hayek writes.
“Market bottoms are quite the opposite, naturally, of market tops. At these levels, there is a lack of buyers and volumes decline precipitously.
“Bids (buyers) dry up and selling tends to exaggerate the declines of these typically already illiquid securities.
“These time periods are also marked by a general lack of interest by retail investors to allocating additional or even moving around risk capital.”
Which is what is happening, right now, and may go some way to explaining why TSXV resources stocks appear to be underperforming their ASX listed peers.
How long until the crowds return to the TSX.V?
Hayek says while weak volume has been a big topic of discussion of late, this period is nowhere near as bad as things have been in the past.
“There is a real possibility liquidity does not improve over the summer (it’s summer doldrums as we like to call it); in fact (it) may worsen July & August,” he says.
“Historically we do see a pick-up in activity come the fall and before Christmas holidays.
“However, we could also see a sustain lulled in activity for some time barring two variables 1) a meaningful improvement in commodity prices (plausible) or 2) meaningful improvement of investor sentiment & return of risk capital (I’m not so sure).
“Either way we know we have seen this type of market in the past and seen the pendulum swing the other way eventually.”
How did the TSX/ TSX.V perform in June?
Fairly well. The TSX composite index closed out June with a 1.12% gain thanks to winners in the technology and material sectors.
The resources heavy TSX.V composite index was up 1.88% for the month, touching mid-May levels on a strong day of trade Friday.
The biggest +$1bn capped resources winners in the TSX for June were:
NexGen Energy (TSX:NXE) +23%
NexGen is a dual listed company developing the Rook 1 uranium mine in Saskatchewan’s southwestern Athabasca Basin, the largest development-stage project in Canada.
“Unlike Cigar Lake, the deposit is entirely contained in basement rock with no surface water,” says Shaw and Partners senior private wealth adviser Felicity Thomas.
“A 2021 Feasibility Study outlined an initial 11-year life producing 29Mlbs at AISC US$10/lb for US$1.3bn capex (11-month payback) making it the lowest cost uranium mine in the world.
“The company is now progressing to through the permitting and detailed engineering phase.”
Shaw and Partners has a 12-month price target of $10.75 on this stock.
We are pleased to announce that $NXE has commenced its highly targeted summer exploration drill program comprised of 17,000m and focused on high priority areas of $NXE’s extensive SW2&SW1 land package. Read more about the summer drill program and our pursuit of material uranium… pic.twitter.com/KspRlpkWlW
— NexGen Energy Ltd. (@NexGenEnergy_) June 12, 2023
Cameco (TSX:CCO) 14%
The uranium producer has benefitted from an upswing in yellowcake prices and investor sentiment.
In April, Cameco senior vice president and CFO Grant Isaac said this was the start of a major contracting cycle with one of the largest nuclear reactor builds in decades — 57 worldwide — about to hit.
Isaac says higher prices would be needed to encourage new sources of production to market.
“The primary supply stack isn’t poised to respond. We don’t have those secondary volumes that have helped fill the gap in the past.
“We’ve never been at this stage of a cycle at a US$50 uranium price already.”
Filo Corp (TSX:FIL) +22%
Filo’s main game is the monster Filo del Sol copper-gold-silver deposit along the Argentina-Chile border.
FIL recently raised CAD$130m via private placement, upsized due to strong investor demand.
“In addition to the support of the Lundin Family and BHP, the private placement was well supported by institutional investors, including funds and accounts managed by BlackRock,” the company says.
“This sets Filo up well for the next phase of drilling as we grow and define this remarkable deposit.”
Very few explorers can go out and raise $130M, but @filo_mining did with some assistance from very close shareholders. Here’s CEO @j_beck00 with @PaulHarrisGold talking about the upsized deal.
Full Episode –>> https://t.co/V5Xal8ZZJm pic.twitter.com/SaqvBmNyRd
— The Trevor Hall – Mining Stock Daily (@TrevAHall) June 5, 2023
Denison Mines (TSX:DML) 19%
During the month Denison released a Feasibility Study on the Wheeler River uranium project in Canada’s world class Athabasca Basin region.
Development would initially focus on the Phoenix and Gryphon uranium deposits.
“After 4.5 years of rigorous technical de-risking and independent third-party validation, Phoenix has cemented its position as one of the lowest-cost uranium development projects in the world,” Denison boss David Cates says.
“While most contemporary uranium development projects have not yet been tested against current cost inflation, the results of the Phoenix FS and Gryphon Update demonstrate that Denison continues to be uniquely positioned to become a meaningful uranium producer with multiple low-cost development assets.”
Denison’s Phoenix FS estimates pre-production capital costs of under $420 million (100% basis), yielding an impressive base case after-tax NPV to initial capital cost ratio exceeding 3.7 to 1.
Refer to the full release here: https://t.co/JqGVMBhRzx pic.twitter.com/foUo6QUaNu
— Denison Mines Corp. (@DenisonMinesCo) June 27, 2023
Ivanhoe Mines (TSX:IVN) 14%
Robert Friedland’s copper play achieved record production of 35,856t copper in concentrate in May from its tier 1 Kamoa-Kakula operation in the DRC.
That’s 430,000t annualised.
The company aims to increase output to +500,000tpa of 99+%-pure copper anodes via its Phase 3 expansion project, which includes the largest copper smelter in Africa.
The biggest resources winners on the TSX.V for June were:
Solis Minerals (ASX:SLM) (TSX.V: SLMN) +718%
Lithium’s dual listed ‘flavour of the month’ announced the purchase of the Jaguar lithium project in Brazil late May.
At Jaguar – located in Bahia state — the company says there are rock chips grading up to 4.95% Li2O along a 1km long, 50m wide spodumene-rich pegmatite body.
It then raised $8.1m at a modest ~7% discount to the last traded price, with big brother and fellow Brazilian lithium play Latin Resources (ASX:LRS) increasing its investment in SLM to 17.79% as part of the placement.
Drilling is already underway. It also has a lithium project in northern Brazil called Borborema and several additional acquisitions in the pipeline.
Stockhead article with ED Matthew Boyes, on why #Brazil is the next #Lithium hot spot.
“I saw an opportunity when I joined, I said to Chris Gale of Latin Resources ‘I’m going to go find another set of assets similar to Latin’, and I think we found them”.https://t.co/TwhWjfJAn7
— Solis Minerals (@SolisMinerals) June 30, 2023
Grid Battery Metals (TSX.V:CELL) +140%
Last month, the explorer added a new clay lithium exploration project in Nevada called Texas Springs to its portfolio, which also includes Clayton Valley (lithium), Volt Canyon (lithium) and Mount Sidney Williams (nickel).
A recent CAD$3m cap raise means the company is fully funded going into the 2023 and 2024 exploration seasons, and to “add additional strategic lithium exploration properties to our mineral portfolio in the near future”.
“Together with this financing, the Company will have approximately CAD$4.5 million in the bank, along with approximately CAD$3.6 million worth of marketable securities from some well-timed Nickel property dispositions to Surge Battery Metals Inc,” it says.
“Together, the Company has in excess of CAD$8 million to be used to create additional shareholder value.”
Canuc Resources (TSX.V:CDA) +129%
Canuc is focused on the San Javier silver-gold project in Sonora State, Mexico.
It also generates a small amount of cashflow — ~CAD $3m since 2011 — from natural gas production at its MidTex energy project in Central West Texas, where Canuc has an interest in eight producing natural gas wells and has rights for further in field developments.
Trench Metals (TSX.V:TMC) +108%
The early stage explorer is about to launch into exploration at the flagship Higginson Lake uranium project in Athabasca, Northern Saskatchewan.
The focus will be dialling in on potential deposits at the Peterson Rapids, Charlebois Lake and Dianne targets.
TSX and TSX.V Winners & Losers
Here’s how TSX and TSX.V-listed mining and exploration stocks performed last week:
Scroll or swipe to reveal table. Click headings to sort. Best viewed on a laptop.
Stocks missing from this list? Email [email protected]
| CODE | COMPANY | 1 WEEK RETURN % | 1 MONTH RETURN % | YTD RETURN % | MARKET CAP |
|---|---|---|---|---|---|
| ADE | Adex Mining Inc. | 100% | 100% | 0% | $6,772,114 |
| CCD | Cascadero Copper Corporation | 100% | 0% | 0% | $3,001,299 |
| GETT | G.E.T.T. Gold Inc. | 100% | 0% | 0% | $2,140,463 |
| TBLL | Tombill Mines Limited | 100% | 0% | -50% | $1,729,435 |
| ACS | Archon Minerals Limited | 88% | 55% | 82% | $16,869,195 |
| CELL | Grid Battery Metals Inc. | 71% | 140% | 100% | $13,045,638 |
| NVX | NV Gold Corporation | 64% | 38% | 29% | $7,987,091 |
| RNCH | Ranchero Gold Corp. | 57% | -21% | 22% | $3,615,553 |
| STE | Starr Peak Mining Ltd. | 54% | 29% | 5% | $33,196,704 |
| TMC | Trench Metals Corp. | 50% | 108% | 17% | $18,351,651 |
| PLA | Plata Latina Minerals Corporation | 50% | 50% | 50% | $1,185,520 |
| XND | Xander Resources Inc. | 50% | 0% | -67% | $1,690,802 |
| PER | Peruvian Metals Corp. | 50% | -10% | -18% | $8,976,827 |
| PPP | Prospector Metals Corp. | 47% | 40% | -15% | $7,167,851 |
| NZN | Nevada Zinc Corporation | 40% | 17% | -22% | $3,300,912 |
| BAT | Batero Gold Corp. | 40% | 0% | 75% | $4,031,383 |
| RTM | RT Minerals Corp. | 35% | -4% | 35% | $2,565,603 |
| HBK | Highbank Resources Ltd. | 33% | 33% | -11% | $896,713 |
| FG | Falcon Gold Corp. | 33% | 20% | -43% | $7,782,882 |
| KFR | Kingfisher Metals Corp. | 33% | 18% | -26% | $10,662,870 |
| IZZ | International Prospect Ventures Ltd. | 33% | 14% | -11% | $2,022,472 |
| KGC | Kestrel Gold Inc. | 33% | 0% | -27% | $3,078,430 |
| NBLC | Nobel Resources Corp. | 33% | 0% | -53% | $3,085,285 |
| AORO | Aloro Mining Corp. | 33% | -33% | 0% | $1,158,585 |
| OREA | Orea Mining Corp. | 33% | -78% | -79% | $4,543,898 |
| TR | Troubadour Resources Inc. | 30% | 44% | -13% | $982,549 |
| SRA | Stria Lithium Inc. | 30% | 30% | 18% | $6,713,469 |
| VVC | VVC Exploration Corporation | 30% | 8% | 8% | $37,224,318 |
| SAU | St. Augustine Gold and Copper Limited | 30% | 18% | 0% | $55,177,565 |
| OPHR | Ophir Gold Corp. | 29% | 67% | 273% | $43,719,272 |
| CBA | Champion Bear Resources Ltd. | 28% | 35% | 53% | $6,951,727 |
| THM | Thunder Mountain Gold, Inc. | 27% | 27% | 460% | $8,519,781 |
| OZ | Outback Goldfields Corp. | 27% | 0% | 8% | $4,085,937 |
| JG | Japan Gold Corp. | 27% | -25% | -35% | $42,325,054 |
| WSK | Wildsky Resources Inc. | 27% | 36% | -3% | $7,807,697 |
| ESK | Eskay Mining Corp. | 26% | 84% | -8% | $177,785,211 |
| PWM | Power Metals Corp. | 26% | 80% | 30% | $54,666,534 |
| ICM | Iconic Minerals Ltd. | 25% | 47% | 79% | $16,280,722 |
| MERG | Metal Energy Corp. | 25% | 25% | 11% | $4,410,544 |
| NUG | NuLegacy Gold Corporation | 25% | 25% | 67% | $14,721,311 |
| REX | Orex Minerals Inc. | 25% | 25% | -29% | $4,684,951 |
| PHD | Providence Gold Mines Inc. | 25% | 25% | 67% | $3,035,454 |
| HMAN | Huntsman Exploration Inc. | 25% | 7% | -25% | $1,179,357 |
| VRB | Vanadiumcorp Resource Inc. | 25% | 5% | 5% | $6,607,634 |
| PX | Pelangio Exploration Inc. | 25% | 0% | -17% | $2,733,029 |
| NPK | Verde Agritech Ltd. | 25% | 14% | -47% | $137,364,885 |
| GCOM | Green Shift Commodities Ltd. | 24% | 53% | 18% | $12,244,546 |
| G | Augusta Gold Corp. | 24% | -1% | -48% | $85,070,455 |
| KZD | Kaizen Discovery Inc. | 23% | 23% | 54% | $12,199,454 |
| SRL | Salazar Resources Limited | 23% | 45% | -38% | $14,728,966 |
| TRO | Taranis Resources Inc. | 23% | -13% | -21% | $11,601,509 |
| SRC | Stakeholder Gold Corp. | 23% | 31% | 119% | $12,249,259 |
| GTC | Getty Copper Inc. | 22% | 22% | 22% | $6,704,016 |
| IGO | Independence Gold Corp. | 22% | 17% | 4% | $17,678,046 |
| AUEN | Golden Sky Minerals Corp. | 21% | 6% | -29% | $3,344,684 |
| BEA | Belmont Resources Inc. | 20% | 20% | -33% | $1,897,748 |
| CPER | CopperCorp Resources Inc. | 20% | 15% | -17% | $9,933,805 |
| AAN | Aton Resources Inc. | 20% | 13% | -8% | $10,084,874 |
| SAE | Sable Resources Ltd. | 20% | 9% | -45% | $17,181,894 |
| PPM | Pacific Imperial Mines Inc. | 20% | 0% | 50% | $2,372,324 |
| GIT | Gitennes Exploration Inc. | 20% | -14% | 50% | $1,685,314 |
| KES | Kesselrun Resources Ltd. | 20% | -14% | -50% | $2,810,155 |
| BCM | Bear Creek Mining Corporation | 20% | 4% | -34% | $85,052,212 |
| RIO | Rio2 Limited | 19% | 50% | 43% | $74,930,239 |
| ABA | Abasca Resources Inc. | 19% | 27% | 90% | $8,766,100 |
| XIM | Ximen Mining Corp. | 19% | 0% | -21% | $13,400,639 |
| SWLF | Silver Wolf Exploration Ltd. | 19% | -32% | -5% | $3,397,533 |
| CDB | Cordoba Minerals Corp. | 19% | -8% | -20% | $34,357,929 |
| AWX | Arcwest Exploration Inc. | 18% | 8% | 18% | $5,393,567 |
| BIG | Hercules Silver Corp. | 18% | 8% | 22% | $30,790,693 |
| OCG | Outcrop Silver & Gold Corporation | 17% | 11% | -29% | $41,005,978 |
| DLP | DLP Resources Inc. | 17% | -13% | 126% | $50,468,501 |
| SALT | Atlas Salt Inc. | 17% | 11% | -34% | $124,856,299 |
| CN | Condor Resources Inc. | 17% | 83% | 342% | $55,624,454 |
| WHE | Waroona Energy Inc. | 17% | 40% | 180% | $51,658,559 |
| MMY | Monument Mining Limited | 17% | 31% | 50% | $34,356,515 |
| WIN | Windfall Geotek Inc. | 17% | 5% | 133% | $14,027,541 |
| SKRR | SKRR Exploration Inc. | 17% | -22% | 40% | $2,288,301 |
| PLAN | Progressive Planet Solutions Inc. | 16% | 4% | -4% | $24,183,613 |
| VRR | VR Resources Ltd. | 16% | 68% | 219% | $37,592,397 |
| PBM | Pacific Bay Minerals Ltd. | 15% | 15% | 50% | $2,280,869 |
| EGR | EGR Exploration Ltd. | 15% | 0% | 7% | $3,014,940 |
| VCT | Volt Carbon Technologies Inc. | 15% | -6% | 0% | $13,042,568 |
| RML | Rusoro Mining Ltd. | 15% | 64% | 360% | $135,770,550 |
| USCM | US Critical Metals Corp. | 15% | 0% | -23% | $12,295,220 |
| B | BCM Resources Corporation | 15% | 63% | 117% | $36,572,863 |
| NUAG | New Pacific Metals Corp. | 14% | -13% | -4% | $456,190,799 |
| LUCA | Luca Mining Corp. | 14% | 28% | -3% | $65,431,010 |
| GPM | GPM Metals Inc. | 14% | 23% | 23% | $6,702,325 |
| OCI | Orecap Invest Corp. | 14% | 14% | 0% | $9,908,572 |
| RRS | Rogue Resources Inc. | 14% | 14% | 14% | $1,441,043 |
| GG | Golconda Gold Ltd. | 14% | 11% | -38% | $14,254,662 |
| GFG | GFG Resources Inc. | 14% | 9% | 20% | $24,984,291 |
| BTU | BTU Metals Corp. | 14% | 0% | 60% | $5,724,841 |
| CCMI | Canadian Critical Minerals Inc. | 14% | 0% | -43% | $8,756,511 |
| TG | Trifecta Gold Ltd. | 14% | 0% | -20% | $3,203,971 |
| XPLR | Xplore Resources Corp. | 14% | 0% | -53% | $1,568,151 |
| RDS | Radisson Mining Resources Inc. | 14% | -6% | 14% | $45,715,497 |
| MTX | Metalex Ventures Ltd. | 14% | -20% | -27% | $8,961,917 |
| ESM | Euro Sun Mining Inc. | 14% | -11% | -47% | $12,275,894 |
| ITR | Integra Resources Corp. | 14% | -3% | -31% | $100,415,195 |
| NSE | New Stratus Energy Inc. | 14% | 16% | 58% | $35,030,354 |
| RAU | Resouro Gold Inc. | 14% | 67% | 67% | $11,682,072 |
| AMY | RecycLiCo Battery Materials Inc. | 14% | 39% | 61% | $116,996,028 |
| CKG | Chesapeake Gold Corp. | 14% | -6% | -22% | $101,723,968 |
| SUU | Strathmore Plus Uranium Corp. | 13% | 24% | 93% | $24,059,356 |
| STS | South Star Battery Metals Corp. | 13% | -3% | 5% | $19,657,313 |
| RPX | Red Pine Exploration Inc. | 13% | 17% | -41% | $23,266,594 |
| OIII | O3 Mining Inc. | 13% | -3% | 1% | $114,221,134 |
| PGX | Prosper Gold Corp. | 13% | -6% | -23% | $5,475,951 |
| FOM | Foran Mining Corporation | 13% | 4% | 18% | $903,215,062 |
| MQM | Metalquest Mining Inc. | 13% | 23% | 170% | $3,633,496 |
| EAU | Engineer Gold Mines Ltd. | 13% | 13% | -55% | $1,174,569 |
| IZ | International Zeolite Corp. | 13% | 13% | -38% | $3,816,627 |
| NKG | Nevada King Gold Corp. | 13% | -4% | 41% | $120,858,739 |
| CCCM | C3 Metals Inc. | 13% | -10% | -18% | $31,027,691 |
| STNG | Stinger Resources Inc. | 13% | -10% | -18% | $2,234,148 |
| SCZ | Santacruz Silver Mining Ltd. | 12% | -20% | -21% | $112,317,164 |
| AMX | Amex Exploration Inc. | 12% | -3% | -4% | $170,350,952 |
| AGX | Silver X Mining Corp. | 12% | 6% | -29% | $45,343,222 |
| DV | Dolly Varden Silver Corporation | 12% | -7% | -17% | $190,992,212 |
| TMET | Torr Metals Inc. | 12% | 19% | -37% | $3,413,473 |
| OPV | Optimum Ventures Ltd. | 12% | 15% | 6% | $8,234,295 |
| APM | Andean Precious Metals Corp. | 12% | 4% | -32% | $120,287,733 |
| PDM | Palladium One Mining Inc. | 12% | -5% | -21% | $32,239,704 |
| PML | Panoro Minerals Ltd. | 12% | 4% | 4% | $38,334,383 |
| ALEX | Alpha Exploration Ltd. | 11% | 3% | 11% | $50,881,111 |
| BAY | Aston Bay Holdings Ltd. | 11% | 67% | 150% | $8,922,680 |
| ILC | International Lithium Corp. | 11% | -9% | -17% | $12,429,329 |
| LIO | Lion One Metals Limited | 11% | 6% | -30% | $144,371,669 |
| WAM | Western Alaska Minerals Corp. | 11% | 13% | -33% | $60,060,791 |
| ABM | Aben Minerals Ltd. | 11% | 29% | -38% | $2,901,559 |
| VIPR | Silver Viper Minerals Corp. | 11% | 3% | -9% | $23,979,849 |
| PHNM | Phenom Resources Corp. | 11% | -17% | -16% | $27,914,745 |
| VUL | Vulcan Minerals Inc. | 10% | 8% | -42% | $25,354,792 |
| FWZ | Fireweed Metals Corp. | 10% | 28% | 6% | $147,569,564 |
| SKP | Strikepoint Gold Inc. | 10% | 10% | -39% | $11,757,650 |
| MMV | Mineral Mountain Resources Ltd. | 10% | 0% | 100% | $12,437,991 |
| CCE | Commerce Resources Corp. | 10% | -8% | -24% | $10,983,149 |
| UGD | Unigold Inc. | 10% | -8% | 0% | $14,057,320 |
| GWA | Gowest Gold Ltd. | 10% | -15% | 57% | $51,962,835 |
| NCU | Nevada Copper Corp. | 10% | 26% | -24% | $218,107,090 |
| SGML | Sigma Lithium Corporation | 10% | 2% | 40% | $5,733,463,038 |
| XTG | Xtra-Gold Resources Corp. | 10% | 9% | 2% | $41,327,521 |
| SGNL | Signal Gold Inc. | 10% | -12% | -31% | $48,695,366 |
| PNRL | Premium Nickel Resources Ltd. | 10% | 44% | -15% | $161,154,389 |
| GNG | Golden Goliath Resources Ltd. | 10% | -18% | 10% | $2,512,534 |
| EAM | East Africa Metals Inc. | 10% | -23% | 0% | $23,492,227 |
| AMM | Almaden Minerals Ltd. | 9% | 9% | -47% | $21,955,425 |
| TNX | TRX Gold Corporation | 9% | -3% | 31% | $163,365,082 |
| LAM | Laramide Resources Ltd. | 9% | 14% | -11% | $93,555,399 |
| BONE | Boron One Holdings Inc. | 9% | 20% | 9% | $10,800,741 |
| NAR | North Arrow Minerals Inc. | 9% | 20% | 71% | $10,506,135 |
| FNC | Fancamp Exploration Ltd. | 9% | 9% | 50% | $19,417,013 |
| INFI | Infinitum Copper Corp. | 9% | 9% | -33% | $4,400,282 |
| VCU | Vizsla Copper Corp. | 9% | 7% | 4% | $16,892,680 |
| GENI | Genius Metals Inc. | 9% | 0% | -8% | $3,558,661 |
| PRG | Precipitate Gold Corp. | 9% | 0% | -20% | $7,822,008 |
| FIN | European Energy Metals Corp. | 9% | -22% | 567% | $12,713,077 |
| LAB | Labrador Gold Corp. | 9% | 48% | -16% | $41,652,445 |
| NOVR | Nova Royalty Corp. | 9% | -5% | 14% | $156,470,149 |
| TIG | Triumph Gold Corp. | 9% | 37% | 16% | $7,854,332 |
| GLO | Global Atomic Corporation | 9% | 18% | -15% | $602,714,989 |
| PGLD | P2 Gold Inc. | 9% | 6% | 2% | $26,517,978 |
| MMA | Midnight Sun Mining Corp. | 9% | 4% | 11% | $29,557,754 |
| EQTY | Equity Metals Corporation | 9% | -4% | -34% | $16,437,374 |
| QTWO | Q2 Metals Corp. | 9% | -2% | 135% | $73,120,548 |
| EMX | EMX Royalty Corporation | 9% | 2% | -2% | $280,151,176 |
| SLG | San Lorenzo Gold Corp. | 8% | 18% | -13% | $4,119,269 |
| BOL | Bold Ventures Inc. | 8% | 0% | -24% | $3,209,783 |
| DSM | Deep-South Resources Inc. | 8% | 0% | 44% | $10,162,482 |
| MAX | MAX Resource Corp. | 8% | 0% | -47% | $21,854,384 |
| NBR | Nubian Resources Ltd. | 8% | 0% | -41% | $4,229,622 |
| BMET | Bemetals Corp. | 8% | -7% | 4% | $23,055,831 |
| HI | Highland Copper Company Inc. | 8% | -7% | -7% | $47,863,635 |
| KAPA | Kapa Gold Inc. | 8% | -7% | -52% | $3,627,698 |
| VLT | Volt Lithium Corp. | 8% | -32% | 136% | $25,858,496 |
| ENRG | New Energy Metals Corp. | 8% | -41% | -77% | $2,397,274 |
| THX | Thor Explorations Ltd. | 8% | 3% | 19% | $193,120,024 |
| CNX | Callinex Mines Inc. | 8% | -5% | 29% | $42,618,139 |
| FIND | Baselode Energy Corp. | 8% | 11% | -5% | $41,022,811 |
| LEXI | Lithium Energi Exploration Inc. | 8% | -5% | 54% | $29,474,478 |
| GAL | Galantas Gold Corporation | 8% | 0% | -45% | $29,196,422 |
| MOZ | Marathon Gold Corporation | 8% | 5% | -24% | $320,670,680 |
| TECK.A | Teck Resources Limited - Teck Res Cl A MV | 8% | 8% | 9% | $436,498,924 |
| BAU | Blue Star Gold Corp. | 8% | 4% | 64% | $28,870,601 |
| SLS | Solaris Resources Inc. | 8% | 6% | -8% | $877,035,746 |
| CSO | Corsa Coal Corp. | 8% | 15% | 73% | $35,629,901 |
| CUI | Currie Rose Resources Inc. | 8% | 27% | 180% | $12,216,766 |
| CAF | Canaf Investments Inc. | 8% | 17% | 40% | $6,639,667 |
| NIO | Nio Strategic Metals Inc. | 8% | 0% | 115% | $10,221,976 |
| XTM | Transition Metals Corp. | 8% | 0% | 0% | $4,028,947 |
| VM | Voyageur Pharmaceuticals Ltd. | 8% | 0% | -18% | $9,289,168 |
| WMS | Western Metallica Resources Corp. | 8% | 0% | 0% | $3,621,004 |
| FSX | Fosterville South Exploration Ltd. | 8% | -8% | 31% | $28,660,541 |
| GOFL | Goldflare Exploration Inc. | 8% | -22% | 27% | $6,785,750 |
| CERT | Cerrado Gold Inc. | 8% | -12% | -3% | $82,457,643 |
| AFM | Alphamin Resources Corp. | 8% | 16% | 14% | $1,288,097,251 |
| GRDM | Grid Metals Corp. | 7% | 7% | -15% | $24,399,564 |
| ALDE | Aldebaran Resources Inc. | 7% | 24% | 9% | $131,923,244 |
| INTR | Intrepid Metals Corp. | 7% | 11% | 25% | $7,351,968 |
| FFOX | Firefox Gold Corp. | 7% | 7% | -17% | $9,658,225 |
| CLM | Consolidated Lithium Metals Inc. | 7% | 0% | -6% | $23,336,245 |
| AMK | American Creek Resources Ltd. | 7% | -6% | 15% | $59,608,516 |
| CASA | CASA Minerals Inc. | 7% | -17% | -29% | $4,955,500 |
| SPC | SPC Nickel Corp. | 7% | -17% | 25% | $9,377,569 |
| GMV | GMV Minerals Inc. | 7% | -21% | 11% | $12,953,254 |
| MLP | Millennial Potash Corp. | 7% | -6% | 5% | $18,063,430 |
| SLR | Solitario Zinc Corp. | 7% | -3% | -8% | $51,815,098 |
| TECK.B | Teck Resources Limited - Teck Res Cl B SV | 7% | 8% | 9% | $28,653,159,905 |
| GRAT | Gratomic Inc. | 7% | 19% | 2% | $61,769,303 |
| EMPR | Empress Royalty Corp. | 7% | 2% | -22% | $36,052,652 |
| NPR | North Peak Resources Ltd. | 7% | 29% | 125% | $42,634,024 |
| SUI | Superior Mining International Corporatio | 7% | 9% | 3% | $20,450,760 |
| CUR | Consolidated Uranium Inc. | 7% | 22% | -15% | $141,196,095 |
| IPG | Imperial Mining Group Ltd. | 7% | 7% | -16% | $14,129,629 |
| BSK | Blue Sky Uranium Corp. | 7% | 0% | -11% | $17,428,385 |
| TRS | Tres-Or Resources Ltd. | 7% | 0% | 23% | $2,018,709 |
| KTN | Kootenay Silver Inc. | 7% | -16% | -50% | $32,945,927 |
| LPK | Lupaka Gold Corp. | 7% | -16% | -16% | $1,442,223 |
| RUP | Rupert Resources Ltd. | 7% | 12% | -14% | $866,876,755 |
| EDM | EDM Resources Inc. | 6% | -30% | -38% | $8,662,877 |
| FVI | Fortuna Silver Mines Inc. | 6% | -2% | -15% | $1,253,704,217 |
| CUU | Copper Fox Metals Inc. | 6% | -11% | 56% | $137,225,541 |
| GGD | GoGold Resources Inc. | 6% | -10% | -30% | $495,854,037 |
| LMS | Latin Metals Inc. | 6% | 31% | 31% | $11,078,819 |
| FDR | Founders Metals Inc. | 6% | 16% | 70% | $14,656,380 |
| SME | Sama Resources Inc./Ressources Sama Inc. | 6% | 6% | 31% | $38,459,477 |
| OMM | Omineca Mining and Metals Ltd. | 6% | -6% | -15% | $15,132,939 |
| CAPT | Capitan Silver Corp. | 6% | -11% | -26% | $12,000,431 |
| YGT | Gold Terra Resource Corp. | 6% | -11% | -47% | $23,902,211 |
| FR | First Majestic Silver Corp. | 6% | -3% | -34% | $2,126,761,172 |
| SSV | Southern Silver Exploration Corp. | 6% | 3% | -10% | $51,020,682 |
| IAU | i-80 Gold Corp. | 6% | 4% | -21% | $825,528,766 |
| MND | Mandalay Resources Corporation | 6% | -17% | -42% | $170,035,919 |
| AMRQ | Amaroq Minerals Ltd. | 6% | 9% | 1% | $186,929,721 |
| NFG | New Found Gold Corp. | 6% | 15% | 21% | $1,164,902,840 |
| SLMN | Solis Minerals Ltd. | 6% | 718% | 1025% | $63,597,099 |
| DOS | Dios Exploration Inc. | 6% | 29% | 29% | $10,323,636 |
| SWA | Sarama Resources Ltd. | 6% | 13% | -31% | $12,412,995 |
| HANS | Hanstone Gold Corp. | 6% | -5% | 0% | $3,513,881 |
| BKI | Black Iron Inc. | 6% | 29% | 13% | $27,370,839 |
| ALS | Altius Minerals Corporation | 6% | 3% | -1% | $1,042,480,975 |
| KC | Kutcho Copper Corp. | 6% | 9% | -20% | $23,887,839 |
| RSLV | Reyna Silver Corp. | 6% | -8% | -52% | $23,447,131 |
| LTH | Lithium Ionic Corp. | 6% | 6% | 52% | $289,433,007 |
| NGC | Northern Graphite Corporation | 6% | 1% | -19% | $49,406,848 |
| WINS | Winshear Gold Corp. | 6% | -14% | 73% | $7,442,330 |
| DIAM | Star Diamond Corporation | 6% | 12% | 27% | $42,839,696 |
| WDO | Wesdome Gold Mines Ltd. | 6% | -8% | -8% | $1,017,927,820 |
| INCA | Inca One Gold Corp. | 5% | 15% | 5% | $7,106,853 |
| BRW | Brunswick Exploration Inc. | 5% | -12% | 64% | $144,901,994 |
| ODV | Osisko Development Corp. | 5% | -2% | 6% | $510,526,292 |
| KNG | Kingsmen Resources Ltd. | 5% | 18% | 119% | $7,643,218 |
| SMT | Sierra Metals Inc. | 5% | 1% | 68% | $65,014,261 |
| RGD | Reunion Gold Corporation | 5% | 10% | 18% | $518,934,789 |
| CNL | Collective Mining Ltd | 5% | -2% | 133% | $353,665,481 |
| CCO | Cameco Corporation | 5% | 14% | 35% | $17,966,505,439 |
| BRAU | Big Ridge Gold Corp. | 5% | 5% | 43% | $13,661,084 |
| GSVR | Guanajuato Silver Company Ltd. | 5% | -9% | 10% | $131,361,473 |
| ARA | Aclara Resources Inc. | 5% | 22% | 88% | $97,933,906 |
| CS | Capstone Copper Corp. | 5% | 11% | 22% | $4,164,261,229 |
| FCU | Fission Uranium Corp. | 5% | 7% | -24% | $441,228,147 |
| JAG | Jaguar Mining Inc. | 5% | -5% | -17% | $163,631,210 |
| III | Imperial Metals Corporation | 5% | 2% | 2% | $286,511,981 |
| BWCG | Blackwolf Copper and Gold Ltd. | 5% | -3% | 24% | $17,172,113 |
| DML | Denison Mines Corp. | 5% | 19% | 7% | $1,387,381,278 |
| AKE | Allkem Limited | 5% | 10% | 40% | $9,205,869,462 |
| ABR | Arbor Metals Corp. | 5% | 3% | 17% | $188,905,736 |
| ETL | E3 Lithium Ltd. | 5% | -5% | 18% | $155,968,116 |
| MOX | Morien Resources Corp. | 5% | 25% | -6% | $32,821,119 |
| LGO | Largo Inc. | 5% | 5% | -23% | $359,942,370 |
| GRZ | Gold Reserve Inc. | 5% | 55% | 57% | $273,756,203 |
| RMR | Rome Resources Ltd. | 5% | -12% | -12% | $17,658,507 |
| FSY | Forsys Metals Corp. | 5% | 11% | -9% | $87,826,260 |
| RCK | Rock Tech Lithium Inc. | 5% | -10% | -4% | $196,430,234 |
| FUU | F3 Uranium Corp. | 5% | 17% | 8% | $124,496,893 |
| DTWO | D2 Lithium Corp. | 5% | -23% | -45% | $8,333,315 |
| TKO | Taseko Mines Limited | 4% | 13% | -4% | $548,362,887 |
| FRE | Fremont Gold Ltd. | 4% | -8% | 33% | $3,104,292 |
| MSR | Minsud Resources Corp. | 4% | -17% | 362% | $196,668,833 |
| TMQ | Trilogy Metals Inc. | 4% | 12% | 1% | $112,538,889 |
| KLD | Kenorland Minerals Ltd. | 4% | 6% | -4% | $47,680,902 |
| TSG | TriStar Gold Inc. | 4% | -11% | 0% | $31,891,084 |
| NXE | NexGen Energy Ltd. | 4% | 23% | 4% | $3,050,528,953 |
| OLA | Orla Mining Ltd | 4% | -1% | 1% | $1,740,135,824 |
| MFG | Mayfair Gold Corp. | 4% | 27% | 65% | $216,828,016 |
| HBM | HudBay Minerals Inc. | 4% | 7% | -7% | $2,177,835,208 |
| EDR | Endeavour Silver Corp. | 4% | -7% | -12% | $737,295,401 |
| EFR | Energy Fuels Inc. | 4% | 6% | -2% | $1,302,337,018 |
| CMB | CMC Metals Ltd. | 4% | -4% | -37% | $18,058,018 |
| BTR | BonTerra Resources Inc. | 4% | -10% | -12% | $32,810,830 |
| SGD | Snowline Gold Corp. | 4% | 34% | 26% | $520,071,347 |
| VZLA | Vizsla Silver Corp. | 4% | 1% | 4% | $334,780,710 |
| SVM | Silvercorp Metals Inc. | 4% | -4% | -5% | $667,085,244 |
| EDG | Endurance Gold Corporation | 4% | 10% | -24% | $39,252,422 |
| K | Kinross Gold Corporation | 4% | 0% | 14% | $7,770,473,917 |
| FURY | Fury Gold Mines Limited | 4% | -5% | -5% | $80,051,098 |
| MTA | Metalla Royalty & Streaming Ltd. | 4% | 3% | -12% | $304,951,576 |
| SKE | Skeena Resources Limited | 4% | -11% | -11% | $563,372,868 |
| SCOT | Scottie Resources Corp. | 4% | 10% | 6% | $74,520,199 |
| NIM | Nicola Mining Inc. | 4% | 8% | 27% | $44,509,217 |
| TLO | Talon Metals Corp. | 4% | 19% | -29% | $300,027,350 |
| NGD | New Gold Inc. | 4% | -8% | 8% | $985,356,235 |
| PUMA | Puma Exploration Inc. | 4% | 0% | -31% | $17,943,078 |
| VMS | Vortex Metals Inc. | 4% | 0% | -3% | $8,711,608 |
| MGG | Minaurum Gold Inc. | 4% | -3% | -19% | $54,997,901 |
| WM | Wallbridge Mining Company Limited | 4% | 7% | -19% | $126,153,530 |
| GLDC | Cassiar Gold Corp. | 4% | 1% | -19% | $42,114,619 |
| SSL | Sandstorm Gold Ltd. | 4% | -2% | -5% | $2,028,447,499 |
| SRG | SRG Mining Inc. | 3% | 37% | 31% | $101,301,881 |
| NDM | Northern Dynasty Minerals Ltd. | 3% | 0% | 0% | $158,933,816 |
| AII | Almonty Industries Inc. | 3% | -2% | -12% | $134,539,150 |
| GOLD | Goldmining Inc. | 3% | -14% | -22% | $204,220,037 |
| HCH | Hot Chili Limited | 3% | -2% | 19% | $111,084,042 |
| ABX | Barrick Gold Corporation | 3% | -2% | -3% | $39,373,791,571 |
| PTM | Platinum Group Metals Ltd. | 3% | -1% | -21% | $188,473,722 |
| SLI | Standard Lithium Ltd. | 3% | 8% | 50% | $1,036,513,182 |
| IMG | Iamgold Corporation | 3% | -2% | 1% | $1,673,493,765 |
| ELD | Eldorado Gold Corporation | 3% | -4% | 18% | $2,719,904,746 |
| TFPM | Triple Flag Precious Metals Corp. | 3% | -2% | -3% | $3,660,273,780 |
| EU | Encore Energy Corp. | 3% | 16% | 0% | $458,667,802 |
| DEF | Defiance Silver Corp. | 3% | 3% | -9% | $35,342,564 |
| VG | Volcanic Gold Mines Inc | 3% | -14% | -11% | $7,288,194 |
| TXG | Torex Gold Resources Inc. | 3% | -8% | 21% | $1,616,364,225 |
| NOAL | NOA Lithium Brines Inc | 3% | 34% | 550% | $59,888,621 |
| IMR | iMetal Resources Inc. | 3% | -21% | -27% | $8,395,210 |
| NCM | Newcrest Mining Limited | 3% | 3% | 25% | $21,094,902,968 |
| SGQ | SouthGobi Resources Ltd | 3% | -23% | 0% | $42,807,883 |
| POM | Polymet Mining Corp. | 3% | -47% | -71% | $202,238,661 |
| GMA | Geomega Resources Inc. | 3% | 3% | 40% | $24,819,641 |
| NGT | Newmont Corporation | 3% | 3% | -12% | $44,953,902,739 |
| ARIS | Aris Mining Corporation | 3% | -4% | -5% | $436,848,323 |
| MAG | MAG Silver Corp. | 3% | -8% | -30% | $1,522,832,650 |
| ESPN | Hispania Resources Inc. | 3% | 29% | 71% | $10,531,829 |
| GSHR | Goldshore Resources Inc. | 3% | -16% | -28% | $31,143,342 |
| CG | Centerra Gold Inc. | 3% | 7% | 13% | $1,737,338,315 |
| SSRM | SSR Mining Inc. | 3% | -5% | -11% | $3,834,944,486 |
| FNV | Franco-Nevada Corporation | 3% | -3% | 2% | $36,245,496,395 |
| FIL | Filo Corp | 3% | 22% | 11% | $3,356,637,836 |
| ARTG | Artemis Gold Inc. | 3% | 5% | 8% | $940,788,777 |
| LUG | Lundin Gold Inc. | 3% | -6% | 20% | $3,759,254,658 |
| ECU | Element 29 Resources Inc. | 3% | -3% | 28% | $16,132,622 |
| OSI | Osino Resources Corp. | 3% | 9% | 32% | $178,811,653 |
| FDY | Faraday Copper Corp. | 3% | 6% | 41% | $135,450,616 |
| MSV | Minco Silver Corporation | 3% | -5% | -5% | $11,594,766 |
| MGA | Mega Uranium Ltd. | 3% | 11% | -7% | $70,460,449 |
| OR | Osisko Gold Royalties Ltd | 3% | -3% | 25% | $3,766,826,566 |
| GAU | Galiano Gold Inc. | 3% | 7% | 11% | $179,954,762 |
| TUO | Teuton Resources Corp. | 3% | -7% | 14% | $69,389,726 |
| ATY | Atico Mining Corporation | 3% | 8% | -7% | $24,863,668 |
| HAR | Harfang Exploration inc. | 3% | 0% | 8% | $12,476,065 |
| ASCU | Arizona Sonoran Copper Company Inc. | 2% | -2% | -13% | $183,916,381 |
| ATX | ATEX Resources Inc. | 2% | -17% | 10% | $139,202,727 |
| STGO | Steppe Gold Ltd. | 2% | -12% | -24% | $72,676,002 |
| URC | Uranium Royalty Corp. | 2% | 4% | -17% | $264,975,351 |
| LIT | Argentina Lithium & Energy Corp. | 2% | -4% | -12% | $28,605,203 |
| MUX | McEwen Mining Inc. | 2% | -5% | 20% | $451,510,600 |
| GATO | Gatos Silver, Inc. | 2% | -19% | -10% | $345,119,493 |
| MKR | Melkior Resources Inc. | 2% | 0% | 18% | $7,314,788 |
| CXB | Calibre Mining Corp. | 2% | -9% | 54% | $633,246,826 |
| LCE | Century Lithium Corp. | 2% | 3% | 9% | $143,040,612 |
| AEM | Agnico Eagle Mines Limited | 2% | -3% | -6% | $32,715,146,315 |
| PRU | Perseus Mining Limited | 2% | -10% | -23% | $2,024,620,538 |
| CAD | Colonial Coal International Corp. | 2% | -4% | 19% | $276,084,669 |
| PRB | Probe Gold Inc. | 2% | -7% | 20% | $242,034,754 |
| AGI | Alamos Gold Inc. | 2% | -4% | 15% | $6,250,303,182 |
| CPS | Canadian Premium Sand Inc. | 2% | -6% | 21% | $39,634,987 |
| LGC | Lavras Gold Corp. | 2% | -23% | -18% | $10,481,487 |
| PE | Pure Energy Minerals Limited | 2% | 62% | 295% | $50,856,795 |
| ARG | Amerigo Resources Ltd. | 2% | 8% | 17% | $253,837,841 |
| SIL | SilverCrest Metals Inc. | 2% | -10% | -4% | $1,142,514,609 |
| MARI | Marimaca Copper Corp. | 2% | 9% | 30% | $369,730,959 |
| WPM | Wheaton Precious Metals Corp. | 2% | -5% | 8% | $25,906,693,268 |
| STU | Stuhini Exploration Ltd | 2% | -10% | -23% | $13,211,292 |
| TML | Treasury Metals Inc. | 2% | 2% | -16% | $39,387,908 |
| AE | American Eagle Gold Corp. | 2% | 62% | 38% | $26,362,941 |
| JZR | JZR Gold Inc. | 2% | 2% | 15% | $19,094,506 |
| WRX | Western Resources Corp. | 2% | -8% | 31% | $112,334,881 |
| CIA | Champion Iron Limited | 2% | -2% | -21% | $2,756,639,362 |
| PRYM | Prime Mining Corp. | 2% | -15% | -6% | $255,900,990 |
| NICU | Magna Mining Inc. | 2% | -8% | -31% | $96,955,049 |
| MMG | Metallic Minerals Corp. | 2% | -12% | 33% | $50,016,608 |
| LIRC | Lithium Royalty Corp. | 2% | -14% | 0% | $326,768,795 |
| AZM | Azimut Exploration Inc. | 2% | 13% | 65% | $99,886,055 |
| KRI | Kobo Resources Inc. | 2% | 13% | 22% | $23,463,146 |
| ZLTO | BULGOLD Inc. | 2% | 2% | 27% | $6,170,486 |
| BRC | Blackrock Silver Corp. | 2% | 3% | -33% | $59,698,856 |
| ELO | Eloro Resources Ltd. | 2% | 33% | -6% | $277,448,276 |
| FL | Frontier Lithium Inc. | 2% | 1% | -9% | $425,662,567 |
| BKM | Pacific Booker Minerals Inc. | 2% | -6% | -20% | $10,594,690 |
| EML | Electric Metals (USA) Limited | 2% | -9% | 125% | $31,644,288 |
| ERO | Ero Copper Corp. | 2% | 9% | 44% | $2,485,741,138 |
| OSK | Osisko Mining Inc. | 2% | 4% | -8% | $1,222,329,021 |
| AYA | Aya Gold & Silver Inc. | 2% | -7% | -6% | $987,614,023 |
| NB | NioCorp Developments Ltd. | 2% | -8% | -33% | $203,046,082 |
| NGEX | NGEx Minerals Ltd. | 1% | 8% | 135% | $1,251,284,595 |
| GWM | Galway Metals Inc. | 1% | -19% | -44% | $26,201,425 |
| PAAS | Pan American Silver Corp. | 1% | -5% | -13% | $7,033,674,900 |
| DAN | Arianne Phosphate Inc. | 1% | 3% | 10% | $81,675,847 |
| PPTA | Perpetua Resources Corp. | 1% | -18% | 23% | $306,352,030 |
| GUS | Angus Gold Inc. | 1% | -1% | 3% | $40,262,861 |
| DBG | Doubleview Gold Corp. | 1% | -5% | 12% | $76,958,401 |
| ION | Ion Energy Ltd. | 1% | -22% | 14% | $13,509,318 |
| BSR | Bluestone Resources Inc. | 1% | -7% | 10% | $74,935,214 |
| OGN | Orogen Royalties Inc. | 1% | 0% | -6% | $98,466,540 |
| ECOR | Ecora Resources plc | 1% | -6% | -15% | $531,266,083 |
| LAC | Lithium Americas Corp. | 1% | -7% | 4% | $4,279,460,270 |
| NOU | Nouveau Monde Graphite Inc. | 1% | -4% | -20% | $252,142,138 |
| LIF | Labrador Iron Ore Royalty Corporation | 1% | 1% | -7% | $1,989,120,000 |
| LA | Los Andes Copper Ltd. | 1% | 37% | 30% | $504,208,377 |
| LUN | Lundin Mining Corporation | 1% | 5% | 25% | $8,018,440,792 |
| NTR | Nutrien Ltd. | 1% | 6% | -21% | $38,671,918,616 |
| VGCX | Victoria Gold Corp. | 1% | -9% | 8% | $513,645,182 |
| BTO | B2Gold Corp. | 0% | -5% | -2% | $6,112,979,021 |
| DNG | Dynacor Group Inc. | 0% | 2% | 5% | $117,589,827 |
| SEA | Seabridge Gold Inc. | 0% | -11% | -6% | $1,321,219,117 |
| SML | Southstone Minerals Limited | 0% | 200% | 0% | $480,628 |
| MSC | Millennium Silver Corp. | 0% | 100% | 0% | $2,215,052 |
| CSL | Comstock Metals Ltd. | 0% | 75% | -13% | $1,038,519 |
| HUD | Hudson Resources Inc. | 0% | 60% | 33% | $7,265,702 |
| GRI | Galore Resources Inc. | 0% | 50% | -50% | $2,484,371 |
| PGDC | Patagonia Gold Corp. | 0% | 50% | 0% | $7,065,922 |
| PEX | Pacific Ridge Exploration Ltd. | 0% | 48% | 27% | $38,754,616 |
| HPM | Halcones Precious Metals Corp. | 0% | 43% | -47% | $4,527,856 |
| ATOM | Atomic Minerals Corporation | 0% | 40% | 40% | $2,179,611 |
| PMX | ProAm Explorations Corporation | 0% | 40% | 75% | $613,191 |
| SILV | Silver Valley Metals Corp. | 0% | 32% | 9% | $6,090,237 |
| SPD | Silver Predator Corp. | 0% | 29% | 50% | $2,660,387 |
| FPC | Falco Resources Ltd. | 0% | 28% | 52% | $42,094,571 |
| CMIL | Capella Minerals Limited | 0% | 25% | -50% | $4,880,255 |
| CRD | Copper Road Resources Inc. | 0% | 25% | -29% | $3,581,300 |
| DYG | Dynasty Gold Corp. | 0% | 25% | 267% | $20,152,906 |
| JUGR | Juggernaut Exploration Ltd. | 0% | 24% | 72% | $9,679,355 |
| DIA | Margaret Lake Diamonds Inc. | 0% | 23% | -8% | $853,421 |
| ETU | E2Gold Inc. | 0% | 20% | -25% | $4,685,027 |
| HCU | Horizon Copper Corp. | 0% | 20% | 20% | $61,992,181 |
| LONE | Lithium One Metals Inc. | 0% | 19% | -12% | $19,296,225 |
| MMS | MacArthur Minerals Limited | 0% | 19% | 27% | $31,474,163 |
| IRO | Inter-Rock Minerals Inc. | 0% | 18% | 40% | $18,734,781 |
| EUP | Europacific Metals Inc. | 0% | 17% | -36% | $1,818,851 |
| KORE | Kore Mining Ltd. | 0% | 17% | -13% | $7,063,922 |
| RMD | Richmond Minerals Inc. | 0% | 17% | 0% | $4,957,663 |
| ROCK | Rockridge Resources Ltd. | 0% | 17% | -13% | $4,380,307 |
| TUK | Tuktu Resources Ltd. | 0% | 17% | -30% | $5,810,459 |
| WRR | Walker River Resources Corp. | 0% | 16% | -56% | $5,940,298 |
| TGX | True North Gems Inc. | 0% | 15% | 7% | $2,368,301 |
| BCU | Bell Copper Corporation | 0% | 15% | 29% | $19,513,489 |
| NRN | Northern Shield Resources Inc. | 0% | 14% | -11% | $2,557,873 |
| SRI | Sparton Resources Inc. | 0% | 14% | -33% | $5,933,661 |
| TGOL | Thunder Gold Corp. | 0% | 14% | 0% | $6,716,033 |
| GBML | Global Battery Metals Ltd. | 0% | 13% | 42% | $13,265,990 |
| LSTR | Lodestar Battery Metals Corp | 0% | 11% | -50% | $2,216,825 |
| MINK | Mink Ventures Corporation | 0% | 11% | 94% | $2,320,709 |
| DHR | Discovery Harbour Resources Corp. | 0% | 10% | 10% | $519,803 |
| CBR | Cabral Gold Inc. | 0% | 10% | -15% | $20,490,297 |
| FKM | Fokus Mining Corporation | 0% | 8% | 8% | $6,793,722 |
| GLDN | Golden Ridge Resources Ltd. | 0% | 8% | -26% | $4,090,892 |
| TWO | T2 Metals Corp. | 0% | 8% | -52% | $6,069,844 |
| ASTR | Astra Exploration Inc. | 0% | 7% | 36% | $7,147,931 |
| ZNG | Group Eleven Resources Corp. | 0% | 7% | 15% | $13,122,613 |
| MINE | Inomin Mines Inc | 0% | 7% | 25% | $3,057,084 |
| ABZ | AsiaBaseMetals Inc. | 0% | 7% | 52% | $7,881,602 |
| BRG | Brigadier Gold Limited | 0% | 7% | 129% | $10,757,957 |
| GZD | Grizzly Discoveries Inc. | 0% | 7% | -27% | $11,017,381 |
| SMRV | Smooth Rock Ventures Corp. | 0% | 6% | 113% | $2,097,357 |
| PGZ | Pan Global Resources Inc. | 0% | 6% | -24% | $74,250,575 |
| SAGE | Sage Potash Corp. | 0% | 6% | 0% | $19,284,208 |
| GUN | Gunpoint Exploration Ltd. | 0% | 5% | 18% | $30,028,010 |
| GTWO | G2 Goldfields Inc. | 0% | 5% | 17% | $131,772,096 |
| EP | Empire Metals Corp. | 0% | 5% | 17% | $10,321,387 |
| AAG | Aftermath Silver Ltd. | 0% | 5% | -13% | $47,675,093 |
| GGI | Garibaldi Resources Corp. | 0% | 4% | -28% | $19,222,399 |
| WCU | World Copper Ltd. | 0% | 3% | -6% | $20,001,120 |
| BMV | Bathurst Metals Corp. | 0% | 3% | 27% | $4,136,197 |
| TORQ | Torq Resources Inc. | 0% | 1% | -45% | $46,354,615 |
| EFF | 1844 Resources Inc. | 0% | 0% | 17% | $2,433,174 |
| AFF | Affinity Metals Corp. | 0% | 0% | 0% | $1,410,963 |
| AVX | Altair Resources Inc. | 0% | 0% | 0% | $1,145,332 |
| ALT | Alturas Minerals Corp. | 0% | 0% | 0% | $2,912,643 |
| AL | ALX Resources Corp. | 0% | 0% | -25% | $5,859,599 |
| AMR | AM Resources Corp. | 0% | 0% | -29% | $3,480,746 |
| APMI | Apogee Minerals Ltd. | 0% | 0% | -14% | $1,267,800 |
| ARJN | Aranjin Resources Ltd. | 0% | 0% | 33% | $5,438,457 |
| ASL | Argentum Silver Corp. | 0% | 0% | 13% | $2,321,934 |
| AUGC | Au Gold Corp. | 0% | 0% | -29% | $841,396 |
| AUN | Aurcana Silver Corporation | 0% | 0% | 50% | $4,636,973 |
| AUL | Aurelius Minerals Inc. | 0% | 0% | -71% | $1,075,056 |
| AU | Aurion Resources Ltd. | 0% | 0% | -3% | $70,267,418 |
| AVU | Avrupa Minerals Ltd. | 0% | 0% | 100% | $2,660,238 |
| BTT | Bitterroot Resources Ltd. | 0% | 0% | 14% | $3,747,342 |
| BXR | Blue River Resources Ltd. | 0% | 0% | -67% | $1,252,926 |
| BLUE | Blue Thunder Mining Inc. | 0% | 0% | 113% | $1,849,782 |
| BDGC | Boundary Gold and Copper Mining Ltd. | 0% | 0% | 0% | $473,502 |
| AMMO | Bullet Exploration Inc. | 0% | 0% | 67% | $535,412 |
| BGD | Bullion Gold Resources Corp. | 0% | 0% | -29% | $1,337,705 |
| BURG | Burin Gold Corp. | 0% | 0% | -13% | $1,342,255 |
| CONE | Canada One Mining Corp. | 0% | 0% | 0% | $2,713,615 |
| CLZ | Canasil Resources Inc. | 0% | 0% | -43% | $2,742,952 |
| CD | Cantex Mine Development Corp. | 0% | 0% | 5% | $16,897,639 |
| CXG | Canxgold Mining Corp. | 0% | 0% | -20% | $756,998 |
| CZZ | Cleghorn Minerals Ltd. | 0% | 0% | -23% | $1,575,193 |
| COCO | Coast Copper Corp. | 0% | 0% | 0% | $2,880,076 |
| CMD | Commander Resources Ltd. | 0% | 0% | -6% | $2,977,117 |
| CVB | Compass Gold Corporation | 0% | 0% | 0% | $7,797,783 |
| CQR | Conquest Resources Limited | 0% | 0% | -20% | $2,705,542 |
| CRTS | Cortus Metals Inc. | 0% | 0% | 0% | $950,453 |
| DNO | Dinero Ventures Ltd. | 0% | 0% | -48% | $2,664,000 |
| DCY | Discovery-Corp Enterprises Inc. | 0% | 0% | 0% | $855,197 |
| ENEV | Enerev5 Metals Inc. | 0% | 0% | -50% | $3,616,241 |
| EVX | European Electric Metals Inc. | 0% | 0% | 50% | $24,145,326 |
| FCO | Fabled Silver Gold Corp. | 0% | 0% | -44% | $3,016,253 |
| FEX | Fjordland Exploration Inc. | 0% | 0% | 0% | $2,488,066 |
| FRI | Freeport Resources Inc. | 0% | 0% | 40% | $5,506,439 |
| FGC | Frontline Gold Corporation | 0% | 0% | 100% | $2,617,073 |
| GGX | GGX Gold Corp. | 0% | 0% | -9% | $1,442,149 |
| AUU | Gold79 Mines Ltd. | 0% | 0% | 20% | $6,087,395 |
| GLB | Goldbank Mining Corporation | 0% | 0% | 64% | $12,593,039 |
| GHR | Golden Harp Resources Inc. | 0% | 0% | -11% | $2,397,399 |
| GSH | Golden Share Resources Corporation | 0% | 0% | -25% | $2,168,386 |
| GSS | Gossan Resources Limited | 0% | 0% | 18% | $3,340,074 |
| GGM | Granada Gold Mine Inc. | 0% | 0% | 0% | $4,516,285 |
| GYA | Guyana Goldstrike Inc. | 0% | 0% | 0% | $4,850,332 |
| HCC | Hanna Capital Corp. | 0% | 0% | 0% | $851,592 |
| HAN | Hannan Metals Ltd. | 0% | 0% | -24% | $27,290,392 |
| HVG | Harvest Gold Corp. | 0% | 0% | -43% | $783,313 |
| IRI | IEMR Resources Inc. | 0% | 0% | 50% | $1,422,107 |
| ICON | International Iconic Gold Exploration Co | 0% | 0% | 0% | $2,026,509 |
| IZN | InZinc Mining Ltd. | 0% | 0% | 20% | $3,702,063 |
| JADE | Jade Leader Corp. | 0% | 0% | 33% | $2,595,292 |
| JDN | Jayden Resources Inc. | 0% | 0% | -31% | $5,851,785 |
| JUB | Jubilee Gold Exploration Ltd. | 0% | 0% | 2% | $3,503,094 |
| KEN | Kenadyr Metals Corp. | 0% | 0% | 0% | $531,178 |
| KLM | Kermode Resources Ltd. | 0% | 0% | -50% | $848,790 |
| KING | King Global Ventures Inc. | 0% | 0% | -20% | $623,042 |
| LITH | Lithium Chile Inc. | 0% | 0% | 38% | $167,041,567 |
| LEX | Longhorn Exploration Corp. | 0% | 0% | -9% | $1,267,200 |
| MT | M3 Metals Corp. | 0% | 0% | 19% | $1,440,880 |
| MGI | Magnum Goldcorp Inc. | 0% | 0% | 0% | $965,490 |
| MCM | Matachewan Consolidated Mines, Limited | 0% | 0% | 0% | $0 |
| MCS | McChip Resources Inc. | 0% | 0% | 13% | $5,081,985 |
| MED | Medgold Resources Corp. | 0% | 0% | 0% | $673,945 |
| MVM.H | MillenMin Ve | 0% | 0% | 0% | $2,105,000 |
| MHI | Mineral Hill Industries Ltd. | 0% | 0% | 0% | $2,665,601 |
| MNTO | Minto Metals Corp. | 0% | 0% | -46% | $64,167,138 |
| MLY | Multi-Metal Development Ltd. | 0% | 0% | 300% | $10,054,388 |
| NER | Newmac Resources Inc. | 0% | 0% | 0% | $2,769,072 |
| NRG | Newrange Gold Corp. | 0% | 0% | 0% | $3,397,844 |
| NORA | Norra Metals Corp. | 0% | 0% | -25% | $1,639,899 |
| NVT | Nortec Minerals Corp. | 0% | 0% | 20% | $1,529,009 |
| NL | Northern Lion Gold Corp. | 0% | 0% | 13% | $2,926,709 |
| PP | Pacific Silk Road Resources Group Inc. | 0% | 0% | 0% | $833,564 |
| PAN | Pangolin Diamonds Corp. | 0% | 0% | 0% | $931,163 |
| PEGA | Pegasus Resources Inc. | 0% | 0% | -43% | $997,420 |
| PGC | Plato Gold Corp. | 0% | 0% | -20% | $4,567,314 |
| POR | Portofino Resources Inc. | 0% | 0% | 60% | $5,921,714 |
| QGR | Q-Gold Resources Ltd. | 0% | 0% | -50% | $839,980 |
| QZM | Quartz Mountain Resources Ltd. | 0% | 0% | -13% | $9,869,432 |
| RMO | Rainy Mountain Royalty Corp. | 0% | 0% | -17% | $2,600,018 |
| RTH | Rathdowney Resources Ltd. | 0% | 0% | -25% | $6,912,824 |
| RCT | Rochester Resources Ltd. | 0% | 0% | 33% | $942,883 |
| SRE | Saville Resources Inc. | 0% | 0% | -33% | $1,018,466 |
| SGN | Scorpio Gold Corporation | 0% | 0% | 13% | $9,492,150 |
| SGU | Signature Resources Ltd. | 0% | 0% | -54% | $1,654,189 |
| SBMI | Silver Bullet Mines Corp. | 0% | 0% | -27% | $10,004,628 |
| SVG | Silver Grail Resources Ltd. | 0% | 0% | 50% | $3,023,516 |
| SPA | Spanish Mountain Gold Ltd. | 0% | 0% | 15% | $70,563,526 |
| SHL | Spruce Ridge Resources Ltd. | 0% | 0% | 0% | $10,812,432 |
| STND | Standard Uranium Ltd. | 0% | 0% | -54% | $5,462,899 |
| TORA | Taura Gold Inc. | 0% | 0% | 20% | $5,436,563 |
| TRA | Teras Resources Inc. | 0% | 0% | -33% | $2,510,951 |
| TES | Tesoro Minerals Corp. | 0% | 0% | 0% | $1,980,351 |
| MAC | Themac Resources Group Limited | 0% | 0% | 20% | $2,382,004 |
| TFM | Transforma Resources Corporation | 0% | 0% | 0% | $714,098 |
| TVI | Tvi Pacific Inc. | 0% | 0% | 0% | $16,874,676 |
| TYMB | Tymbal Resources Ltd. | 0% | 0% | 0% | $538,263 |
| UNV | Universal Copper Ltd. | 0% | 0% | -20% | $2,129,983 |
| UVN | Uravan Minerals Inc. | 0% | 0% | 17% | $2,489,805 |
| VQA | Valterra Resource Corporation | 0% | 0% | -25% | $1,353,048 |
| VSR | Vanstar Mining Resources Inc. | 0% | 0% | 18% | $20,754,165 |
| VAX | Vantex Resources Ltd. | 0% | 0% | 7% | $721,385 |
| VLV | Venerable Ventures Ltd. | 0% | 0% | 0% | $1,553,988 |
| VOX | Vox Royalty Corp. | 0% | 0% | 0% | $153,073,280 |
| WGF | Wescan Goldfields Inc. | 0% | 0% | 0% | $2,003,373 |
| WA | Western Atlas Resources Inc | 0% | 0% | -50% | $2,351,068 |
| WGLD | Western Gold Exploration Ltd. | 0% | 0% | 0% | $4,112,562 |
| WMG | Western Magnesium Corporation | 0% | 0% | 16% | $50,222,715 |
| LR | Luminex Resources Corp. | 0% | -2% | 0% | $49,000,630 |
| UCU | Ucore Rare Metals Inc. | 0% | -3% | 43% | $54,462,517 |
| VIO | Vior Inc. | 0% | -3% | 60% | $16,232,803 |
| CGD | Carlin Gold Corporation | 0% | -3% | -28% | $2,021,872 |
| GBU | Gabriel Resources Ltd. | 0% | -4% | -14% | $281,992,567 |
| APN | Altiplano Metals Inc. | 0% | -5% | -34% | $11,621,703 |
| SYH | Skyharbour Resources Ltd. | 0% | -5% | -4% | $57,365,921 |
| VLI | Vision Lithium Inc. | 0% | -6% | -29% | $21,636,961 |
| DCOP | District Copper Corp. | 0% | -6% | 88% | $1,368,312 |
| ENDR | Enduro Metals Corporation | 0% | -6% | -38% | $16,869,646 |
| GDX | Goldex Resources Corporation | 0% | -6% | 25% | $1,470,265 |
| IVS | Inventus Mining Corp. | 0% | -7% | -7% | $11,757,543 |
| APX | Apex Resources Inc. | 0% | -8% | 20% | $2,169,747 |
| BMM | Black Mammoth Metals Corporation | 0% | -8% | -14% | $1,365,225 |
| RYR | Royal Road Minerals Limited | 0% | -8% | 4% | $31,883,496 |
| ZBNI | Zeb Nickel Corp. | 0% | -8% | 125% | $10,017,707 |
| STRR | Star Royalties Ltd. | 0% | -8% | -1% | $26,611,405 |
| ANE | Altan Nevada Minerals Limited | 0% | -8% | 57% | $766,100 |
| BNZ | Bonanza Mining Corporation | 0% | -8% | -8% | $2,746,821 |
| ERC | Eros Resources Corp. | 0% | -9% | -9% | $4,894,687 |
| BMEX | BMEX Gold Inc. | 0% | -10% | -18% | $3,422,854 |
| COR | Camino Minerals Corporation | 0% | -10% | 157% | $15,599,706 |
| MCI | Minnova Corp. | 0% | -10% | -10% | $3,144,968 |
| NAM | New Age Metals Inc. | 0% | -10% | -25% | $8,885,480 |
| PTU | Purepoint Uranium Group Inc. | 0% | -10% | -31% | $15,470,479 |
| RUG | Rugby Resources Ltd. | 0% | -10% | -36% | $10,878,773 |
| SVE | Silver One Resources Inc. | 0% | -10% | 15% | $75,880,787 |
| STH | Stelmine Canada Ltd. | 0% | -11% | -26% | $11,649,236 |
| AXM | AXMIN Inc. | 0% | -11% | 14% | $7,484,369 |
| LL | Canada Rare Earth Corp. | 0% | -11% | 33% | $8,396,308 |
| FUSE | Fuse Battery Metals Inc. | 0% | -11% | -38% | $7,517,952 |
| NOB | Noble Mineral Exploration Inc. | 0% | -11% | -38% | $8,956,860 |
| VLC | Velocity Minerals Ltd. | 0% | -11% | -23% | $28,026,150 |
| GRSL | GR Silver Mining Ltd. | 0% | -12% | -35% | $17,360,985 |
| HMLO | Hemlo Explorers Inc. | 0% | -12% | -6% | $3,306,036 |
| AHR | Amarc Resources Ltd. | 0% | -12% | -27% | $20,526,318 |
| AWM | Angel Wing Metals Inc. | 0% | -13% | 17% | $14,123,111 |
| CBLT | CBLT Inc. | 0% | -13% | 0% | $2,666,198 |
| EON | EON Lithium Corp. | 0% | -13% | -53% | $1,216,450 |
| FYL | Finlay Minerals Ltd. | 0% | -13% | -59% | $4,830,004 |
| QCX | QCX Gold Corp. | 0% | -13% | 75% | $2,295,521 |
| RYO | Rio Silver Inc. | 0% | -13% | 40% | $2,913,570 |
| SXL | SLAM Exploration Ltd. | 0% | -13% | 40% | $2,371,732 |
| SB | Stratabound Minerals Corp. | 0% | -13% | -22% | $7,664,190 |
| ATI | Altai Resources Inc. | 0% | -13% | -19% | $3,642,181 |
| GVR | Grosvenor Resource Corporation | 0% | -13% | 0% | $1,748,545 |
| AUQ | AuQ Gold Mining Inc. | 0% | -14% | -52% | $2,100,235 |
| BWR | BWR Exploration Inc. | 0% | -14% | 20% | $3,180,314 |
| CLV | Canoe Mining Ventures Corp. | 0% | -14% | -14% | $1,448,419 |
| CBI | Colibri Resource Corporation | 0% | -14% | 33% | $5,803,598 |
| FAIR | Fairchild Gold Corp. | 0% | -14% | -14% | $1,654,640 |
| GSTM | Goldstorm Metals Corp. | 0% | -14% | -25% | $11,565,122 |
| GR | Great Atlantic Resources Corp. | 0% | -14% | -45% | $1,253,142 |
| HPY | Happy Creek Minerals Ltd. | 0% | -14% | 0% | $3,979,259 |
| ROAR | Lion Rock Resources Inc. | 0% | -14% | -26% | $2,120,242 |
| TORO | Pucara Gold Ltd. | 0% | -14% | -25% | $2,297,759 |
| STA | Sanatana Resources Inc. | 0% | -14% | -50% | $2,269,525 |
| MJS | Majestic Gold Corp. | 0% | -15% | -15% | $93,839,794 |
| MN | Manganese X Energy Corp. | 0% | -15% | -22% | $17,739,107 |
| GCX | Granite Creek Copper Ltd. | 0% | -15% | -8% | $8,391,061 |
| SOI | Sirios Resources Inc. | 0% | -15% | -21% | $14,758,217 |
| TORC | TinOne Resources Inc. | 0% | -15% | 38% | $9,098,501 |
| USCU | US Copper Corp. | 0% | -15% | -8% | $6,333,504 |
| FISH | Sailfish Royalty Corp. | 0% | -15% | -25% | $59,154,098 |
| LORD | St. James Gold Corp. | 0% | -16% | -34% | $5,465,878 |
| NCX | NorthIsle Copper and Gold Inc. | 0% | -16% | 0% | $34,067,830 |
| ANZ | Alianza Minerals Ltd. | 0% | -17% | -17% | $3,984,749 |
| AEC | Anfield Energy Inc. | 0% | -17% | -17% | $33,942,914 |
| CCW | Canada Silver Cobalt Works Inc. | 0% | -17% | -41% | $11,740,273 |
| ELVT | Elevation Gold Mining Corporation | 0% | -17% | 4% | $13,821,619 |
| JAX | Jaxon Mining Inc. | 0% | -17% | -29% | $3,360,073 |
| LMR | Lomiko Metals Inc. | 0% | -17% | 0% | $10,533,449 |
| PNTR | Pantera Silver Corp. | 0% | -17% | -35% | $2,835,706 |
| SNS | Select Sands Corp. | 0% | -17% | -44% | $2,162,918 |
| NIKL | GK Resources Ltd. | 0% | -18% | 44% | $2,002,174 |
| GGO | Galleon Gold Corp. | 0% | -18% | 0% | $11,432,642 |
| HAWK | Hawkeye Gold & Diamond Inc. | 0% | -18% | -55% | $441,898 |
| XGC | Xali Gold Corp. | 0% | -18% | -44% | $6,272,543 |
| BAG | Blende Silver Corp. | 0% | -20% | -20% | $1,419,022 |
| ROX | Canstar Resources Inc. | 0% | -20% | -50% | $3,861,989 |
| CIO | Central Iron Ore Limited | 0% | -20% | 20% | $1,454,235 |
| C | Contact Gold Corp. | 0% | -20% | 0% | $8,807,666 |
| CPL | Copper Lake Resources Ltd. | 0% | -20% | -43% | $9,465,431 |
| EDDY | Edison Lithium Corp. | 0% | -20% | 0% | $4,607,252 |
| GCC | Golden Cariboo Resources Ltd. | 0% | -20% | 20% | $2,612,041 |
| GDP | Golden Pursuit Resources Ltd. | 0% | -20% | -26% | $5,458,992 |
| MCU | Mega Copper Ltd. | 0% | -20% | -31% | $4,250,750 |
| MEX | Mexican Gold Mining Corp. | 0% | -20% | -47% | $1,698,742 |
| NED | New Destiny Mining Corp. | 0% | -20% | 0% | $452,113 |
| SHRP | Sherpa II Holdings Corp. | 0% | -20% | -20% | $625,240 |
| TKU | Tarku Resources Ltd. | 0% | -20% | -43% | $4,389,544 |
| TVC.H | Three Valley | 0% | -20% | -20% | $2,249,277 |
| RYE | Rhyolite Resources Ltd. | 0% | -21% | -63% | $5,895,189 |
| STUV | Stuve Gold Corp. | 0% | -21% | -21% | $1,630,667 |
| ZACA | Zacapa Resources Ltd. | 0% | -22% | -61% | $3,533,689 |
| ALM | Alliance Mining Corp. | 0% | -25% | -32% | $1,311,647 |
| ADD | Arctic Star Exploration Corp. | 0% | -25% | -40% | $3,046,006 |
| AMZ | Azucar Minerals Ltd. | 0% | -25% | 9% | $4,429,742 |
| BM | BC Moly Ltd. | 0% | -25% | -30% | $3,636,997 |
| INFD | Infield Minerals Corp. | 0% | -25% | -50% | $731,741 |
| NNX | Nickel North Exploration Corp. | 0% | -25% | -50% | $1,506,532 |
| QURI | Quri-Mayu Developments Ltd. | 0% | -25% | -60% | $1,341,910 |
| SPX | Stellar AfricaGold Inc. | 0% | -25% | 0% | $3,340,574 |
| VIZ | Visionary Gold Corp. | 0% | -25% | 100% | $7,669,203 |
| MTS | Metallis Resources Inc. | 0% | -27% | -59% | $3,329,937 |
| STUD | Stallion Discoveries Corp. | 0% | -27% | 109% | $20,944,375 |
| CML | CaNickel Mining Limited | 0% | -27% | 0% | $3,001,630 |
| ADZ | Adamera Minerals Corp. | 0% | -29% | -64% | $5,736,823 |
| BGS | Baroyeca Gold & Silver Inc. | 0% | -29% | -50% | $1,662,119 |
| MTT | Magna Terra Minerals Inc. | 0% | -29% | -38% | $1,737,847 |
| SNG | Silver Range Resources Ltd. | 0% | -29% | -33% | $9,340,441 |
| BME | Barsele Minerals Corp. | 0% | -29% | -37% | $21,990,306 |
| STRM | Storm Exploration Inc. | 0% | -29% | -39% | $3,538,778 |
| DG | Dixie Gold Inc. | 0% | -29% | -14% | $1,672,917 |
| EMO | Emerita Resources Corp. | 0% | -30% | -49% | $76,152,524 |
| FMM | Full Metal Minerals Ltd. | 0% | -31% | 0% | $3,260,535 |
| AGD | Antioquia Gold Inc. | 0% | -33% | -33% | $14,240,972 |
| AZR | Azarga Metals Corp. | 0% | -33% | -60% | $2,080,794 |
| GQ | Great Quest Fertilizer Ltd. | 0% | -33% | -71% | $848,461 |
| MILL | Millbank Mining Corp. | 0% | -33% | -13% | $1,148,600 |
| MMN | Monarca Minerals Inc. | 0% | -33% | -33% | $1,265,546 |
| TTS | Tintina Mines Ltd. | 0% | -33% | 0% | $918,099 |
| VZZ | Val-d'Or Mining Corporation | 0% | -33% | 0% | $7,428,191 |
| WRI | Waseco Resources Inc. | 0% | -33% | -33% | $833,628 |
| GLW | Galway Gold Inc. | 0% | -36% | -25% | $1,873,259 |
| BARU | Baru Gold Corp. | 0% | -38% | 25% | $5,474,838 |
| GEMC | Global Energy Metals Corporation | 0% | -38% | -17% | $2,137,826 |
| HWY | Highway 50 Gold Corp. | 0% | -38% | -20% | $4,577,421 |
| TCO | Transatlantic Mining Corp. | 0% | -38% | 150% | $4,331,996 |
| VTT | Vendetta Mining Corp. | 0% | -38% | 0% | $13,543,384 |
| BFM | Bedford Metals Corp. | 0% | -44% | -30% | $775,209 |
| NEWO | NewOrigin Gold Corp. | 0% | -45% | -33% | $1,706,750 |
| AIS | A.I.S. Resources Limited | 0% | -50% | -67% | $2,042,154 |
| ADY | Adyton Resources Corporation | 0% | -50% | -75% | $1,489,419 |
| AAU | Angold Resources Ltd. | 0% | -50% | -70% | $1,085,289 |
| LKY | Lucky Minerals Inc. | 0% | -50% | -63% | $3,046,908 |
| PGP | Power Group Projects Corp. | 0% | -50% | -33% | $1,195,606 |
| URE | Ur-Energy Inc. | 0% | 15% | -13% | $362,675,721 |
| BSX | Belo Sun Mining Corp. | 0% | 8% | -18% | $31,853,867 |
| ORE | Orezone Gold Corporation | 0% | 1% | -1% | $453,441,166 |
| MNO | Meridian Mining UK Societas | 0% | 0% | 24% | $100,646,180 |
| NCF | Northcliff Resources Ltd. | 0% | 0% | 40% | $8,950,278 |
| SBR | Silver Bear Resources plc | 0% | 0% | 0% | $33,916,481 |
| EQX | Equinox Gold Corp. | 0% | -1% | 37% | $1,899,394,184 |
| AR | Argonaut Gold Inc. | 0% | -2% | 2% | $458,165,783 |
| CCM | Canagold Resources Ltd. | 0% | -2% | 36% | $33,537,902 |
| ERD | Erdene Resource Development Corporation | 0% | -3% | 30% | $125,706,137 |
| S | Sherritt International Corporation | 0% | -4% | -8% | $190,698,566 |
| FF | First Mining Gold Corp. | 0% | -8% | -15% | $136,330,370 |
| FT | Fortune Minerals Limited | 0% | -10% | -31% | $18,705,754 |
| SCY | Scandium International Mining Corp. | 0% | -10% | -31% | $16,013,737 |
| GENM | Generation Mining Limited | 0% | -13% | -45% | $76,909,311 |
| RTG | RTG Mining Inc. | 0% | -17% | -9% | $41,936,073 |
| SVB | Silver Bull Resources, Inc. | 0% | -23% | -8% | $6,065,711 |
| SMC | Sulliden Mining Capital Inc. | 0% | -38% | -29% | $3,848,279 |
| AMC | Arizona Metals Corp. | 0% | -16% | -29% | $353,927,502 |
| EDV | Endeavour Mining plc | 0% | -6% | 10% | $7,865,741,476 |
| ISO | IsoEnergy Ltd. | 0% | 3% | -11% | $288,707,447 |
| OGC | OceanaGold Corporation | 0% | -8% | 1% | $1,848,683,395 |
| FM | First Quantum Minerals Ltd. | -1% | 5% | 11% | $21,717,753,668 |
| IFOS | Itafos Inc. | -1% | -13% | 0% | $265,277,076 |
| LI | American Lithium Corp. | -1% | 5% | -5% | $570,929,504 |
| CGG | China Gold International Resources Corp. Ltd. | -1% | -6% | 27% | $1,986,032,903 |
| DPM | Dundee Precious Metals Inc. | -1% | -6% | 34% | $1,641,603,451 |
| GMIN | G Mining Ventures Corp. | -1% | -2% | 58% | $487,793,595 |
| CNRI | Canadian North Resources Inc. | -1% | -11% | -18% | $208,159,868 |
| WRN | Western Copper and Gold Corporation | -1% | -1% | -15% | $330,128,704 |
| VMXX | Valhalla Metals Inc. | -1% | 9% | 37% | $16,807,985 |
| MRZ | Mirasol Resources Ltd. | -1% | -22% | 38% | $61,711,056 |
| MPVD | Mountain Province Diamonds Inc. | -1% | -1% | -9% | $98,366,773 |
| LGD | Liberty Gold Corp. | -1% | -7% | -24% | $138,853,327 |
| REG | Regulus Resources Inc. | -1% | 9% | -22% | $107,077,583 |
| DSV | Discovery Silver Corp. | -1% | -22% | -40% | $327,915,636 |
| CEE | Centamin plc | -1% | -11% | -18% | $1,749,233,369 |
| BYN | Banyan Gold Corp. | -1% | -6% | -8% | $105,403,213 |
| LBNK | LithiumBank Resources Corp. | -1% | 1% | 45% | $57,146,406 |
| ZEN | Zentek Ltd. | -1% | -8% | 1% | $206,035,343 |
| WGO | White Gold Corp. | -2% | -10% | -26% | $51,360,224 |
| MAU | Montage Gold Corp. | -2% | -6% | -7% | $116,553,081 |
| FMS | Focus Graphite Inc. | -2% | -3% | -37% | $17,377,381 |
| NRM | Noram Lithium Corp. | -2% | -13% | -9% | $53,344,567 |
| TUD | Tudor Gold Corp. | -2% | -16% | 14% | $244,565,799 |
| HIGH | Highgold Mining Inc. | -2% | -12% | -12% | $50,854,880 |
| ETG | Entree Resources Ltd. | -2% | -3% | 0% | $229,594,111 |
| ARK | Arras Minerals Corp. | -2% | 0% | -38% | $19,181,232 |
| GLAD | Gladiator Metals Corp. | -2% | -15% | 165% | $15,396,225 |
| WHN | Westhaven Gold Corp. | -2% | -15% | -27% | $37,255,381 |
| ATCU | Alta Copper Corp. | -2% | 2% | -5% | $40,170,947 |
| KNT | K92 Mining Inc. | -2% | -2% | -25% | $1,342,784,798 |
| ALTA | Altamira Gold Corp. | -2% | 67% | -15% | $38,478,403 |
| GIGA | Giga Metals Corporation | -2% | 2% | -21% | $23,986,511 |
| TDG | TDG Gold Corp. | -2% | -13% | -9% | $24,806,520 |
| SSVR | Summa Silver Corp. | -2% | -26% | -39% | $44,292,561 |
| HZM | Horizonte Minerals Plc. | -2% | 11% | 3% | $658,508,320 |
| IVN | Ivanhoe Mines Ltd. | -2% | 14% | 13% | $14,742,666,402 |
| WVM | West Vault Mining Inc. | -2% | 1% | 6% | $54,055,778 |
| OM | Osisko Metals Incorporated | -2% | -12% | 18% | $56,539,735 |
| LUC | Lucara Diamond Corp. | -2% | 0% | -8% | $213,652,070 |
| NVO | Novo Resources Corp. | -2% | -16% | -25% | $65,455,773 |
| ASM | Avino Silver & Gold Mines Ltd. | -2% | -10% | -8% | $103,700,048 |
| CNC | Canada Nickel Company Inc. | -2% | -2% | -39% | $175,015,716 |
| RDG | Ridgeline Minerals Corp. | -2% | -7% | -16% | $19,128,434 |
| LRA | Lara Exploration Ltd. | -2% | 10% | 4% | $36,182,801 |
| CPAU | Copaur Minerals Inc. | -2% | 3% | -10% | $23,614,447 |
| SGI | Superior Gold Inc. | -3% | 18% | -17% | $24,066,898 |
| NAU | Nevgold Corp. | -3% | 10% | 26% | $26,426,276 |
| ELE | Elemental Altus Royalties Corp. | -3% | -2% | -10% | $213,506,481 |
| SUP | Northern Superior Resources Inc. | -3% | -6% | -9% | $54,633,563 |
| CUSN | Cornish Metals Inc. | -3% | -5% | -40% | $107,054,142 |
| KRR | Karora Resources Inc. | -3% | -10% | -13% | $700,378,861 |
| BBB | Brixton Metals Corporation | -3% | 13% | -40% | $68,553,010 |
| CRE | Critical Elements Lithium Corporation | -3% | -10% | -16% | $376,768,569 |
| AUAU | Allegiant Gold Ltd. | -3% | -11% | -13% | $17,495,436 |
| QMC | QMC Quantum Minerals Corp. | -3% | -13% | 43% | $15,132,286 |
| GRD | Grounded Lithium Corp. | -3% | -23% | -55% | $11,493,310 |
| ROS | Roscan Gold Corporation | -3% | -6% | -9% | $60,648,064 |
| VAU | Viva Gold Corp. | -3% | -11% | 14% | $17,075,380 |
| BMR | Battery Mineral Resources Corp. | -3% | -14% | 7% | $29,292,662 |
| MKO | Mako Mining Corp. | -3% | -30% | -9% | $84,905,985 |
| ELEC | Electric Royalties Ltd. | -3% | 5% | 13% | $29,484,475 |
| AEMC | Alaska Energy Metals Corporation | -3% | -6% | 34% | $11,911,090 |
| SR | Strategic Resources Inc. | -3% | -6% | -11% | $109,966,296 |
| MAI | Minera Alamos Inc. | -3% | -5% | -30% | $138,956,369 |
| TLG | Troilus Gold Corp. | -3% | -12% | -2% | $105,602,521 |
| ORM | Orford Mining Corporation | -3% | 15% | 114% | $26,067,407 |
| DEX | Almadex Minerals Ltd. | -3% | 0% | -17% | $18,302,383 |
| ADZN | Adventus Mining Corporation | -3% | -6% | -44% | $53,889,034 |
| MSA | Mineros S.A. | -3% | -5% | -14% | $179,842,441 |
| RVG | Revival Gold Inc. | -3% | -16% | -28% | $46,160,036 |
| NCAU | Newcore Gold Ltd. | -3% | -19% | -37% | $20,067,052 |
| ABRA | AbraSilver Resource Corp. | -3% | -7% | -19% | $149,702,131 |
| SLVR | Silver Tiger Metals Inc. | -3% | -11% | -23% | $77,519,540 |
| FVL | Freegold Ventures Limited | -3% | -27% | -4% | $178,287,084 |
| SAM | Starcore International Mines Ltd. | -3% | 0% | -7% | $7,790,559 |
| TSLV | Tier One Silver Inc. | -4% | 32% | -7% | $41,276,104 |
| ATC | ATAC Resources Ltd. | -4% | -4% | 80% | $29,902,627 |
| NEW | New Target Mining Corp. | -4% | -4% | 80% | $1,618,156 |
| BNCH | Benchmark Metals Inc. | -4% | -23% | -31% | $68,595,027 |
| NHK | Nighthawk Gold Corp. | -4% | -13% | 46% | $66,850,634 |
| IE | Ivanhoe Electric Inc. | -4% | 6% | 5% | $1,607,423,241 |
| ME | Moneta Gold Inc. | -4% | -5% | -29% | $129,345,787 |
| GXU | GoviEx Uranium Inc. | -4% | 8% | -26% | $87,415,011 |
| AOT | Ascot Resources Ltd. | -4% | -10% | 0% | $288,889,716 |
| NWX | Newport Exploration Ltd. | -4% | 0% | -23% | $26,922,868 |
| USHA | Usha Resources Ltd. | -4% | -7% | 0% | $12,195,985 |
| APGO | Apollo Silver Corp. | -4% | -19% | -29% | $21,807,549 |
| WMK | Whitemud Resources Inc. | -4% | 4% | 243% | $4,083,156 |
| XYZ | Anacortes Mining Corp. | -4% | -3% | -20% | $15,329,562 |
| SMD | Strategic Metals Ltd. | -4% | -4% | -11% | $26,629,432 |
| GMX | Globex Mining Enterprises Inc. | -4% | -3% | 4% | $39,765,842 |
| OCO | Oroco Resource Corp. | -4% | -5% | -22% | $149,406,980 |
| ORA | Aura Minerals Inc. | -4% | -8% | 13% | $644,359,941 |
| VML | Viscount Mining Corp. | -4% | -27% | -31% | $19,706,739 |
| IPT | IMPACT Silver Corp. | -4% | -19% | -33% | $44,386,886 |
| TUF | Honey Badger Silver Inc. | -4% | -26% | -50% | $4,611,671 |
| VGZ | Vista Gold Corp. | -4% | -18% | -1% | $78,065,557 |
| ZFR | Zephyr Minerals Ltd. | -4% | 5% | 16% | $7,819,568 |
| PNPN | Power Nickel Inc. | -4% | -10% | 16% | $26,432,491 |
| NEXT | NextSource Materials Inc. | -5% | -3% | -30% | $238,915,979 |
| TAU | Thesis Gold Inc. | -5% | -13% | -25% | $41,646,301 |
| WRLG | West Red Lake Gold Mines Ltd. | -5% | -9% | 22% | $34,432,812 |
| NBY | Niobay Metals Inc. | -5% | 25% | -41% | $7,130,152 |
| RDU | Radius Gold Inc. | -5% | 11% | 5% | $19,683,707 |
| TSD | Tsodilo Resources Limited | -5% | 5% | 0% | $10,467,604 |
| AUMB | 1911 Gold Corporation | -5% | 0% | -38% | $6,821,616 |
| NEV | Nevada Sunrise Metals Corporation | -5% | -20% | -52% | $10,482,609 |
| SURG | SURGE COPPER CORP. | -5% | -23% | -20% | $20,624,546 |
| LIS | Lithium South Development Corporation | -5% | -22% | 1% | $47,480,776 |
| KDK | Kodiak Copper Corp. | -5% | 6% | -32% | $48,497,164 |
| ANTL | Antler Gold Inc. | -5% | -5% | -58% | $7,678,939 |
| ECR | Cartier Resources Inc. | -5% | -10% | 0% | $30,997,937 |
| PA | Palamina Corp. | -5% | -14% | 19% | $6,772,059 |
| MTB | MTB Metals Corp. | -5% | -17% | -14% | $10,169,195 |
| KIB | Kiboko Gold Inc. | -5% | -27% | -49% | $4,193,024 |
| PMET | Patriot Battery Metals Inc. | -5% | -1% | 128% | $1,397,371,009 |
| USA | Americas Gold and Silver Corporation | -5% | -21% | -40% | $98,630,022 |
| ITH | International Tower Hill Mines Ltd. | -5% | -20% | -4% | $109,375,383 |
| GRG | Golden Arrow Resources Corporation | -5% | -28% | -5% | $10,472,242 |
| TBK | Trailbreaker Resources Ltd. | -5% | 21% | 174% | $6,881,580 |
| AMO | Altan Rio Minerals Limited | -6% | 0% | 143% | $11,398,751 |
| GLDL | Gold Line Resources Ltd. | -6% | -6% | -43% | $3,288,971 |
| NILI | Surge Battery Metals Inc. | -6% | 19% | 39% | $61,647,136 |
| AZS | Arizona Silver Exploration Inc. | -6% | -35% | 16% | $23,187,474 |
| TI | Titan Mining Corporation | -6% | -14% | -14% | $56,430,877 |
| RAK | Rackla Metals Inc. | -6% | 78% | -24% | $18,624,419 |
| BZ | Benz Mining Corp. | -6% | 38% | -2% | $67,160,631 |
| MNRL | Monumental Minerals Corp. | -6% | 7% | -50% | $4,606,986 |
| WHY | West High Yield (W.H.Y.) Resources Ltd. | -6% | 5% | -20% | $26,963,856 |
| CVV | CanAlaska Uranium Ltd. | -6% | 2% | -19% | $38,582,701 |
| ANK | Angkor Resources Corp. | -6% | -11% | -6% | $13,637,622 |
| ERA | Elcora Advanced Materials Corp. | -6% | -11% | 45% | $13,470,161 |
| NWST | Northwest Copper Corp. | -6% | -11% | -24% | $30,361,480 |
| SGLD | Sabre Gold Mines Corp. | -6% | -6% | -3% | $11,086,545 |
| RSMX | Regency Silver Corp. | -6% | -11% | -19% | $19,301,622 |
| EPL | Eagle Plains Resources Ltd. | -6% | -2% | 21% | $25,407,117 |
| GOT | Goliath Resources Limited | -6% | 21% | -30% | $64,691,526 |
| LEO | Lion Copper and Gold Corp. | -6% | 0% | 15% | $23,217,598 |
| BHLI | Bradda Head Lithium Limited | -6% | -6% | -32% | $29,295,708 |
| CMU | Comet Industries Ltd. | -6% | -6% | -15% | $19,260,356 |
| GEN | Generation Gold Corp. | -6% | -6% | -25% | $871,825 |
| ILI | Imagine Lithium Inc. | -6% | -6% | 0% | $20,784,602 |
| QCCU | QC Copper and Gold Inc. | -6% | -9% | -9% | $25,979,447 |
| DCMC | Dore Copper Mining Corp. | -6% | -21% | -56% | $14,681,115 |
| ZON | Zonte Metals Inc. | -6% | -21% | -29% | $5,218,497 |
| AMI | Athabasca Minerals Inc. | -6% | -25% | -64% | $5,893,701 |
| DEFN | Defense Metals Corp. | -6% | -8% | 5% | $56,271,506 |
| NKL | Nickel 28 Capital Corp. | -6% | -19% | 11% | $107,320,822 |
| HSTR | Heliostar Metals Ltd. | -6% | -21% | 50% | $53,198,500 |
| SBI | Serabi Gold plc | -7% | -7% | -4% | $32,565,857 |
| MOON | Blue Moon Metals Inc. | -7% | 0% | -30% | $1,848,286 |
| MGM | Maple Gold Mines Ltd. | -7% | -7% | -22% | $49,173,989 |
| RRI | Riverside Resources Inc. | -7% | -7% | 4% | $9,575,248 |
| SM | Sierra Madre Gold and Silver Ltd. | -7% | -43% | -43% | $59,933,328 |
| CNT | Century Global Commodities Corporation | -7% | -22% | -7% | $6,895,320 |
| BRVO | Bravo Mining Corp. | -7% | 6% | 91% | $429,780,444 |
| PGE | Stillwater Critical Minerals Corp. | -7% | 8% | 5% | $36,495,645 |
| MASS | Masivo Silver Corp. | -7% | -10% | -39% | $2,957,511 |
| KTO | K2 Gold Corporation | -7% | -21% | -13% | $11,991,393 |
| SOLG | SolGold plc | -7% | -4% | -4% | $810,298,883 |
| GMTN | Gold Mountain Mining Corp. | -7% | -23% | 8% | $11,865,612 |
| PEAK | Sun Peak Metals Corp. | -7% | -13% | -2% | $17,419,727 |
| MNTR | Mantaro Precious Metals Corp. | -7% | 86% | 44% | $4,666,593 |
| SDR | Stroud Resources Ltd. | -7% | 18% | -61% | $3,355,508 |
| GPG | Grande Portage Resources Ltd. | -7% | 3% | -29% | $23,308,762 |
| NICN | NICAN Limited | -7% | -7% | -35% | $4,857,923 |
| AGMR | Silver Mountain Resources Inc. | -7% | -7% | -57% | $28,271,082 |
| VCV | Vatic Ventures Corp. | -7% | -7% | -26% | $3,894,996 |
| ACOP | Atacama Copper Corporation | -7% | -24% | -19% | $4,124,779 |
| JRV | Jervois Global Limited | -7% | -24% | -75% | $135,200,000 |
| LUM | Lumina Gold Corp. | -7% | 2% | 44% | $193,471,699 |
| SOMA | Soma Gold Corp. | -7% | -9% | 55% | $46,587,728 |
| GXS | Goldsource Mines Inc. | -7% | -14% | -29% | $19,134,938 |
| FTJ | Fort St. James Nickel Corp. | -7% | -7% | 317% | $3,031,033 |
| FOR | Fortune Bay Corp. | -8% | -8% | -40% | $7,939,047 |
| WML | Wealth Minerals Ltd. | -8% | -13% | -20% | $124,838,537 |
| AZT | Aztec Minerals Corp. | -8% | -11% | -11% | $23,223,002 |
| ZAC | Zacatecas Silver Corp. | -8% | -10% | -59% | $26,671,242 |
| MIN | Excelsior Mining Corp. | -8% | 16% | 65% | $75,538,189 |
| OMG | Omai Gold Mines Corp. | -8% | 9% | -8% | $22,670,756 |
| IMM | International Metals Mining Corp. | -8% | 2% | 253% | $4,838,219 |
| BMK | MacDonald Mines Exploration Ltd. | -8% | 0% | 0% | $1,642,395 |
| CRI | Churchill Resources Inc. | -8% | -8% | -37% | $5,076,036 |
| GEM | Green Battery Minerals Inc. | -8% | -8% | 33% | $4,493,777 |
| VGN | Greencastle Resources Ltd. | -8% | -8% | -8% | $2,401,360 |
| MMM | Minco Capital Corp. | -8% | -8% | 33% | $2,668,793 |
| MUR | Murchison Minerals Ltd. | -8% | -8% | -52% | $14,183,777 |
| OMI | Orosur Mining Inc. | -8% | -25% | -33% | $11,313,618 |
| GLD | GoldON Resources Ltd. | -8% | -33% | -50% | $1,862,758 |
| ELBM | Electra Battery Materials Corporation | -8% | -11% | -43% | $45,452,200 |
| COG | Condor Gold plc | -8% | -13% | 31% | $72,316,330 |
| TEM | Tembo Gold Corp. | -8% | -6% | -11% | $17,941,235 |
| TECT | Tectonic Metals Inc. | -8% | 5% | -33% | $30,745,796 |
| NZP | Chatham Rock Phosphate Limited | -8% | 0% | -27% | $9,386,222 |
| VGD | Visible Gold Mines Inc. | -8% | -4% | 0% | $3,858,474 |
| RK | Rockhaven Resources Ltd. | -8% | -8% | -21% | $13,806,824 |
| SFR | Sandfire Resources America Inc. | -8% | -8% | -19% | $112,568,807 |
| BEX | Benton Resources Inc. | -8% | -15% | -56% | $8,253,811 |
| PERU | Chakana Copper Corp. | -8% | -15% | -39% | $9,324,109 |
| MARV | Marvel Discovery Corp. | -8% | -21% | -39% | $7,135,314 |
| SYG | Sylla Gold Corp. | -8% | -27% | -39% | $2,156,266 |
| CYL | Ceylon Graphite Corp. | -8% | -31% | -15% | $8,751,234 |
| ASND | Ascendant Resources Inc. | -8% | -21% | -33% | $21,833,593 |
| MD | Midland Exploration Inc. | -8% | 4% | 38% | $45,331,108 |
| CDA | Canuc Resources Corporation | -9% | 129% | 220% | $18,440,984 |
| SGO | Sonoro Gold Corp. | -9% | -6% | -27% | $10,760,324 |
| ELEF | Silver Elephant Mining Corp. | -9% | -18% | -20% | $10,304,614 |
| CLUS | Colossus Resources Corp. | -9% | -9% | 17% | $2,852,451 |
| EXN | Excellon Resources Inc. | -9% | -37% | -52% | $8,112,525 |
| BRO | Barksdale Resources Corp. | -9% | -16% | -19% | $51,085,964 |
| FMAN | Freeman Gold Corp. | -9% | -24% | -30% | $20,421,480 |
| RBX | Robex Resources Inc. | -9% | 5% | -10% | $278,537,953 |
| MUN | Mundoro Capital Inc. | -9% | 3% | 11% | $20,761,111 |
| CBG | Chibougamau Independent Mines Inc. | -9% | -5% | 18% | $6,106,554 |
| AIR | Clean Air Metals Inc. | -9% | -17% | -62% | $11,189,931 |
| DMI | Diamcor Mining Inc. | -9% | -17% | -50% | $13,171,551 |
| EMN | Euro Manganese Inc. | -9% | -17% | -48% | $60,400,384 |
| TEA | Tearlach Resources Limited | -9% | -33% | -96% | $8,388,261 |
| GDM | Goldstar Minerals Inc. | -9% | -38% | -29% | $1,635,526 |
| GGA | Goldgroup Mining Inc. | -9% | 0% | -57% | $1,431,183 |
| GPH | Graphite One Inc. | -9% | -12% | 12% | $146,737,046 |
| SKYG | Sky Gold Corp. | -10% | -14% | 6% | $3,382,247 |
| TGM | Trillium Gold Mines Inc. | -10% | -14% | -55% | $13,485,344 |
| TIN | Tincorp Metals Inc. | -10% | -8% | -27% | $21,963,950 |
| EGM | Engold Mines Ltd. | -10% | 0% | -31% | $1,673,170 |
| PJX | PJX Resources Inc. | -10% | 0% | -10% | $11,989,484 |
| SIE | Sienna Resources Inc. | -10% | 0% | 13% | $8,291,849 |
| EVER | Evergold Corp. | -10% | -10% | -18% | $3,369,978 |
| GQC | GoldQuest Mining Corp. | -10% | -10% | -40% | $23,349,815 |
| KTR | Kintavar Exploration Inc. | -10% | -10% | 0% | $6,427,856 |
| DEC | Decade Resources Ltd. | -10% | -18% | -5% | $6,367,655 |
| EVNI | EV Nickel Inc. | -10% | -18% | -25% | $4,625,724 |
| MDL | Medallion Resources Ltd. | -10% | -18% | -57% | $3,158,750 |
| ABI | Abcourt Mines Inc. | -10% | -25% | -18% | $19,264,883 |
| KCC | Kincora Copper Limited | -10% | -25% | -25% | $7,495,809 |
| TSK | Talisker Resources Ltd. | -10% | -25% | -33% | $34,543,154 |
| TRBC | Tribeca Resources Corporation | -10% | 9% | 17% | $18,247,809 |
| LN | Loncor Gold Inc. | -10% | -22% | 17% | $53,600,461 |
| HMR | Homerun Resources Inc. | -11% | 12% | 280% | $17,671,720 |
| EMM | Giyani Metals Corp. | -11% | -11% | -14% | $27,434,762 |
| MKA | Mkango Resources Ltd. | -11% | -8% | -18% | $40,166,093 |
| AME | Abacus Mining & Exploration Corporation | -11% | 14% | 33% | $5,437,995 |
| AAZ | Azincourt Energy Corp. | -11% | 14% | -11% | $8,293,861 |
| GXX | Gold Basin Resources Corporation | -11% | -3% | 33% | $17,358,056 |
| KG | Klondike Gold Corp. | -11% | -11% | -16% | $13,509,244 |
| SAO | South Atlantic Gold Inc. | -11% | -11% | 33% | $3,977,267 |
| GUG | Gungnir Resources Inc. | -11% | -27% | -47% | $4,785,191 |
| OLV | Olivut Resources Ltd. | -11% | -27% | 60% | $2,753,624 |
| YORK | York Harbour Metals Inc. | -11% | -40% | -70% | $10,964,631 |
| AVA | Avante Mining Corp. | -11% | -47% | -41% | $2,011,142 |
| MAW | Mawson Gold Limited | -11% | 0% | -30% | $47,169,730 |
| RMI | Ridgestone Mining Inc. | -11% | 11% | 55% | $821,691 |
| LEM | Leading Edge Materials Corp. | -11% | -6% | 3% | $25,656,148 |
| AWE | Thunderstruck Resources Ltd. | -11% | -31% | -56% | $3,937,397 |
| KGS | Kingman Minerals Ltd. | -12% | -4% | 15% | $797,560 |
| GOG | Golden Tag Resources Ltd. | -12% | -23% | -49% | $23,850,702 |
| LMG | Lincoln Gold Mining Inc. | -12% | 12% | 9% | $1,469,203 |
| TK | Tinka Resources Limited | -12% | 30% | 11% | $58,695,589 |
| ELR | Eastern Platinum Limited | -12% | -32% | -50% | $15,142,607 |
| NBM | NEO Battery Materials Ltd. | -12% | 32% | 47% | $33,320,313 |
| WEX | Western Exploration Inc. | -12% | -20% | -5% | $42,372,467 |
| GEL | Graphano Energy Ltd. | -12% | -25% | -29% | $3,030,888 |
| FPX | FPX Nickel Corp. | -12% | -9% | 8% | $127,354,779 |
| CCB | Canada Carbon Inc. | -13% | 0% | -42% | $6,800,148 |
| ETF | Eastfield Resources Ltd. | -13% | 0% | -13% | $1,944,655 |
| RUSH | Carolina Rush Corporation | -13% | -7% | -69% | $3,839,672 |
| FEO | Oceanic Iron Ore Corp. | -13% | -7% | 0% | $7,140,000 |
| AFR | AFR NuVenture Resources Inc. | -13% | -13% | 17% | $631,354 |
| DGO | Durango Resources Inc. | -13% | -13% | -36% | $3,297,241 |
| ROVR | Rover Metals Corp. | -13% | -13% | -22% | $3,232,580 |
| PLY | Playfair Mining Ltd. | -13% | -22% | -22% | $4,462,401 |
| BVA | Bravada Gold Corporation | -13% | -30% | 0% | $5,265,540 |
| CUCO | African Energy Metals Inc. | -13% | -42% | -90% | $709,515 |
| ORV | Orvana Minerals Corp. | -13% | -27% | -34% | $18,444,128 |
| NMI | Namibia Critical Metals Inc. | -13% | -9% | -31% | $19,663,440 |
| SIC | Sokoman Minerals Corp. | -13% | -29% | -66% | $22,907,805 |
| GSPR | GSP Resource Corp. | -13% | -33% | 25% | $2,258,994 |
| RKR | Rokmaster Resources Corp. | -13% | -13% | -13% | $9,960,631 |
| WLF | Wolfden Resources Corporation | -13% | -16% | -28% | $21,426,294 |
| EOX | Euromax Resources Ltd. | -13% | -19% | -28% | $31,850,866 |
| NG | NovaGold Resources Inc. | -14% | -23% | -35% | $1,753,618,004 |
| DSLV | Denarius Metals Corp. | -14% | 15% | -12% | $29,989,070 |
| AUMN | Golden Minerals Company | -14% | -61% | -77% | $15,021,691 |
| LME | Laurion Mineral Exploration Inc. | -14% | -10% | -5% | $110,578,738 |
| DMX | District Metals Corp. | -14% | -10% | 20% | $10,163,167 |
| AALI | Advance Lithium Corp. | -14% | -14% | 100% | $2,505,494 |
| AGLD | Austral Gold Limited | -14% | -14% | -14% | $18,369,341 |
| CTM | Canterra Minerals Corporation | -14% | -14% | 9% | $6,008,062 |
| KS | Klondike Silver Corp. | -14% | -14% | -25% | $7,888,771 |
| LVX | Leviathan Gold Ltd. | -14% | -14% | -14% | $2,993,515 |
| MON | Montero Mining and Exploration Ltd. | -14% | -14% | -14% | $1,159,425 |
| NOC | Norseman Silver Inc. | -14% | -14% | -50% | $4,427,680 |
| TMRR | Tempus Resources Ltd. | -14% | -14% | -40% | $7,461,965 |
| GBRC | Gold Bull Resources Corp. | -14% | -20% | 9% | $5,900,812 |
| TAJ | Tajiri Resources Corp. | -14% | -25% | -25% | $3,772,699 |
| CAND | Candelaria Mining Corp. | -14% | -33% | -57% | $4,496,239 |
| SCLT | Searchlight Resources Inc. | -14% | -33% | -57% | $3,315,318 |
| KRL | Kainantu Resources Ltd. | -14% | -57% | -68% | $3,549,978 |
| GBAR | Monarch Mining Corporation | -14% | -40% | -50% | $7,314,656 |
| YRB | Yorbeau Resources Inc. | -14% | -40% | -33% | $12,507,078 |
| QPM | Quebec Precious Metals Corporation | -15% | 6% | 21% | $7,089,022 |
| ZNX | Zincx Resources Corp. | -15% | -11% | 21% | $15,121,172 |
| REYG | Reyna Gold Corp. | -15% | -19% | -45% | $5,695,529 |
| LILI | Li3 Lithium Corp. | -15% | -43% | -23% | $3,223,433 |
| KRN | Karnalyte Resources Inc. | -15% | -17% | -23% | $9,058,277 |
| TNR | TNR Gold Corp. | -15% | 0% | 38% | $10,503,503 |
| DAU | Desert Gold Ventures Inc. | -15% | -31% | -15% | $10,750,651 |
| DFR | DFR Gold Inc. | -16% | -11% | -24% | $14,533,668 |
| GRC | Gold Springs Resource Corp. | -16% | -27% | -38% | $20,930,470 |
| FRED | Fredonia Mining Inc. | -17% | 33% | -17% | $17,715,544 |
| VERT | Vertical Exploration Inc. | -17% | 11% | 67% | $6,780,623 |
| QRO | Quadro Resources Ltd. | -17% | 0% | -44% | $835,348 |
| RG | Romios Gold Resources Inc. | -17% | 0% | -17% | $6,046,828 |
| FMC | Forum Energy Metals Corp. | -17% | -12% | -21% | $15,134,810 |
| ULT | Ultra Lithium Inc. | -17% | -17% | -58% | $8,436,586 |
| TBR | Timberline Resources Corporation | -17% | -21% | -61% | $9,331,462 |
| WKG | WestKam Gold Corp. | -17% | -25% | -12% | $1,705,133 |
| BOCA | Bocana Resources Corp. | -17% | -29% | -84% | $2,530,692 |
| DMR | Damara Gold Corp. | -17% | -29% | -44% | $1,837,885 |
| KNC | K9 Gold Corp. | -17% | -29% | -55% | $2,704,080 |
| SGZ | Sego Resources Inc. | -17% | -29% | 25% | $3,692,344 |
| MDM | Madoro Metals Corp. | -17% | -38% | -44% | $1,966,168 |
| AVL | Avalon Advanced Materials Inc. | -17% | 14% | 0% | $68,902,490 |
| NCP | Nickel Creek Platinum Corp. | -17% | -17% | -55% | $13,983,859 |
| FMN | Fidelity Minerals Corp. | -18% | -22% | 17% | $6,005,665 |
| GSP | Gensource Potash Corporation | -18% | -4% | -21% | $52,651,919 |
| SDCU | Sonoran Desert Copper Corporation | -18% | 13% | 0% | $3,557,388 |
| KIP | Kiplin Metals Inc. | -18% | -39% | -25% | $17,659,437 |
| VEIN | Pasofino Gold Limited | -19% | -31% | -22% | $17,129,985 |
| KALO | Kalo Gold Corp. | -19% | 44% | -52% | $7,750,961 |
| GLI | Glacier Lake Resources Inc. | -19% | -19% | 86% | $1,407,416 |
| REE | E-Tech Resources Inc. | -19% | -28% | -28% | $5,393,149 |
| XAM | Xanadu Mines Ltd | -19% | 70% | 193% | $132,663,759 |
| DLTA | Delta Resources Limited | -20% | -29% | 154% | $30,107,614 |
| GER | Glen Eagle Resources Inc. | -20% | 33% | 100% | $3,219,345 |
| LOT | TomaGold Corporation | -20% | 0% | -43% | $3,234,345 |
| AVG | Avidian Gold Corp. | -20% | -20% | -50% | $4,635,280 |
| ARIC | Awale Resources Limited | -20% | -20% | -17% | $4,766,795 |
| CRB | Cariboo Rose Resources Ltd. | -20% | -20% | 33% | $1,898,476 |
| EMR | Emergent Metals Corp. | -20% | -20% | -60% | $2,583,557 |
| FLYN | Flying Nickel Mining Corp. | -20% | -20% | -41% | $5,539,090 |
| IXI | Indigo Exploration Inc. | -20% | -20% | 243% | $7,878,962 |
| ARU | Aurania Resources Ltd. | -21% | 30% | -23% | $20,069,516 |
| CANX | Canex Metals Inc | -21% | -21% | -42% | $5,801,761 |
| SMN | Sun Summit Minerals Corp. | -21% | -42% | -61% | $6,014,597 |
| EMNT | Eminent Gold Corp. | -22% | 5% | -26% | $14,796,334 |
| SAG | Sterling Metals Corp. | -22% | -33% | -72% | $7,510,818 |
| TM | Trigon Metals Inc. | -23% | -14% | 12% | $32,377,208 |
| CLIC | Comet Lithium Corporation | -23% | -30% | -12% | $6,928,136 |
| GHL | Goldhills Holding Ltd. | -23% | 11% | -17% | $1,158,434 |
| LBC | Libero Copper & Gold Corporation | -24% | -43% | -58% | $6,626,106 |
| RLYG | Riley Gold Corp. | -24% | -30% | -26% | $4,505,603 |
| PEMC | Pacific Empire Minerals Corp. | -25% | 0% | -25% | $1,355,223 |
| BGF | Beauce Gold Fields Inc. | -25% | -10% | -18% | $3,360,624 |
| BHS | Bayhorse Silver Inc. | -25% | -25% | -63% | $3,772,189 |
| MTH | Mammoth Resources Corp. | -25% | -25% | -57% | $1,009,946 |
| OWN | Rex Resources Corp. | -25% | -25% | 15% | $839,196 |
| SMY | Search Minerals Inc. | -25% | -25% | -65% | $14,577,045 |
| SSE | Silver Spruce Resources Inc. | -25% | -25% | -25% | $3,011,393 |
| CTN | Centurion Minerals Ltd. | -25% | -40% | 0% | $472,036 |
| LG | Lahontan Gold Corp. | -26% | -19% | 117% | $16,377,917 |
| RBZ | Arya Resources Ltd. | -27% | 22% | 120% | $2,795,099 |
| MAE | Maritime Resources Corp. | -27% | 33% | -11% | $18,972,344 |
| VO | Valore Metals Corp. | -28% | -54% | -76% | $12,168,810 |
| GCN | Goldcliff Resource Corporation | -29% | -38% | -17% | $1,647,698 |
| MEK | Metals Creek Resources Corp. | -29% | -38% | -44% | $4,488,368 |
| TRU | TRU Precious Metals Corp. | -29% | -38% | -58% | $2,561,000 |
| BIGT | Big Tree Carbon Inc. | -29% | -8% | -14% | $6,799,191 |
| ORS | Orestone Mining Corp. | -30% | -13% | 40% | $1,983,108 |
| SGC | Solstice Gold Corp. | -30% | -30% | -50% | $7,487,982 |
| AML | Akwaaba Mining Ltd. | -33% | 0% | -33% | $2,051,875 |
| NOCR | Norden Crown Metals Corporation | -33% | 0% | -60% | $530,245 |
| GGL | GGL Resources Corp. | -33% | -17% | -50% | $3,092,874 |
| SMP | Southern Empire Resources Corp. | -33% | -23% | -50% | $3,351,140 |
| ESX | Essex Minerals Inc. | -33% | -33% | -33% | $881,788 |
| NORR | Norrland Gold Corp. | -33% | -54% | -57% | $1,032,000 |
| TBX | Turmalina Metals Corp. | -34% | 2% | -40% | $17,162,338 |
| OOR | Opus One Gold Corporation | -38% | -38% | 67% | $4,730,128 |
| GIG | XAU Resources Inc. | -38% | -43% | -60% | $504,460 |
| NGE | Nevada Exploration Inc. | -40% | -42% | -48% | $879,432 |
| PPX | Ppx Mining Corp. | -40% | 0% | 0% | $7,796,384 |
| EXG | ExGen Resources Inc. | -40% | -25% | -17% | $4,791,976 |
| MAS | Mas Gold Corp. | -57% | -50% | -63% | $3,068,017 |
| CMMC | Copper Mountain Mining Corporation | -100% | -100% | -100% | $533,814,848 |
Related Topics
Related Stories

UNLOCK INSIGHTS
Discover the untold stories of emerging ASX stocks.
Daily news and expert analysis, it's free to subscribe.
By proceeding, you confirm you understand that we handle personal information in accordance with our Privacy Policy.


